We all have a favourite beach. Whether it’s because of a special memory, spectacular scenery, or golden dunes, we all have a beach that is close to our hearts… Well, I know I do!
With many of us holidaying closer to home this year, I wanted to understand how reachable the British Isles’s best beaches are by car. I also was curious to find where the quietest, most exclusive, award-winning spots were to add to my bucket list this summer!
Data is key
To start, I explored data from Blue Flag Global and Keeping Scotland Beautiful to locate the most remarkable, environmentally friendly beaches across the British Isles. Luckily for me, I was able to quickly access a full list of beach locations from the official websites.
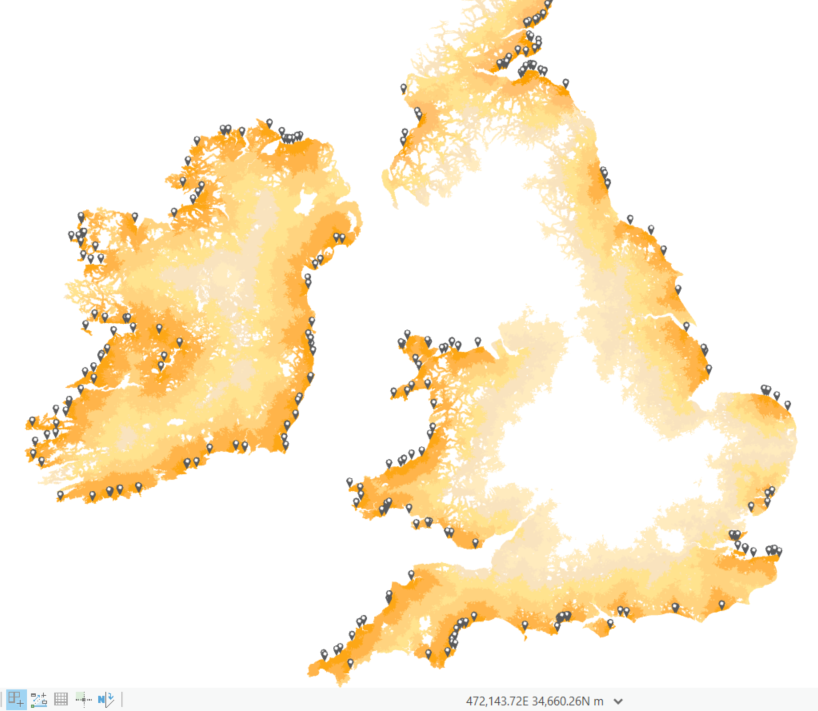
After exporting, I went ahead and plotted them into ArcGIS Pro.
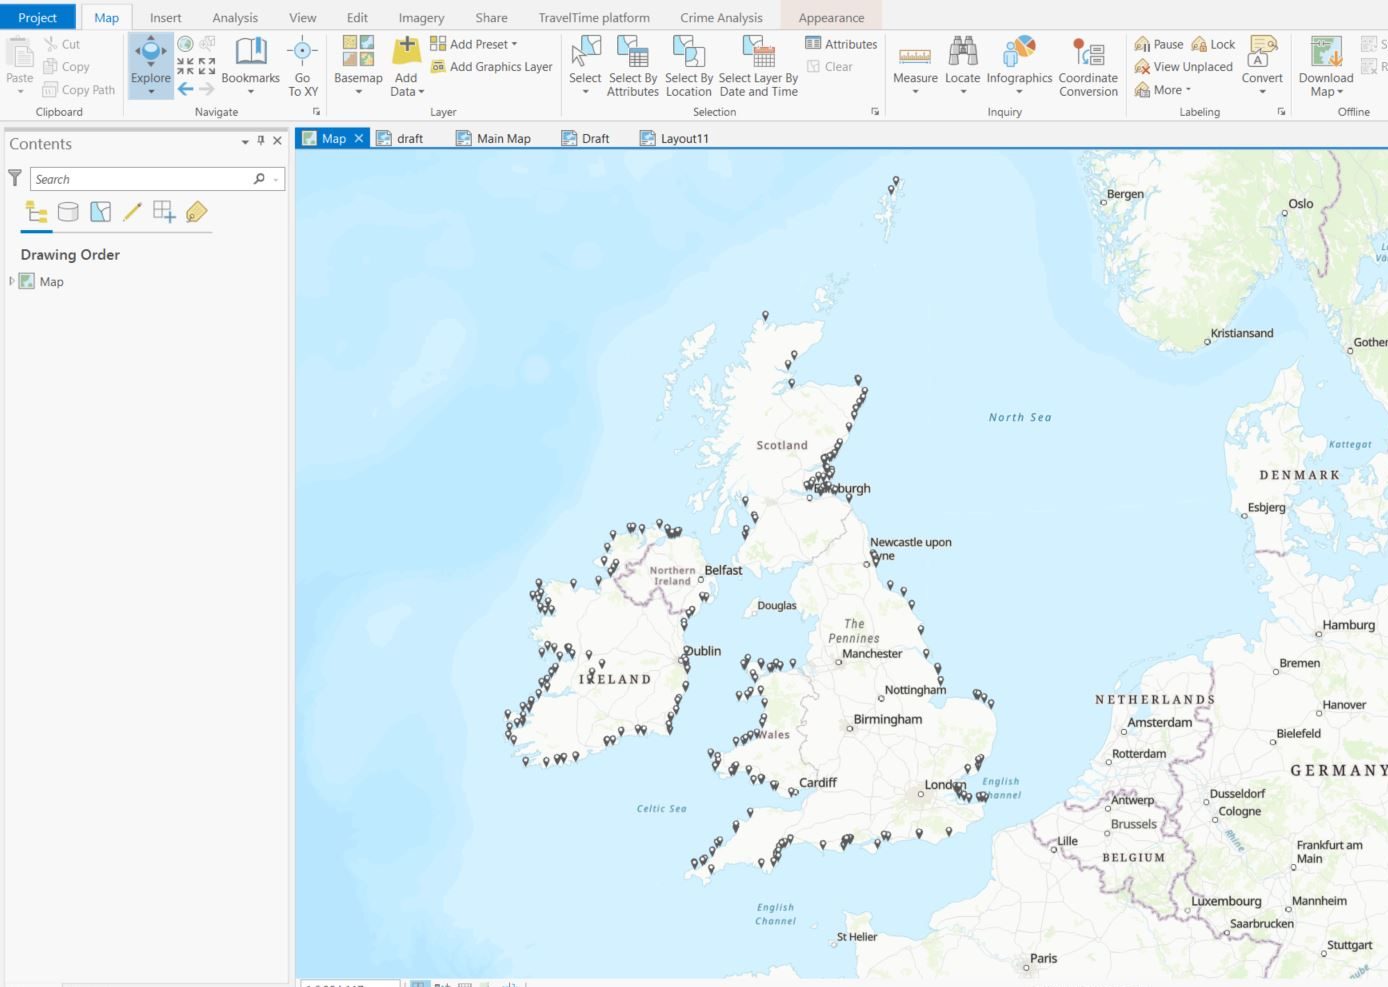
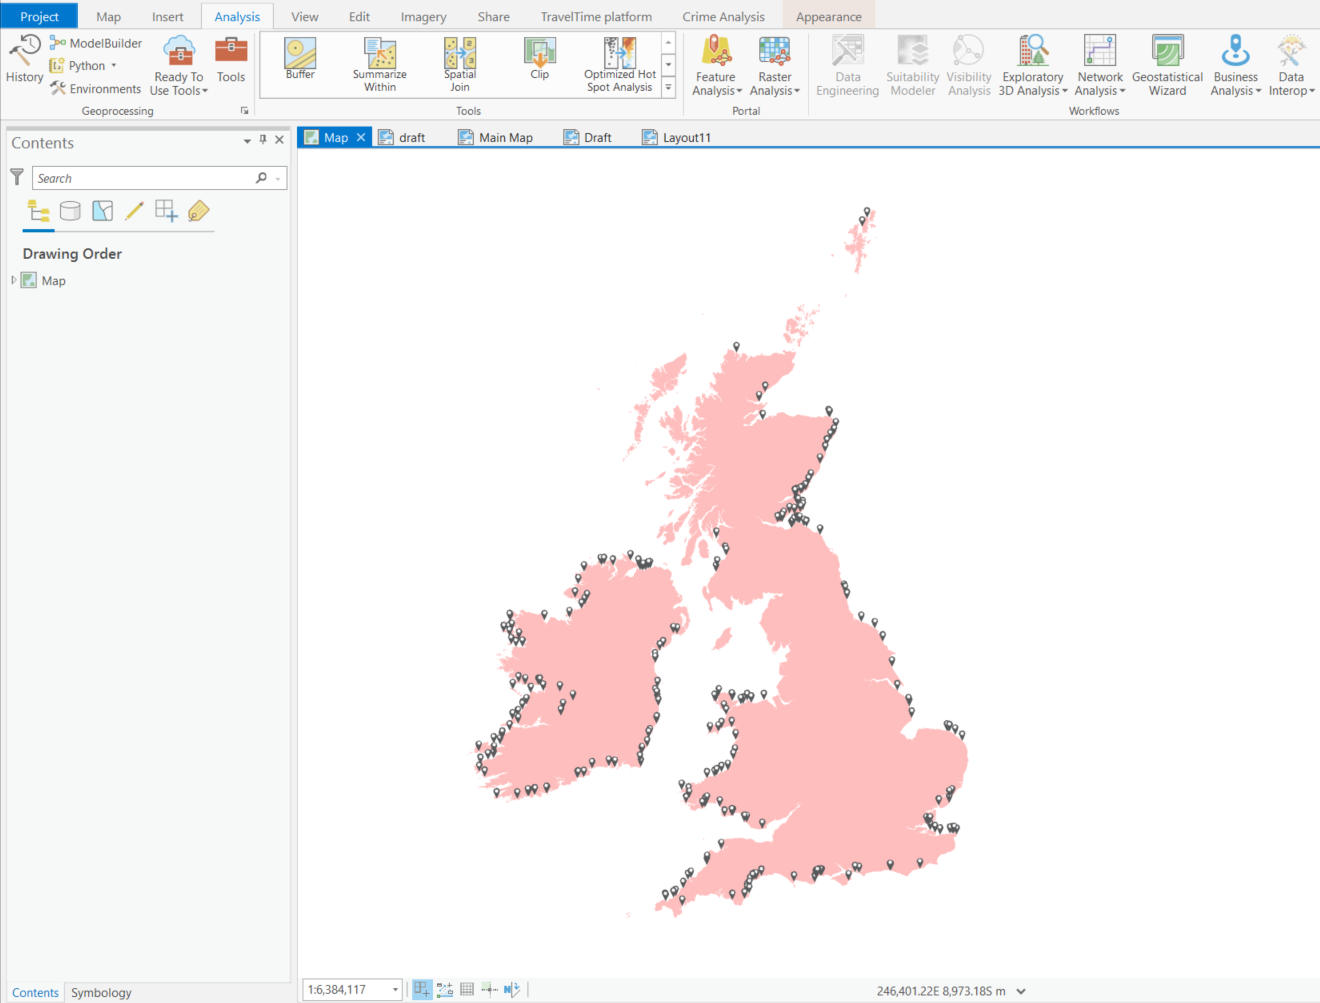
Using Pro, I was able to merge the two datasets to create a new layer containing the 262 award-winning beaches. I then removed the default Topographic basemap and pulled in a simple boundary layer for the British Isles from ArcGIS Living Atlas.
 The nitty gritty stuff
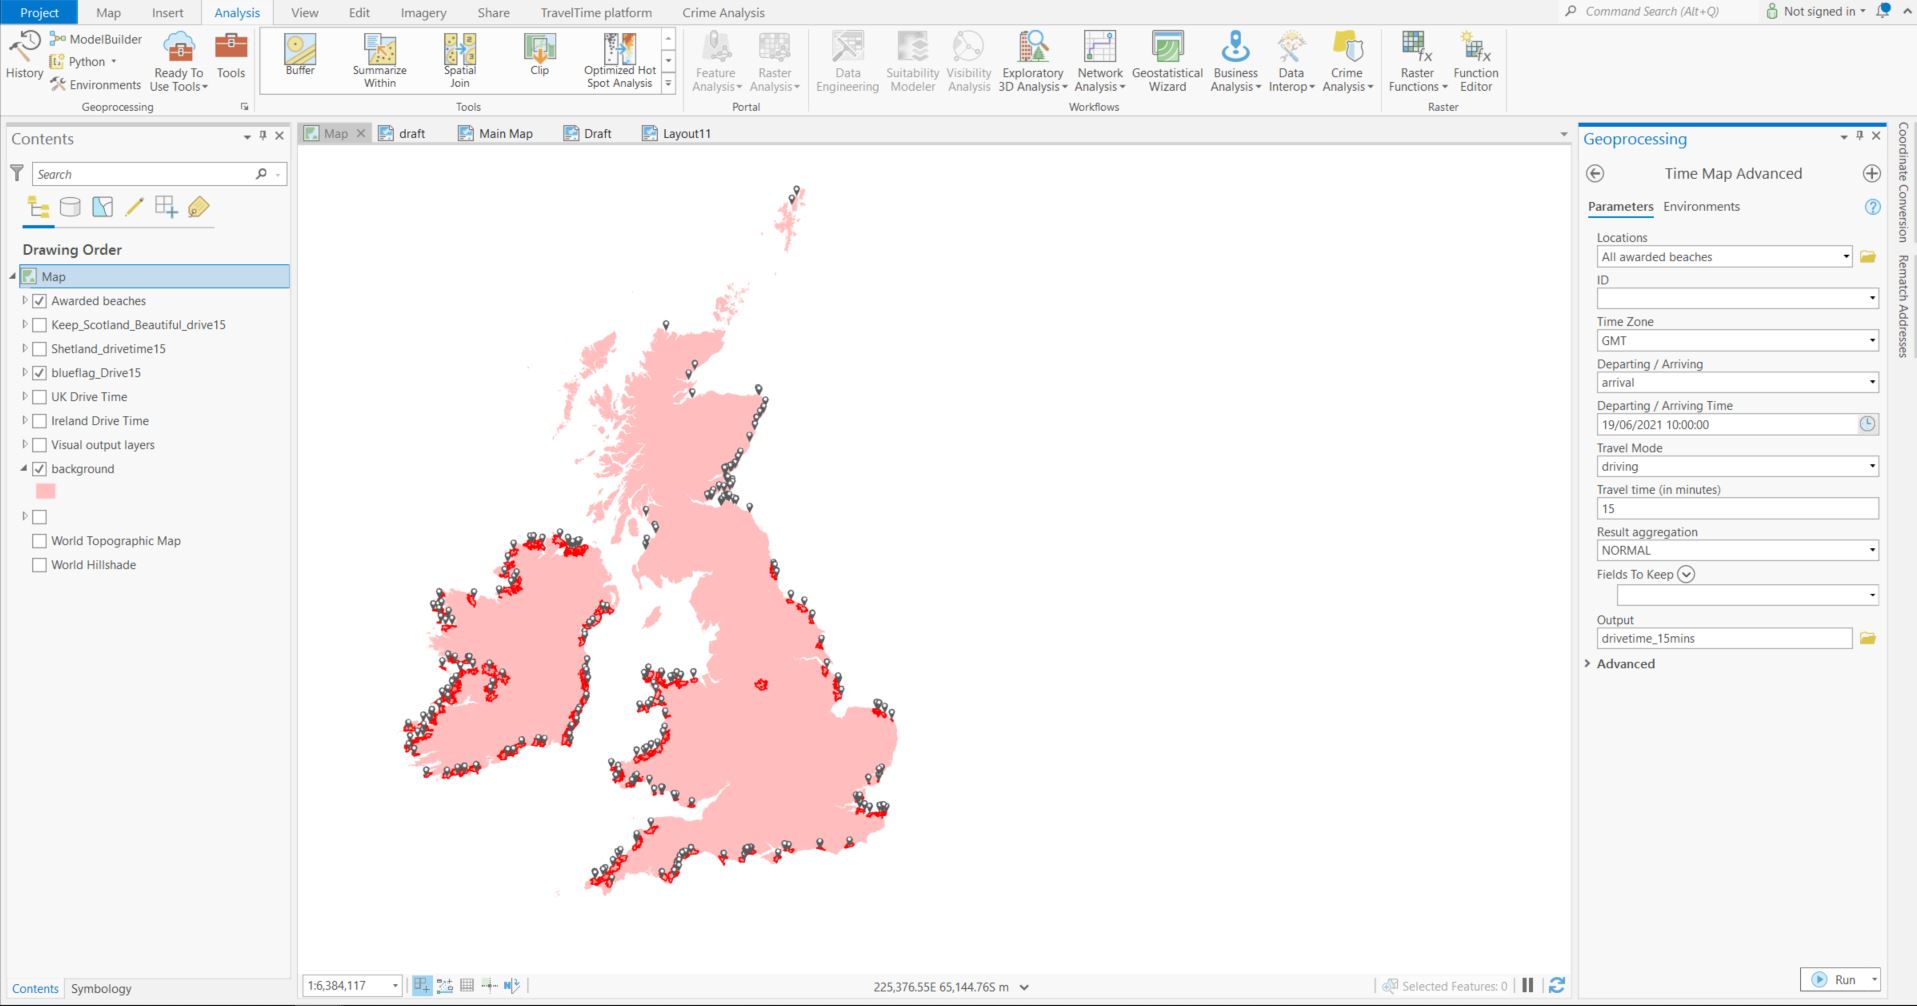
After plotting the locations, I was able to use some of Pro’s geoprocessing tools to start answering my questions. I used the TravelTimeAPI tool to calculate distance away from the award-winning beaches in six increments to represent drive times of 15, 30, 45, 60, 75, 90 mins. This revealed the areas of the country that were within a reasonable driving distance of the beaches.
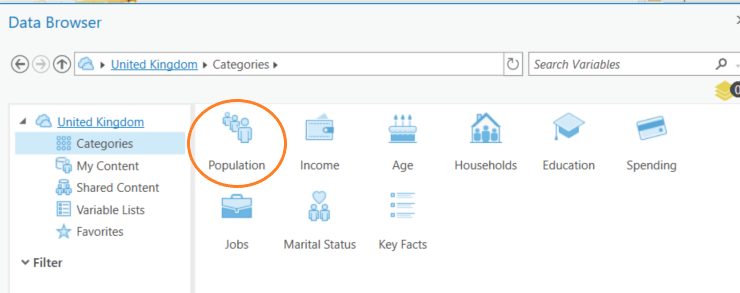
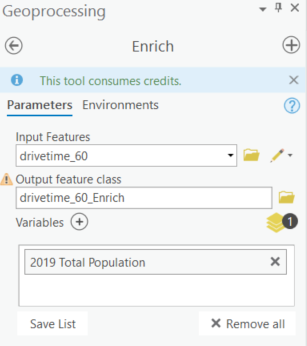
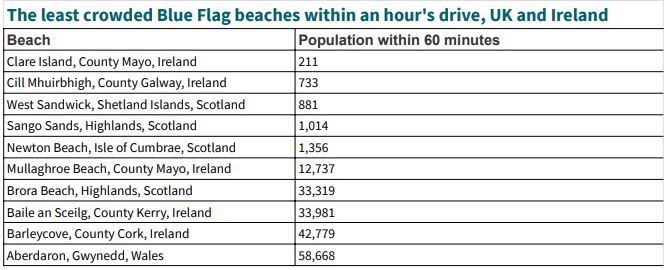
As I couldn’t retrieve specific data about how many people were visiting each beach, I could, however, enrich each polygon drive time area using Pro’s enrichment tool. This allowed me to add additional demographic insight such as population counts within the drive time areas, allowing me to infer how popular each beach might be. This was necessary for answering my next query about finding the quieter spots. For example, how many people live within an hour’s reach of an award-winning beach?
Results
Cartographic Inspiration
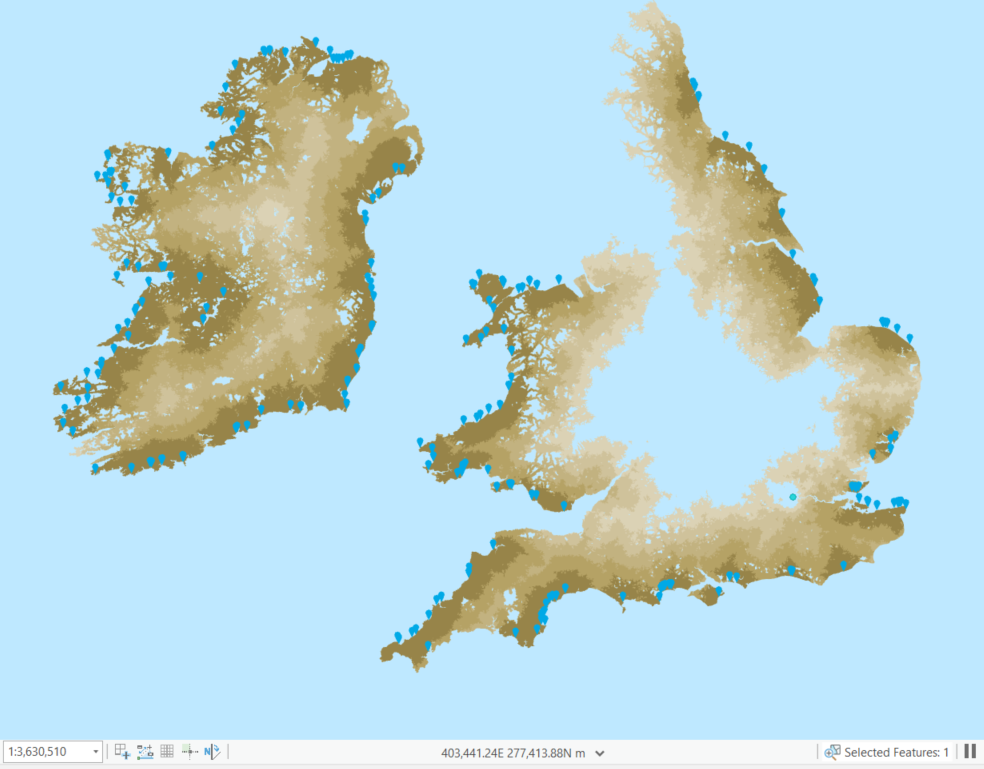
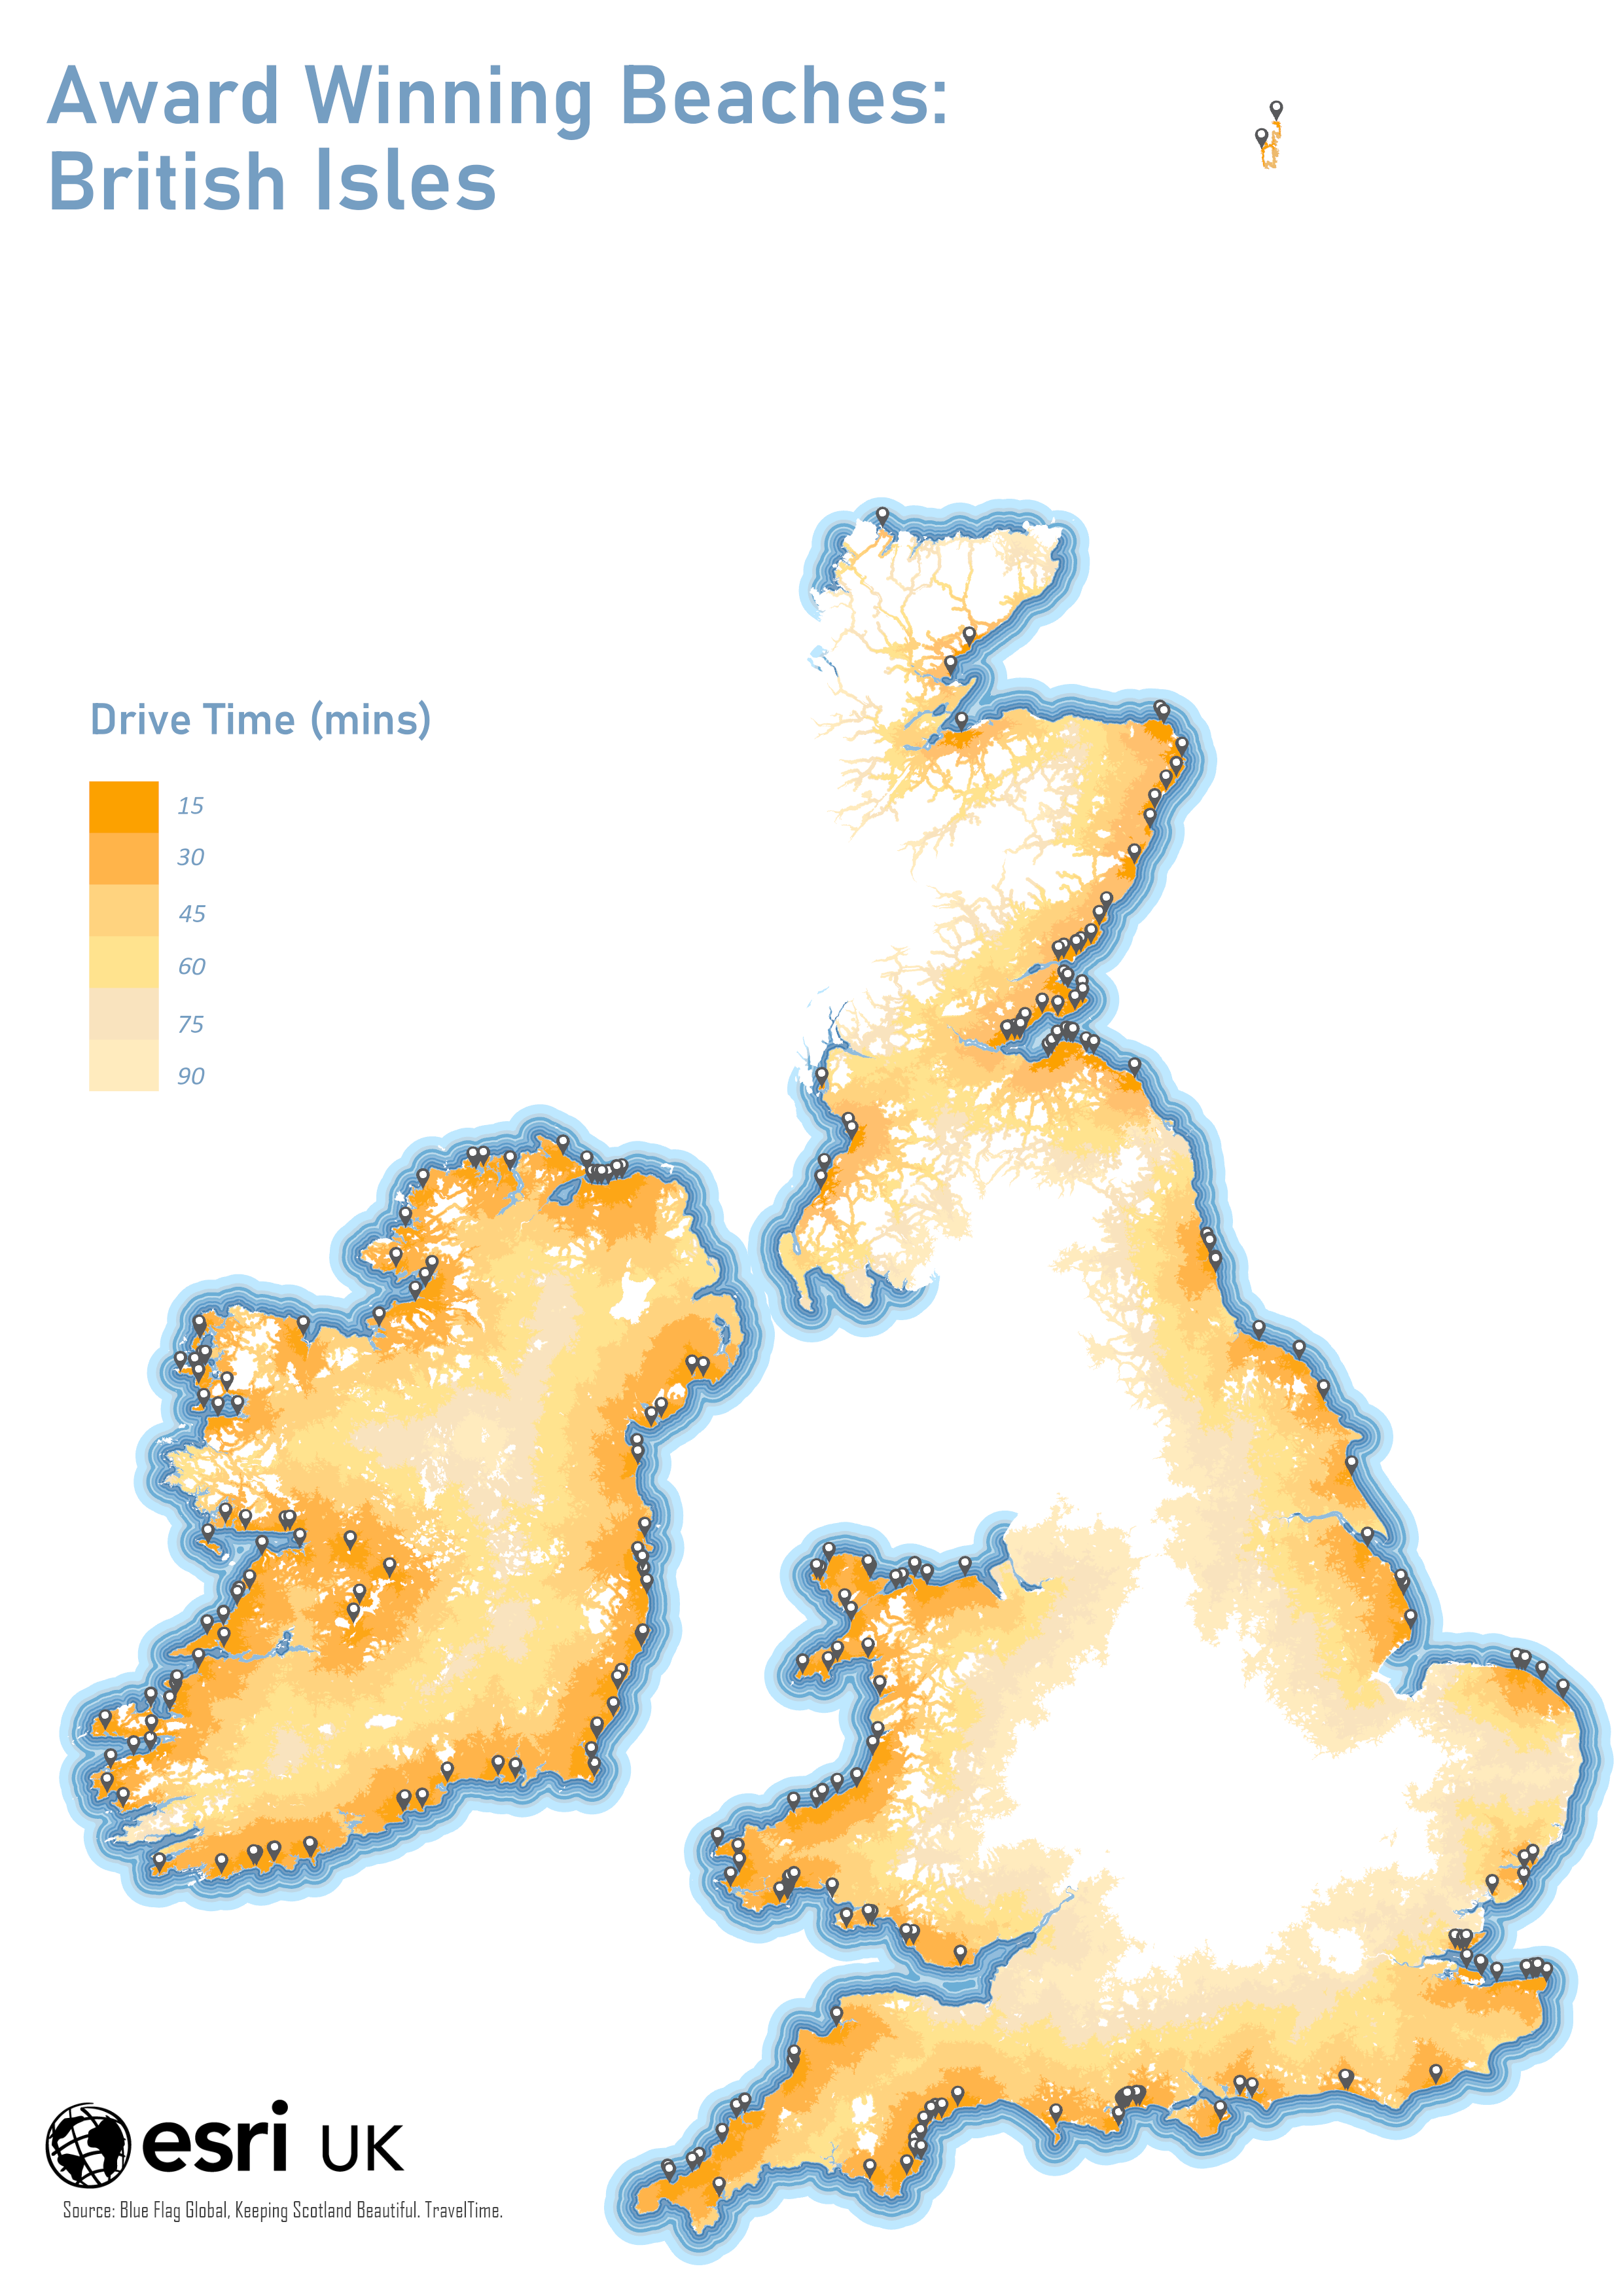
You may or may not be familiar with the Brexit Isles map but take a look to see the unconventional, stunning cut out of the UK which shaped the inspiration for this beach visual analysis. It was only until all the drive time increments were imported to the map that the inspiration grew for creating sand gradients that represented each drive time, and the rest of the land was to remain blank. Also, who doesn’t love the idea of one giant beach!
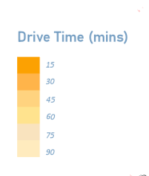
Before you scroll to the end for the finished product, it’s easier to get your head around this visual by looking at the drive time increments from the legend first.
The darker gradient represents 15 minutes and the lightest gradient represents 90 mins. Essentially the further away the drive time is from the coast the lighter the shade is until you reach the white wilderness of course!
We all love a before and after!
From marshy bogland sandbanks to tropical warm sandy bays. Take a look at this before and after to see how colour can revolutionise your feelings towards a map!… Make way for tropical warm sands, please!
Final touches
After a lot of trial and error with basemaps, backgrounds, symbology, it was clear that remaining simple yet effective won again. The confusion of blue points, backgrounds, and a ray of dark colours was not going to reveal effective information whilst maintaining an artistic high quality visual.
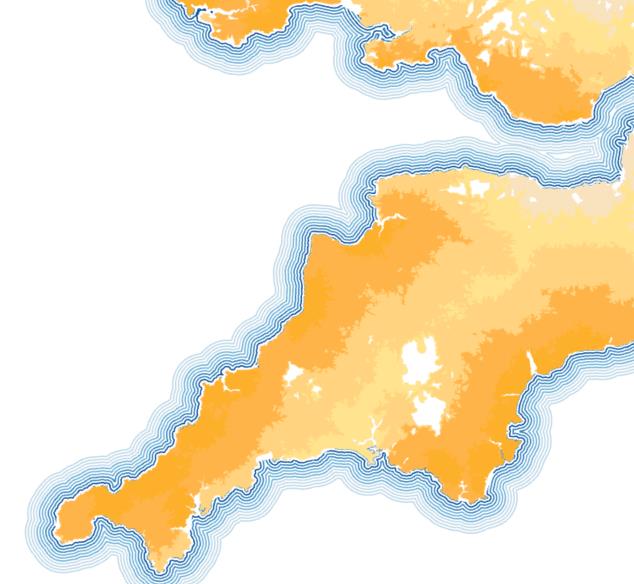
For some finishing touches, I added in a high line water boundary layer and used the ‘select by location’ tool to highlight all the drive time areas that crossed within that boundary. This helped formulate the ocean gradient ring buffer around the mainland. The buffer consisted of 1000m intervals with 10 rings, and I used deep blue shaded colours to represent the surrounding ocean.
Now let’s head to the beach…
The analysis from this project featured on the Telegraph in August 2021. You can find more information and statistics about this analysis in the feature here.
I hope this blog encourages you to try out some bold and unconventional ways to design your maps!