Gaining fresh insight into urban heat risks
Extreme heatwaves are on the increase, creating significant health risks for vulnerable groups, particularly in urban areas. Hounslow Council has used Esri’s ArcGIS Online solution to pinpoint the areas of greatest risk within the London Borough of Hounslow and it is now leveraging this fresh insight to keep residents cool and safe.
Dozens of datasets analysed in ArcGIS Online to reveal new insight into heat risks
Urban heat report with interactive map created using Report Builder for ArcGIS
Single source of authoritative urban heat data available to all council staff
The Challenge
Extreme heat of over 40°C is around 10 times more likely today than it was in pre-industrial Britain , posing a tremendous risk to vulnerable groups, such as the elderly, children aged under four and people with underlying health conditions. According to the Office of National Statistics, a heatwave in mid July 2022 contributed to 2,227 excess deaths in the UK .
Heatwaves in urban areas are a particular concern, as heat levels are increased by tall buildings and narrow streets, as well as emissions from air conditioners and vehicles. Hounslow Council wanted to better understand the risks arising from heat at different locations throughout the borough, so that it could put plans in place to support residents during periods of exceptional hot weather.
“ArcGIS helps us to reach people who are most at risk and most likely to need council services, in a cost-effective and timely way.”
Councillor Katherine Dunne, London Borough of Hounslow
The Solution
While Hounslow Council had undertaken heat studies previously, it decided to take a map-centric approach for the first time. It had recently begun to use Esri’s ArcGIS Online solution and realised that it could use this cloud-based geographic information system (GIS) to both deepen its understanding of urban heat risks and make insights more accessible.
In the first instance, the council inputted heat data at LSOA (Lower-layer Super Output Area) level into ArcGIS Online, enabling 150 small areas within the borough to be compared statistically. It then added contextual geospatial data from the Hounslow Data Observatory, a location-specific data hub, managed by Esri UK, that provides easy access to open data on the population, economy, health and social care, housing, crime and safety, deprivation and the environment through the Esri UK National Data Service.
Hounslow Council also sourced some data from third parties, such as air quality readings from the Greater London Authority, and added relevant, internal council data on everything from the addresses of care homes and known locations of rough sleepers to water refill stations. The council analysed all of this data geospatially in ArcGIS Online to produce a detailed heat risk index, which clearly identifies the specific areas within the borough where residents are most at risk from hot weather.
Next, Hounslow Council used Report Builder for ArcGIS, a web app builder for data in ArcGIS Online, to create a Heat Awareness Insights Report which includes an interactive map. Users can turn on and off layers in this web map, search by postcode or area and probe the data themselves to get visual answers to their questions. The report is published on the council’s website, so while primarily intended for internal use, it can be used more widely by businesses, charities and individuals in the borough to understand the potential impacts of heatwaves.
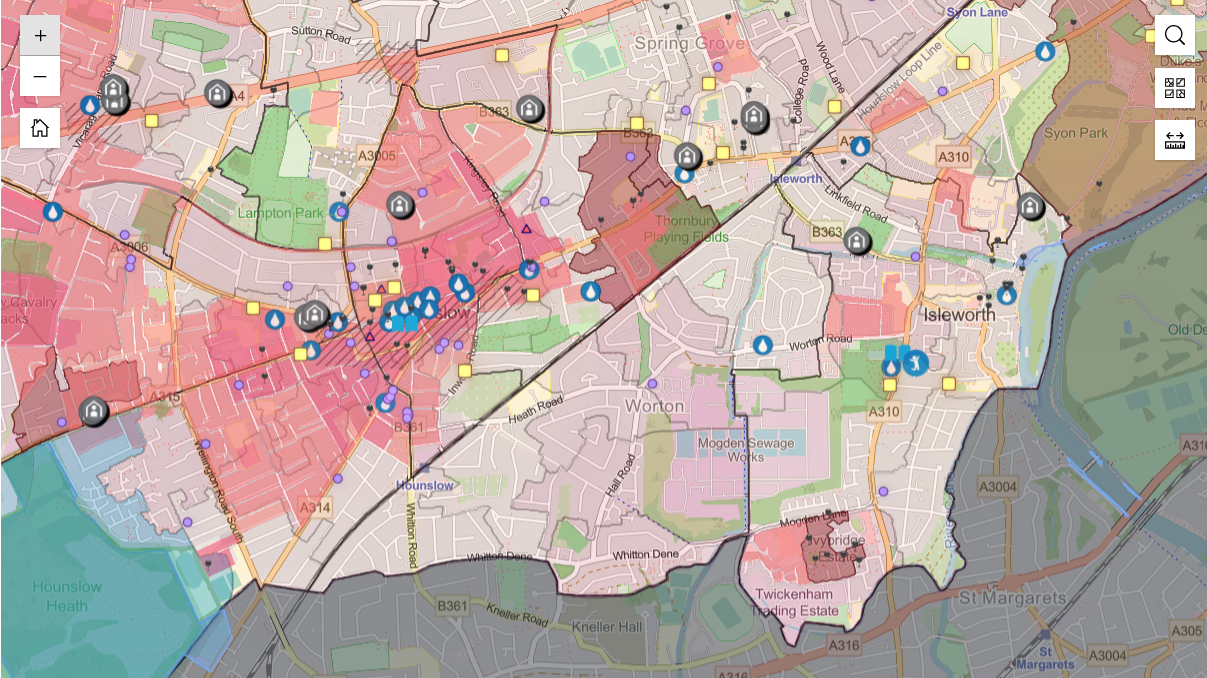
Users can zoom into the ArcGIS Online map to see more detail, including the locations of care homes and rough sleeping sites in a high-risk location.
Benefits
Deeper insight into urban heat risk
Hounslow Council has undoubtedly gained a far deeper understanding of urban heat risks in 150 small areas within the borough. ArcGIS Online has pinpointed specific high-risk groups, in high-risk locations, and delivered new insight into the compound effects of urban heat and deprivation. The ArcGIS-based research has, for instance, revealed that six of the ten areas with the highest vulnerability for heat are also among the most disadvantaged areas in the borough.
Focused delivery of new heat relief services
ArcGIS Online is now used by teams throughout the council to ensure heat relief services are focused on the right areas. In the borough’s Cool Spaces initiative, for instance, the council used the insights from the ArcGIS map to engage with leisure centres and libraries in high risk areas and encourage them to provide accessible, cooler spaces for residents during periods of extreme heat.
Cost efficient allocation of resources
Importantly, Hounslow Council can use the insights from ArcGIS Online to help it allocate its limited resources appropriately and effectively. Recently, it used the urban heat map to pinpoint where to promote its cool spaces and avoided wasting money on advertising in low risk locations. “ArcGIS helps us to reach people who are most at risk and most likely to need council services, in a cost-effective and timely way,” says Councillor Katherine Dunne, London Borough of Hounslow.
Effective planning for climate change resilience
Recognising that heatwaves are becoming more common due to climate change, Hounslow Council is using the urban heat map to help it take heat vulnerability into account as a part of its long term strategic planning. For example, ArcGIS has helped to inform where targeted actions should be delivered as part of the development of the Council’s Climate Change Resilience Plan.
Improved safety for vulnerable people in Hounslow
Hounslow Council can now identify specific care homes and nurseries, in high risk areas, and work with these businesses to ensure the right heat protection measures are introduced. It can also better coordinate homelessness services to give sun cream and hats to homeless people in the highest risk, hottest areas. Led by data-derived evidence, these proactive measures, and others like them, will help to ensure the safety of vulnerable people in future extreme heat events.


