Blog Archives

Police Scotland
We transformed a paper-based process into an efficient and robust digital workflow to enable us to keep visitors and the citizens of Glasgow safe during COP26.
When Glasgow hosted the United Nations’ COP26 Conference, the need for tight security was absolutely paramount. Police Scotland developed an innovative, GIS-based digital workflow that enabled it to carry out a highly robust search and seal process, with fewer resources and just four sheets of paper.
Specialist police teams used ArcGIS Field Maps to search and seal around 7,000 street assets prior to the event
Police Scotland and partner organisations used ArcGIS Field Maps during COP26 to report broken seals and issues of concern
Senior officers viewed ArcGIS Dashboards to monitor the security operation in real-time and allocate resources to high risk areas
The Challenge
In 2021, thousands of people from all over the globe converged on Glasgow for the COP26 Climate Change Conference, including 104 Heads of State, members of the British Royal Family and world-renowned environment and climate experts. Before and during this high-profiled event, Police Scotland needed to search and seal around 7,000 drains, vents, lamp posts, utility cabinets and similar assets with small openings where improvised explosive devices, firearms and other items for disrupting the event could be concealed. The organisation knew that an operation on this massive scale was going to be almost impossible with the resources available, if it used the standard paper-based search and seal process.
The Solution
Police Scotland addressed this pressing challenge by developing a digital, mobile workflow for search and seal operations using the combination of ArcGIS Field Maps and ArcGIS Dashboards. The bespoke solution was created quickly and cost-effectively by the force’s in-house GIS team, using out-of-the-box functionality, to operate on police officers’ existing devices.
Using the new workflow, specialist police officers were tasked to search and seal specific clusters of assets, all of which were uniquely numbered. They could see pictures and maps of the assets on their mobile devices helping them to find and correctly identify them in the field, and ensure none were missed. Next the solution was used to carry out inspections to identify any damaged seals. When potential issues were identified, field staff used online forms within the solution to flag assets that needed to be searched and sealed again and raise any concerns.
An ArcGIS Dashboard in ArcGIS Online provided senior officers with a complete, real-time view of the entire operation, enabling them to better manage the allocation of tasks to field teams. Broken seals or issues recorded in the field were instantly visible, enabling specialist teams to take action quickly. Furthermore, when coastguard personnel were brought in to help the police inspect seals during the event, Police Scotland could use ArcGIS Online to give them limited, secure access to the data they needed, on their own devices, while still complying with the strict security controls governing the event.
Benefits
Up to 75% faster search and seal operations
Using ArcGIS, Police Scotland could search and seal drains and other assets 50% to 75% faster than before. Consequently, the force could cover a large area of Glasgow and carry out an effective search and seal process on the enormous scale needed for COP26, with a relatively small team. The previous paper-based approach would not have been able to scale up adequately with the resources available.
A more rapid response to potential security issues
Critically, the ArcGIS solution enabled Police Scotland to respond more quickly to potential security issues during the event. For example, whenever an inspection team reported a broken seal, the fault was instantly flagged on the ArcGIS Dashboard, so the reseal team could go immediately to this location to secure it again. With the previous paper-based system, it could have been the next day before information from the field was received in the office and passed back out again to another team.
Improved management of a vital security operation
ArcGIS provided a single operating picture and live updates of what was happening in the field, on any device. As a result, senior officers could monitor the progress of search and seal operations in real-time, on their mobile devices, see where seal damage was occurring most frequently and then allocate teams to the areas of greatest risk. They could also be a lot more mobile and make decisions about search and seal on the fly, while doing other important policing tasks to ensure the safety of people throughout the city.
Efficient collaboration with partners
During COP26, the team of 20 specialist search and seal officers from Police Scotland was able to work efficiently with 20 coastguard personnel and around 80 additional police resources from English forces, using the same ArcGIS workflow. Without this ArcGIS-based approach, Police Scotland estimates that it would have needed three times as many police and partner resources to manage the search and seal process throughout the event.
A lower carbon impact
In keeping with the aims of COP26, the new ArcGIS workflow enabled Police Scotland to reduce the unnecessary use of paper. The force estimates that its previous approach would have generated around five file boxes of paper, but in the entire search and seal process for the event, just four sheets of paper were printed. Police Scotland is now building on its experience with the search and seal solution and plans to develop new digital workflows with ArcGIS, to continue the legacy of COP26.


Stantec
We have used ArcGIS to create a ground-breaking solution that helps firefighters extinguish fires more quickly.
The professional services company Stantec has used ArcGIS in the creation of a ground-breaking new solution that gives water utilities and fire services real-time insight into fire hydrant performance. Called the Fire Flow System, the app is currently being used across Greater London to help firefighters extinguish fires more quickly.
A digital twin of Greater London, created with ArcGIS to improve collaboration between Thames Water and the London Fire Brigade
Interactive, 3D, digital maps in ArcGIS Online providing real-time visibility of the performance of 140,000 fire hydrants across the capital
1.7 million residential, public and commercial buildings colour-coded in ArcGIS to highlight where there is inadequate water supply for firefighting
The Challenge
A vast amount of water can be required to put out major fires. Indeed, a blaze at a multi-story residence, school or commercial premises can require 35 to 75 litres of water per second to bring it under control. Water utilities are, however, often not aware if there is sufficient water capacity and pressure for firefighting at every property in their region. Equally, when fire crews are called out to emergencies, they generally don’t know in advance what water pressure to expect at the nearest hydrants or whether there will be sufficient water capacity to enable them to implement their preferred firefighting strategy.
“Our innovative use of ArcGIS gives firefighters immediate access to up-to-date information about water flows and hydrants, enabling them to make the right decisions and implement the most effective strategies to put out fires quickly."
Michael Morrisroe, Technical Director, Stantec
The Solution
Recognising these challenges, Stantec set out to develop a solution that would calculate the water capacity and pressure at each hydrant across a water supply network and also assess whether there was sufficient fire flow available to tackle fires at individual buildings. Its prototype application, called the Fire Flow System, attracted the interest of Thames Water and led to the delivery of a fully operational solution covering all of Greater London.
Built using ArcGIS Pro, ArcGIS Online and ArcGIS Experience Builder, the Fire Flow System for Thames Water:
- Estimates how much water would be required to fight a fire at 1.7 million individual properties in Greater London, based on the types of buildings, number of floors and whether they are residential
- Calculates whether sufficient water flow is available in the water supply network to fight fires, at each individual property
- Displays which hydrants are available and most suitable to use for firefighting at each building
- Presents a 3D digital twin of all buildings in the capital, on ArcGIS Online, categorised and colour-coded by the ability to meet firefighting requirements
- Highlights in red all buildings where there is insufficient water supply to extinguish a serious fire, should one occur at this location.
The solution for Thames Water was developed in collaboration with the London Fire Brigade and takes into account standard procedures for how fire crews fight fires. For instance, the system knows the typical length of hoses used by the London Fire Brigade and rules about how and where hoses can be laid near waterways, roads and rail infrastructure. Now both organisations use the Fire Flow System daily, in offices and in the field. “The ArcGIS Online environment is key to collaboration,” says Sunil Terkar, Principal GIS Technician. “Thames Water can update the Fire Flow System and share new information instantly with the London Fire Brigade.”
“The ArcGIS Online environment is key to collaboration. Thames Water can update the Fire Flow System and share new information instantly with the London Fire Brigade.”
Sunil Terkar, Principal GIS Technician, Stantec
Benefits
Effective responses to fires in London
When 999 calls are received by the London Fire Brigade, staff at dispatch centres and firefighters travelling in fire engines can view the Fire Flow System online to see exactly which hydrants are closest to the fire, within reach of hoses and able to deliver the required water pressure and water volume. If firefighters know there is a potential problem with water flow in advance, they can order tankers to site earlier and plan different attack methods. “Our innovative use of ArcGIS gives firefighters immediate access to up-to-date information about water flows and hydrants, enabling them to make the right decisions and implement the most effective strategies to put out fires quickly,” says Michael Morrisroe, Technical Director at Stantec.
Focused measures to create a safer city
For the first time, Thames Water and the London Fire Brigade now have accurate, shared, up-to-date information about water flow in Greater London. ArcGIS clearly identifies, on 2D and 3D maps, specific buildings that would be hard to reach with the required water flow in the event of a fire. Consequently, Thames Water and the London Fire Brigade can now plan ahead and put focused measures in place to mitigate the risk of inadequate water flow, to help make London a safer place to live and work.
Informed decision making in planning process
The clarity of the information displayed via ArcGIS Online enables the London Fire Brigade to take water flow into account, for the first time, when approving or rejecting planning permissions. It is easy for personnel to use the interactive mapping interface to zoom into a specific building and see if it has sufficient water flow to permit a change of use or new development. “The solution was recently consulted when the Excel Centre was transformed into a Nightingale Hospital,” Morrisroe explains.
Less water wastage during hydrant testing
Through this innovative use of ArcGIS, Stantec has delivered a solution that enables Thames Water to quantify likely fire flows for the first time and therefore better understand hydrant performance across the city. As ArcGIS highlights clearly which hydrants have the required pressure and capacity and which do not, Thames Water can better plan its routine testing of fire hydrants and only carry out full flow tests where absolutely necessary. This not only saves time for Thames Water, but could also potentially save millions of litres of water a year, while maintaining the operational readiness of the hydrant network.
EDF
During the important project to construct a new nuclear power station for Britain, we are using ArcGIS Enterprise to help us work efficiently and safely.
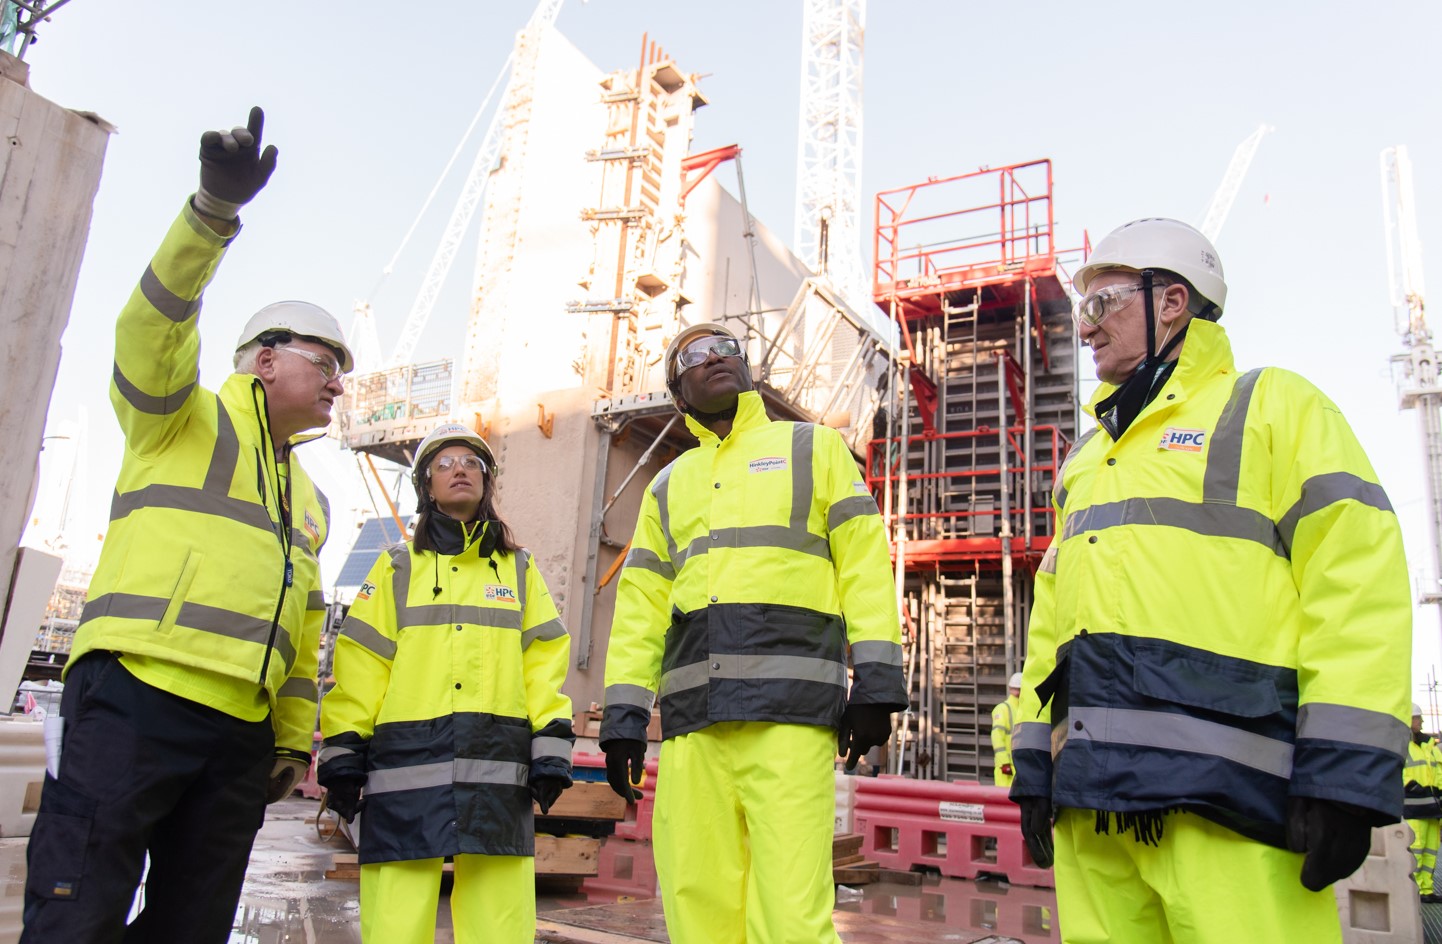
Electricity provider EDF is using ArcGIS Enterprise to help it build the UK’s first new nuclear power plant in more than twenty years. A suite of ArcGIS web apps, mobile solutions and dashboards for discrete teams are now being used to drive on-site safety, quality, productivity and collaboration, helping Britain’s biggest action on climate change stay on track.
The emergency team uses ArcGIS mobile solutions to carry out site inspections and implement improved safety measures
The electrical team uses ArcGIS web apps and dashboards to minimise the use of generators, avoid unnecessary costs and reduce emissions
ArcGIS Dashboards display hotspots by neighbourhood enabling the council to implement targeted interventions to reduce community transmission
The Challenge
Already Britain’s biggest generator of zero carbon electricity, EDF is driving the development of new nuclear energy sites that will increase the availability of sustainable energy in the UK. At Hinkley Point C in Somerset, it is building two new nuclear reactors to generate zero carbon electricity for around six million homes. This enormous and highly complex construction project involves more than 6,500 people on site, thousands of people off site and a supply chain of partners extending all around the world. EDF needed an effective way to share project and site information with these employees, contractors and partners in order to inform decision making, ensure site safety, support collaboration and improve efficiency.
“The number of people using ArcGIS is growing every day, as more and more people become aware of what ArcGIS has to offer.”
Jon Dolphin, GIS Lead, Nuclear New Build, EDF
The Solution
After creating an initial proof of concept using Esri’s ArcGIS Online solution, EDF adopted Esri’s ArcGIS Enterprise to support the Hinkley Point C project. Hosted in EDF’s Azure cloud environment, this core system provides a portal to the project’s spatial data and is currently used by over 750 employees and third-party contractors. Jon Dolphin, Geographic Information System (GIS) Lead (Nuclear New Build) at EDF says, “The ArcGIS Online proof of concept rapidly captured imaginations of what was possible using GIS in a megaproject. Now, the number of people using ArcGIS is growing every day, as more and more people become aware of what ArcGIS has to offer.”
Using ArcGIS Enterprise, EDF has created suites of maps, web apps, mobile solutions and dashboards for specific teams or groups of users, including the emergency team, environmental team, temporary works team, electrical team and radiological safety team. Forming integrated, ArcGIS-driven workflows, these solutions allow employees and contractors to access data on demand and perform their jobs as efficiently as possible. Many of the solutions have been built using ArcGIS Field Maps, Survey123 for ArcGIS and ArcGIS Dashboards, replacing complex data collection methods, excel spreadsheets and manually-generated reports.
“If a picture paints a thousand words, a map paints a thousand pictures.”
Jon Dolphin, GIS Lead, Nuclear New Build, EDF
Benefits
Assurance of safety measures
A suite of ArcGIS solutions developed for EDF’s emergency team at Hinkley Point C is helping to ensure the safety of the thousands of employees and contractors who may be working across the 174 hectare site at any one time. Inspectors use ArcGIS field apps to check that rendezvous points are accessible and in good condition, so that medical aid and assistance can be delivered promptly in an emergency. If any obstructions or other issues are identified, details can be collected immediately in the field and routed to the people who need to take action, enabling the assurance of safety measures far more quickly.
Improved cost efficiency and compliance
Across many aspects of the construction project, ArcGIS is helping EDF to operate cost efficiently and comply with applicable legislation. For example, EDF has created an ArcGIS workflow for awarding and managing permits for the use of temporary power generators. Replacing a spreadsheet-based process, the ArcGIS solution uses apps, maps and dashboards to enable managers to understand precisely where generators are needed and for how long. With this improved oversight, they can ensure generators are only used when absolutely necessary, reducing costs, lowering emissions and ensuring compliance with emissions legislation.
Effective coordination of simultaneous works
ArcGIS Enterprise is becoming a core business system, helping EDF to coordinate hundreds of simultaneous programmes of work and keep this mega-project on schedule. One key ArcGIS solution enables EDF to manage temporary works, such as scaffolding, excavations or earth works, ensuring that the activities of one contractor do not impede the activities of another working in close proximity on a different aspect of the build. Managers use a suite of integrated ArcGIS maps, dashboards and field apps to plan the temporary works and then inspect them to ensure they are proceeding in the agreed way, in the right place.
Clear visibility of the bigger picture
With so many different teams and contractors all working together to deliver the new nuclear reactors, ArcGIS Enterprise plays a critical role in ensuring that everyone has access to the same single source of accurate information and can collaborate effectively. Any approved user can access ArcGIS Enterprise to see the latest as-built site drawings and plan their jobs safely with an accurate knowledge of the wider construction project. “ArcGIS helps different people, teams and contractors to understand the big picture and how they fit into it,” Dolphin says. “If a picture paints a thousand words, a map paints a thousand pictures.”
Shared understanding of environmental constraints
EDF is increasingly using ArcGIS Enterprise to help it manage environmental aspects of the construction project and plans to incorporate more environmental monitoring data in the near future. It also intends to make greater use of ArcGIS to visualise complex environmental implications such as light pollution and the continued implementation of associated planning conditions. Already, the organisation uses ArcGIS Enterprise to make all employees and contractors aware of environmental constraints, such as bat corridors, to help everyone work together to safeguard the area’s wildlife.

Balfour Beatty VINCI
With ArcGIS in a Managed Cloud Services environment we are managing the construction of one of Europe’s most challenging rail infrastructure projects.
Through an ArcGIS Managed Cloud Services agreement with Esri UK, the long-established joint venture Balfour Beatty VINCI launched 48 custom apps, dashboards, story maps and geospatial information tools for 2,500 users within just twelve months. These ArcGIS solutions are helping the organisation manage costs, protect workers and improve scheduling to keep the delivery of HS2 firmly on track.
ArcGIS web apps provide discrete groups of users with easy access to the geospatial data they need to work efficiently
ArcGIS Dashboards gives senior managers instant visibility of project data so they can better coordinate the activities of multiple teams and subcontractors
ArcGIS StoryMaps explains the significance of key project activities, to keep thousands of employees, subcontractors and partners informed
The Challenge
Balfour Beatty VINCI (BBV) is responsible for delivering the longest section in the first phase of HS2, the UK’s new high speed rail link to the north of England and one of the most challenging railway projects currently underway in Europe. The organisation needs to design and build 80 km of state-of-the-art rail infrastructure, comprising 66 overbridges, 42 viaducts, 35 cuttings, 33 km of embankments and four motorway crossings.
To help it coordinate and deliver this huge feat of engineering, BBV wanted to be able to store all of the geospatial data relating to all aspects of the project in one place, and create tailored apps and dashboards to make it available to everyone, including subcontractors and partners. The project would involve teams across dozens of disciplines from designers and engineers to ecologists, but while they would all be fulfilling different roles, they would all need to use much of the same geospatial information to make informed decisions.
“Our GIS platform is being monitored and maintained by experts who really understand geospatial data, can react quickly to any issues and have the knowledge to answer any questions that we might have."
Faisal Khan, GIS Manager, Balfour Beatty VINCI
The Solution
BBV evaluated multiple different geographic information system (GIS) solutions, selecting Esri’s ArcGIS suite because it provides the versatility that the business needs to create a variety of solutions for different groups of users. From the outset, BBV opted to use ArcGIS in a Managed Cloud Services environment, to remove the need for on-premise IT infrastructure. In doing so, it gained peace of mind from knowing that the GIS platform is being constantly monitored and supported by Esri UK’s GIS experts.
“The biggest benefit of an Esri UK Managed Services contract is the support,” says Faisal Khan, GIS Manager at BBV. “Our GIS platform is being monitored and maintained by experts who really understand geospatial data, can react quickly to any issues and have the knowledge to answer any questions that we might have.”
Within twelve months, BBV created 15 interactive ArcGIS apps, 14 ArcGIS Dashboards, 8 ArcGIS StoryMaps and 11 other geospatial tools. In total, within the first year, BBV amassed over 2,500 ArcGIS users. The majority of the ArcGIS apps and dashboards have been developed for specific teams, giving them the precise functionality that they need to undertake their roles as efficiently as possible. The ArcGIS StoryMaps often accompany dashboards and are used to give employees, subcontractors and partners a shared understanding of importance aspects of the project, such as achieving a net zero impact on biodiversity. BBV also uses ArcGIS Pro to create maps for the community engagement team, helping it to advise local people about road closures and works in the region.
Benefits
Timely design changes to reduce excess costs
Through the use of ArcGIS, BBV can make up-to-date information from ground investigations and site surveys available to designers more promptly. This enables potential issues, such as unexpected ground contamination, to be captured and incorporated into designs earlier, rather than having last minute changes that could be more costly. “You can never completely eliminate the need for design changes on a project as large and complex as HS2, but if you remove issues before construction work starts on site, it helps to keep the project within the tight construction budgets,” Khan says.
Improved health and safety on construction sites
ArcGIS helps to improve health and safety by enabling employees and subcontractors to view the geographic context of sites, alongside computer-aided design (CAD) plans and other project data on potential hazards, all in one place, before they go there. In addition, senior managers use an ArcGIS dashboard to view scheduled works at each location along the railway route within the next four weeks. The dashboard automatically creates an alert if two contractors or two activities are scheduled simultaneously in the same location, so managers can consider safety implications and reschedule activities to protect workers if necessary.
Informed decision making to keep the project on schedule
The tailored ArcGIS apps and dashboards give different groups of users the information that they need to make well-informed planning decisions and help keep the complex, multi-phased project on schedule. For example, employees can use ArcGIS to click on land parcels, see what land is in BBV possession and where land access is needed, so that the necessary acquisitions and access permissions can be secured well ahead of time, to prevent unnecessary delays. Equally, employees can refer to a dashboard to see historic weather patterns, and use this insight to plan the best times for works to take place.
Effective coordination of hundreds of teams
The suite of ArcGIS solutions helps BBV to coordinate the work of multiple subcontractors and prevent unnecessary duplication of activity. For example an ArcGIS web app developed for the ground investigations team shows where boreholes have already been drilled and where new ones are proposed, so different subcontractors do not drill in the same areas. “We can have hundreds of teams working along BBV’s section of HS2 simultaneously,” Khan says. “ArcGIS gives everyone shared access to the same information and prevents unnecessary duplication of tasks, which improves the overall efficiency of the project.”

Coastal Atlas Ireland
ArcGIS Hub is enabling us to transform recreational anglers into citizen scientists and encourage more people to play an active role in helping to conserve Ireland’s fish stocks.
An award-winning atlas, the Coastal Atlas of Ireland, features over 500 map images, created using ArcGIS software. Colourful, detailed and intriguing, the maps engage readers’ interest in a wide range of topics and improve understanding of issues that will shape Ireland’s coastline and coastal communities for decades to come.
ArcGIS was used on the desktop to collate, analyse and manipulate data in different formats, from many sources
Sophisticated cartographic tools in ArcGIS allowed the creation of attractive, colourful and accurate maps
An ArcGIS StoryMap adds value by enabling people to interact with the maps themselves online and delve into more detail
The Challenge
Creating an atlas of the coastline of the whole island of Ireland was a long-standing ambition of Robert Devoy. He assembled a team of co-editors, including Val Cummins, Barry Brunt, Darius Bartlett and Sarah Kandrot, and invited people from Ireland and beyond to contribute information to the atlas based on their areas of expertise. The contributors included academics across the fields of geography, ecology, climate change, geology, geomorphology, marine environments, industry, economics, culture and heritage.
“We wanted to bring together a huge variety of coastal data from across the whole of academia and present it in a way that would be accessible and meaningful for the general public,” says Sarah Kandrot, co-editor and cartographer. “Because the atlas has explicitly all-island coverage, this often meant we had to bring together datasets that originated in each of the two jurisdictions, with all the challenges of data (non-) interoperability that implies.”
ArcGIS has enabled me to bring information to life and create maps to help people understand a variety of coastal issues.
Sarah Kandrot – co-editor of the Coastal Atlas of Ireland
The Solution
Kandrot selected Esri’s ArcGIS solution and utilised this software on the desktop to create over 500 clear, attractive and informative maps to illustrate the atlas. The use of a professional geographic information system (GIS) enabled Kandrot to easily combine vast datasets, often in different formats, from a wide variety of sources, ranging from individual researchers to government agencies in the Republic of Ireland and Northern Ireland, as well as the EU. She could use specialist geospatial tools within ArcGIS to analyse and filter the data, view patterns and highlight key coastal issues.
Addressing an incredibly diverse range of topics, the maps illustrate everything from how critical habitats for seabirds are diminishing to how coastal communities were impacted by the great Irish famine of 1845-1852. Some maps plot the locations of coastal leisure facilities, such as golf courses and blue flag beaches, while others show the extent of search and rescue operations, the urbanisation of coastal cities over successive decades and the sites of prehistoric tombs and standing stones.
Following the publication of the Coastal Atlas of Ireland, Kandrot used Esri’s ArcGIS Online to create a StoryMap, enabling people explore some of the maps and themes featured in the publication in more detail online. Comprising interactive maps, stunning imagery from professional and amateur photographers, and narratives written by subject experts, the StoryMap can be accessed free of charge by anyone. “The ArcGIS StoryMap provides extra information and an added dimension that the printed publication cannot give,” Kandrot says. “It is a great complement to the atlas.”
The maps in the printed publication and the StoryMap put the facts about climate change into context and promote discussion about what we must do to manage it.
Sarah Kandrot- co-editor of the Coastal Atlas of Ireland
The Benefits
Top quality illustrations for a top quality publication
The maps created with ArcGIS are an essential part of the Coastal Atlas of Ireland. Produced in full colour, the maps add clarity and interest to the atlas and have contributed significantly to its success. In the 2021 An Post Irish Book Awards, the atlas was named the Journal.ie Best Irish Published Book of the Year.
Complex, professional maps created easily
The use of ArcGIS enabled Kandrot to easily consolidate data from the Republic of Ireland and Northern Ireland and work with data in different formats to create consistent all-island maps. She could also manipulate the data and filter out the data that she didn’t need, in order to focus on coastal areas specifically. For example, she was able to use ArcGIS to show the locations of tower houses (15th-17th century fortified residences) that are within 5km of the coast.
Improved awareness of all-Ireland coastal issues
The diversity of the maps in the atlas helps to arouse the general public’s interest in different aspects of Ireland’s coast and draw attention to a wide range of topics, affecting coastal areas around the whole island of Ireland. One unusual and fascinating map shows the thousands of miles travelled by five seals around the coast of Ireland and beyond. “ArcGIS has enabled me to bring information to life and create maps to help people understand a variety of coastal issues,” Kandot says.
Bonus information to explore beyond the pages
The ArcGIS StoryMap enables people to delve into more detail about some of the topics covered in the atlas, providing significant added value from the project. For example, people can zoom into maps of Machair habitats, one of the rarest kinds of coastal habitat in Europe, to see satellite imagery of what they look like, as well as where they are. People can also use the StoryMap to compare different sets of data on one screen, something that is more difficult to do by flicking over pages in the printed publication.
Clear understanding of the challenges for the future
The Coastal Atlas of Ireland, together with the StoryMap, shine a light on climate change, the impact it is already having on Ireland’s coast and how we must adapt to it. “The maps in the printed publication and the StoryMap put the facts about climate change into context and promote discussion about what we must do to manage it,” Kandrot says. “The huge amount of interest that we have seen in the Coastal Atlas of Ireland gives me hope for the future that people will take coastal climate change seriously.”

Fusion
ArcGIS is the core asset management system that is enabling us to coordinate the activities of 60+ contractors and subcontractors and deliver a major infrastructure project efficiently
In a highly complex and large-scale, multi-disciplinary ground works project, the joint venture organisation Fusion needs to collaborate effectively with over 60 contractors, subcontractors and third parties. It uses ArcGIS through a Managed Cloud Services agreement to help it connect people with up-to-date data, improve the efficiency of key business processes and manage costs and resources effectively.
The Esri UK Managed Cloud Service frees up time in Fusion's GIS team for the development of new GIS apps and services
750 people from 60+ organisations use the ArcGIS web portal to access & share ecology, archaeology, land and development data
Bespoke apps developed using ArcGIS Survey123, ArcGIS Collector and ArcGIS Dashboards improve project efficiency
The Challenge
Fusion was appointed in 2016 to carry out essential preparatory works along a 100 km section of the route for the new High Speed 2 (HS2) railway line. The contract includes everything from clearing sites and diverting utilities to creating new habitats for newts and investigating archaeology.
The joint venture’s vision is to connect people, but it soon became clear that this was going to be a particular challenge on the HS2 project. Over sixty different contractors and subcontractors with different specialisms were involved in undertaking engineering, ecology and archaeology surveys and implementing ground preparation and remediation works. Fusion needed to be able to share up-to-date information with people from all of these separate companies, as well as HS2, Natural England and the civil engineering organisation leading the next stage in the railway’s construction.
“In a project like HS2 that involves a vast number of contractors and other third parties, ArcGIS keeps everyone in the loop. Multi-disciplinary teams from many different companies can all share the same data and collaborate effectively to complete work to a high standard."
Tom Wicks, BIM manager, Fusion
The Solution
Fusion selected Esri’s ArcGIS solution, opting to subscribe to a Managed Cloud Service provided by Esri UK. ArcGIS quickly became Fusion’s main asset management system for the HS2 project, enabling Fusion to better manage and share all of the building information management (BIM) data that it needs to coordinate the project, as well as deliver contractually to HS2.
Now, Fusion’s core ArcGIS web portal is used by over 750 users from Fusion, its contractors, HS2 and other third parties. With new data added daily, ArcGIS allows Fusion to manage, visualise and share over 500 information layers on everything from ecology and archaeology to flood zones and land ownership. Everyone can see the same up-to-date data, zoom into a specific area on the digital map and turn on the layers, to better understand where preparatory works are needed, why they are needed and when these works have been completed.
In addition to the main ArcGIS web portal, Fusion has developed a number of smaller ArcGIS web apps to meet the needs of specific teams or support discrete business processes. One of these apps allows Fusion to manage land access and pass on land ownership to the principal contractor responsible for managing the next phase in the construction of HS2. Another app, the Ecology Viewer, allows people to view, in one place, all the data collected in ecology surveys by multiple organisations. It enables everyone to more easily see, for example, the species of bat that roost in the vicinity of the HS2 route, the badger sets that need to be relocated and the nest boxes that have been installed for barn owls.
Graham Starling, Information Manager at Fusion, says: “Esri UK has provided an excellent level of service throughout the project lifecycle, from being adaptable to changing requirements during project implementation and providing efficient and effective remedial actions when issues arose during delivery, through to providing consultation and recommendation during demobilization and archiving. I would highly recommend this ArcGIS managed service for other similar projects.”
“Esri UK has provided an excellent level of service throughout the project lifecycle….”
Graham Starling, Information Manager, Fusion
Benefits
Effective collaboration between people in 60+ organisations
ArcGIS significantly improves collaboration on this large-scale project by making it easy for people across many different organisations to share and view up-to-date information. With a better understanding of the area, everyone involved can take appropriate measures to protect heritage sites, avoid disturbing animals during key breeding times, and abide by the law by not inadvertently crossing land that is private. “In a project like HS2 that involves a vast number of contractors and other third parties, ArcGIS keeps everyone in the loop,” says Tom Wicks, BIM manager at Fusion. “Multi-disciplinary teams from many different companies can all share the same data and collaborate effectively to complete work to a high standard.”
Improved cost and resource management
By using ArcGIS to undertake geospatial analysis, Fusion is better able to estimate resource requirements for specific works and manage costs across the entire contract. For example, the organisation uses ArcGIS to analyse the density of bats and trees in particular locations and make comparisons between different sections of the route. It can then share this data with HS2 and use it internally to help it accurately gauge the cost of tree works or ecology interventions in different locations, and allocate the required resources based on up-to-date data from the field.
Greater efficiency in key business processes
The small GIS team at Fusion has been able to develop a series of ArcGIS apps that improve the efficiency of key business processes. For example, it has created a form-based app using ArcGIS Survey123 that enables people to capture details about any works needed and insert ArcGIS polygon drawings from the web portal. This detailed ground plan can then be shared with HS2 and other partners, within ArcGIS, accelerating decision making and works scheduling. “Having an Esri UK Managed Cloud Service frees time in the GIS team so that we can do geospatial analysis and build high value GIS apps that improve efficiency across the whole project,” says Wicks.
Faster resolution of snagging issues
As in all large projects of this type, small issues will inevitably arise that need attention, such as broken fence panels. In the past, these snagging issues were recorded in different ways, by different companies, in different spreadsheets without accurate location data. Now, information is recorded in a consistent way, by all parties, using ArcGIS Collector, and the data can be viewed by Fusion in near real-time on an ArcGIS Dashboard. “Having this data in real time, means snags can be sorted as soon as possible,” Wicks explains.

Inland Fisheries Ireland
ArcGIS Hub is enabling us to transform recreational anglers into citizen scientists and encourage more people to play an active role in helping to conserve Ireland’s fish stocks.
How can anyone possibly know how many fish are being caught or released by up to 250,000 recreational sea anglers around 3,000 km of coastline? Charged with answering this question, Inland Fisheries Ireland has created a solution based on ArcGIS Hub that is hooking the attention of the angling community and turning anglers into citizen scientists.
ArcGIS Survey123 allows recreational sea anglers to gather and upload data about the fish they catch and release, using any device
ArcGIS Hub Premium presents anglers with their own personalised dashboards, on which they can visualise their fishing successes over time
ArcGIS Online consolidates the data that Inland Fisheries Ireland needs for EU reporting and displays it on a secure management dashboard
The Challenge
To help safeguard fish stocks in European waters and protect marine eco-systems, the European Union (EU) needs to have accurate information about the volume (number and weight) of key fish species caught annually in European waters. Consequently, all EU member states are now required to report, not only on commercial fishing, but also on recreational sea angling.
As the organisation responsible for recreational angling in Ireland, Inland Fisheries Ireland needed to find a way to gather and share accurate data from a representative proportion of the 250,000 anglers who fish in many locations, along more than 3,000 kilometres of coastline. To complement sea angling data gathered by the Inland Fisheries Ireland survey team, a further approach was needed that would allow and encourage anglers to self-report their catches.
ArcGIS will enable us to recruit lots of anglers as citizen scientists and crowdsource the large volume of data that we require for EU reporting.
William Roche – Senior Research Officer, Inland Fisheries Ireland
The Solution
Inland Fisheries Ireland had been using geographic information system (GIS) solutions from Esri for many years and already had a mobile ArcGIS app that was used by deep-sea charter angling boat skippers for reporting for a Bluefin tuna catch, tag and release programme. With this experience, the organisation came up with a concept for an inclusive GIS-based survey that would engage anglers as citizen scientists. It then appointed consultants from Esri Ireland’s Professional Services group to act as advisors and help it deliver this novel method of marine data collection.
A key component of Irish Marine Recreational Angling Survey (IMREC), the GIS-based solution includes an ArcGIS Survey123 app, which anglers use on their mobile phones, tablets or computers, to capture data on how many fish they caught, what size and species they were, how many fish they released and how long they fished for. All the data captured is then transferred automatically, with no manual intervention, to Esri’s ArcGIS Hub Premium, a community data sharing platform that allows multiple stakeholders to contribute and view selected data online. A management dashboard in the Hub allows Inland Fisheries Ireland to monitor data collection activities, see estimated catch rates and identify patterns in the species, volumes and weight of fish caught.
In addition, all of the anglers that join the scheme have a personalised dashboard within ArcGIS Hub Premium on which they can see the data that they have contributed, whether they are shore anglers, small boat anglers or anglers who charter larger deep-sea vessels. Anglers can use their personalised dashboard to create online diaries of their own fishing activities and look back over time to understand where and when they had the most success. Personalised dashboards are not shared with other anglers or people outside of Inland Fisheries Ireland, so anglers can protect the secrecy of their favourite and most successful fishing spots.
With more people collecting data, we will be able to build up a better picture of the state of fish stocks off Ireland’s coast, particularly for anglers.
William Roche - Senior Research Officer, Inland Fisheries Ireland
The Benefits
More people proactively engaged in data collection
Inland Fisheries Ireland expects to be able to encourage large numbers of anglers to take part in the IMREC diary-based survey, partly because the Survey123 app is very easy for anglers to use, on any device. In addition, ArcGIS Hub Premium can be scaled up easily to accept data up-loads from more and more participants, allowing Inland Fisheries Ireland to gradually expand the scheme over time. “ArcGIS will enable us to recruit lots of anglers as citizen scientists and crowdsource the large volume of data that we require for EU reporting,” says William Roche, Senior Research Officer at Inland Fisheries Ireland. “With more people collecting data, we will be able to build up a better picture of the state of fish stocks off Ireland’s coast, particularly for anglers.”
Effective retention of anglers in the crowd-sourcing scheme
Through the development of personalised dashboards in ArcGIS Hub Premium, Inland Fisheries Ireland has created an effective way to retain the interest and involvement of anglers in the IMREC survey. Anglers are often keen diarists, and Inland Fisheries Ireland anticipates that they will enjoy using their dashboards to record and visualise their fishing success month after month. “The ArcGIS personalised dashboards will help to make the recording of data a habitual activity for anglers,” Roche explains. “We hope anglers will enjoy entering their catch data and take pride in their role as observers and stewards of Ireland’s fish stocks.”
Accurate, consistent data collected from all around Ireland
As all anglers, all around the country, are using the same Survey123 app to record their data, Inland Fisheries Ireland can have greater confidence in the accuracy and consistency of the data collected. The app accurately records location data, and survey questions can be easily amended if needed. The EU is particularly interested in data on cod, pollock, sharks, rays, sea bass and highly migratory species such as tuna, but Survey123 can be configured to capture data on other species too, giving Inland Fisheries Ireland flexibility for the future.
Supplementary data to support EU reporting requirements
Most significantly, ArcGIS has provided Inland Fisheries Ireland with a feasible and affordable way to capture additional data to complement the other data collected for the EU. Citizen science like this provides broad spatial coverage all around the coastline of Ireland. Linked with data from face-to-face interviews with anglers, the GIS solution minimises data handling and automatically displays reporting information on the management dashboard, which will enable Inland Fisheries Ireland to comply with EU data collection requirements in a very efficient way.

Glasgow City Council
ArcGIS is playing a pivotal role in Glasgow City Council’s response to COVID-19, enabling the council to share understanding of the spread of virus, the needs of vulnerable people and the success of the vaccination roll-out.
As soon as the first COVID-19 cases emerged in Scotland, Glasgow City Council turned to GIS to help it gain answers to questions that had never been asked before. Using Esri’s ArcGIS Dashboards and analysis, the council was able to gain a deeper insight into the challenges of the pandemic and share this understanding to improve the delivery of services for citizens.
Geospatial analysis undertaken with ArcGIS shows where vulnerable people live so the council can direct the necessary support to the right locations
Accurate data on COVID-19 cases and vaccinations feed into ArcGIS Online daily, giving the council a clear understanding of the fast-moving situation in the city.
ArcGIS Dashboards display hotspots by neighbourhood enabling the council to implement targeted interventions to reduce community transmission
The Challenge
The first case of COVID-19 was detected in Scotland on 1st March 2020. Within just short three weeks, this deadly coronavirus had begun to spread through community transmission within Scotland; the first patient with COVID-19 had died in a Scottish hospital; and the First Minister had announced unprecedented lockdown measures. Glasgow City Council, like other local authorities throughout the UK, needed to react quickly to this rapidly escalating public health crisis and provide effective support for Glasgow’s 600,000 citizens.
It soon became clear that the council could maximise the use of its data assets to inform the introduction of new services that were being set up in response to the pandemic. “The council had invested heavily in data analytics and data science over the preceding ten years and so was in a good place to respond quickly to the challenge,” says Stephen Sprott, Open Data and Innovation Project Manager at Glasgow City Council. “The data team was asked what solutions it could provide that would help the council to meet the needs of local people, especially vulnerable groups and vulnerable individuals in the community.”
“ArcGIS gives us the ability to visualise a wealth of detailed information and use this insight to make the best decisions to support communities and vulnerable people in Glasgow.”
Piero Matassoni, GIS Officer, Glasgow City Council
The Solution
Experienced in the use of Esri’s ArcGIS solutions, the council’s data team began by using ArcGIS on the desktop to perform advanced geospatial analysis and geocoding. While the official number of people who needed to shield in the city was 24,000, this ArcGIS analysis revealed that there are nearly 100,000 potentially vulnerable citizens, who are registered as disabled, in receipt of benefits or receiving support from social workers, for example. The council used ArcGIS to produce density maps to identify where large numbers of these vulnerable people live and where support services should be focused.
The council then used ArcGIS Online to create a series of highly visual, interactive dashboards to display COVID-19 information internally in a format that is easy for anyone to understand. Critically, the dashboards combine the council’s own data with the latest data from NHS National Services Scotland and Public Health Scotland about current levels of COVID-19 cases and vaccinations across the city, broken down into local areas. This vital epidemiological and health information is streamed into ArcGIS Online every night, with no manual intervention, providing the council’s planning and strategic teams with rapid access to accurate, up-to-date intelligence.
Glasgow City Council realised that other local authorities and public sector bodies also needed access to up-to-date information about the pandemic and stepped forwards to share its expertise. Its ArcGIS Online solution subsequently evolved into a template for use across the whole of Scotland and was shared with other members of local and national resilience groups including councils, police and NHS services.
“COVID-19 is not going away anytime soon so we need to continue to use ArcGIS and data analysis to deliver practical solutions to managing this ongoing public health crisis.”
Stephen Sprott, Open Data and Innovation Project Manager, Glasgow City Council
Benefits
Real-time insight to inform the delivery of services for citizens
The use of ArcGIS enables Glasgow City Council to visualise, in near real-time, at neighbourhood level, how COVID-19 is impacting citizens. With this improved understanding of fast-changing situations, the council can ensure that the right support services are delivered in the right locations. “ArcGIS gives us the ability to visualise a wealth of detailed information and use this insight to make the best decisions to support communities and vulnerable people in Glasgow,” says Piero Matassoni, GIS Officer at Glasgow City Council.
Targeted testing to reduce COVID-19 transmission
Using the ArcGIS Dashboards, senior managers within the council can monitor areas of the city with rising levels of COVID-19 cases, identify outbreaks of concern and then target these specific areas with interventions to help reduce community transmission. For example, when a spike in cases occurred in one particular area of the city, the council used ArcGIS Dashboards to decide where to locate intensive community testing sites (before home testing was widely available) to help it identify asymptomatic cases and stem the increase in the spread of the disease.
Effective, comprehensive roll-out of COVID-19 vaccines
The intelligence provided by ArcGIS analysis is also helping to ensure the success of the vaccination programme in Glasgow. For example, the council can use ArcGIS to track take-up of the vaccine by area, age groups and ethnicity. “ArcGIS gives us a real-time view of where the gaps are and where the vaccine programme might be lagging behind,” Sprott says. “The council can then use this information to influence where to set up additional drop-in, mobile and pop-up vaccination facilities and where to increase publicity to encourage more people to get vaccinated.”
Improved management of ongoing COVID-19 risks
The council now uses ArcGIS to analyse anonymised ‘track and trace’ data on the leisure facilities, schools, hospitality businesses, places of worship and retail sites visited by people who have contracted COVID-19. The council’s environmental and public health teams can then focus their efforts on visiting these high risk premises to check that COVID-19 secure measures are being followed. Summing up, Sprott says, “COVID-19 is not going away anytime soon so we need to continue to use ArcGIS and data analysis to deliver practical solutions to managing this ongoing public health crisis.”

Westminster City Council
Our innovative user of GIS has helped deliver an innovative approach to waste services procurement which could contribute to avoided costs of £2 million per year.
Westminster City Council has made innovative use of GIS to help ensure that new tenders for its £225 million waste disposal contracts offer the best possible value for money. It anticipates that its new approach to waste services procurement could contribute to avoided costs of up to £2 million a year.
ArcGIS allows the council to make more informed decisions about supplier appointments
The GIS-enabled project has given the council rapid insight into complex public service requirements
By using ArcGIS, the council avoided the need to pay external consultancy fees of £20,000
The Challenge
Every year, a staggering 190,000 tonnes of rubbish are generated by households and businesses in the City of Westminster, enough to fill the Royal Albert Hall 26 times over. With the two main contracts for the recycling and disposal of this waste coming up for renewal, the council’s cleansing department wanted to make absolutely certain that it selected suppliers who could offer optimum value for taxpayers’ money.
With growing congestion on London’s roads along with high fuel costs, the council realised that travel time to and from vehicle depots, waste treatment sites and recycling facilities was a significant factor influencing the cost of waste disposal services. So, in its tender documents for the new contracts, it wanted to encourage bids from contractors who had sites within a short drive-time of the centre of the borough.
The key challenge for the cleansing department was how to accurately measure drive-times for its waste collection vehicles, on busy streets, and along hundreds of alternative routes, at different times of the day. The council initially approached a firm of transportation consultants, which quoted £20,000 to undertake a drive-time analysis project. However by consulting the council’s internal geographic information system (GIS) department, the cleansing department realised it had an alternative means of addressing the challenge, using existing resources.
“ArcGIS Online helped Westminster City Council to make evidence-based decisions and ensure the most effective use of public funds in the management of waste services.”
Jarno Stet, Waste Services Manager, Westminster City Council
The Solution
Westminster City Council has been using solutions from Esri’s ArcGIS platform for many years and the GIS team had recently begun to explore ArcGIS Online. Following a conversation with the council’s cleansing department, the GIS lead at Westminster City Council used ArcGIS Online and network routing data for central London to put together an initial proof of concept, based on the average drive-times of cars. It took him just 15 minutes and even with this first ArcGIS Online map, the cleansing department was extremely impressed.
Next, the council’s GIS team incorporated GPS data from its waste collection trucks, which gave it the actual, average speeds of its own vehicles, at different times in the day. It then worked closely with the cleansing department to analyse the data and produced a map (in web and pdf formats), showing a 35-minute drive-time boundary from Marble Arch, the centre of the borough. “ArcGIS Online makes it extremely easy to adjust and produce maps, so the cleansing department could experiment with different drive-time limits and drive-time boundaries at little cost and in little time,” says Jarno Stet, Waste Services Manager at Westminster City Council.
“ArcGIS will continue to play an important role in future waste contract procurements, as well as similar projects in other departments, giving us long-term value for money”
Jarno Stet, Waste Services Manager, Westminster City Council
Benefits
Westminster City Council embedded the ArcGIS Online map into its tender documents for new waste collection contracts enabling it to give favourable consideration to bids from contractors with sites within the delineated 35-minute drive-time area. This focused procurement approach delivered significant benefits including:
Evidence-based decision making
With its new insight into the optimal operation of waste collection vehicles, the council could set meaningful criteria for prospective new contractors and make appointments based on facts. As Stet says, “ArcGIS Online helped Westminster City Council to make evidence-based decisions and ensure the most effective use of public funds in the management of waste services.”
Value for money for taxpayers
By appointing contractors with the closest sites, Westminster City Council minimised the cost of fuel and employee time, and ensured that contracts represented the best possible value for taxpayers’ money. Stet explains: “The cost implications of selecting contractors with waste treatment sites with unacceptable travel distances could add up to £6 per mile. When this figure is multiplied by the number of miles travelled every year, the number of vehicles we operate, staff labour and overtime cost, the total annual avoided cost could be as much as £2 million."
Fast insight into complex challenges
ArcGIS Online gave the council a fast and flexible solution to its challenge, enabling it to find the answers to its drive-time question within the tight timescale of the procurement process. Using ArcGIS Online, the GIS lead was able to conduct drive-time analysis and produce a detailed map in minutes, for an expenditure of around 30 pence in user credits.
Return on annual investment in GIS
Whereas external consultants had quoted £20,000 to perform drive-time analysis, Westminster City Council was able to complete the project itself, using its existing licence for ArcGIS Online and the skills of in-house staff. With the consultancy fee savings from this one small project, the council offset the entire GIS software spend for the year. “ArcGIS will continue to play an important role in future waste contract procurements, as well as similar projects in other departments, giving us long-term value for money,” Stet says.

Ricardo
Our migration to ArcGIS Pro is helping us to create and share high quality data sets on air quality and greenhouse gas emissions
Ricardo has been using ArcGIS solutions to help it create and publish data on air quality and greenhouse gas emissions for many years. The migration from ArcMap to ArcGIS Pro has enabled it to accelerate complex data analyses and share its critical environmental data more easily with government clients.
ArcGIS Pro makes the latest tools, functionality and data sets more accessible to users in one place
ArcGIS Notebooks, integrated in ArcGIS Pro, allows the automation of complex data analyses
cGIS Pro is tightly connected with ArcGIS Enterprise and ArcGIS Online, making it easier to publish work
The Challenge
At a time when the world urgently needs to address the climate change emergency, Ricardo is playing a vital role in helping governments to understand changes in air quality and greenhouse gas emissions. The consultancy’s Energy & Environment division creates and shares data that can be used by air quality modellers, academics and policy makers to better understand climate change challenges and formulate the best new policies to improve public health. Its work is precise, detailed and specialised, demanding a high level of accuracy.
ArcGIS Pro is helping us to create high quality data that can be used by governments to help improve the world we live in for us, our kids and future generations.”
Ioannis Tsagatakis - Principal Environmental Consultant, Ricardo
The Solution
Ricardo’s services in the field of air quality and greenhouse gases have, for many years, depended on the use of ArcGIS solutions. Wanting to take advantage of the latest ArcGIS technology, the company decided to migrate to ArcGIS Pro for its desktops. It already used ArcGIS Enterprise, as well as ArcGIS Online, for sharing data internally with colleagues and externally with clients and considered the migration to ArcGIS Pro to be the logical next step.
Undertaking the migration during the COVID-19 pandemic created a few unexpected challenges for Ricardo. In particular, it discovered that it needed to upgrade its workstation graphics cards to optimise the performance of ArcGIS Pro, but there was a global shortage of graphics cards at the time. It also took users a while to adapt to the new desktop solution, but once they were familiar with the new user interface they found it easy to use.
Now, Ricardo uses ArcGIS Pro, instead of ArcMap, to analyse rasterised data on air quality, as well as emissions data, on the desktop. It also uses ArcGIS Pro to prepare and publish data via ArcGIS Online and ArcGIS Enterprise. Principal Environmental Consultant, Ioannis Tsagatakis, says: “ArcGIS Pro has good connectivity with ArcGIS Enterprise and ArcGIS Online, making it easier for us to share our work.”
Ricardo makes particular use of ArcGIS Notebooks, a solution that is integrated into ArcGIS Pro and includes functionality for data cleaning and transformation, numerical simulation, statistical modelling and machine learning. ArcGIS Notebooks are now used to automate complex scripting tasks, rather than using Esri’s legacy ArcInfo Workstation product. Data can be more easily transferred from ArcGIS Notebooks to ArcGIS Pro and published, improving the management of data.
Using the data processing capabilities of ArcGIS Pro makes our work as efficient and error free as possible.
Ioannis Tsagatakis - Principal Environmental Consultant, Ricardo
The Benefits
All the tools that users need, in one place
Everything that employees used to do with ArcMap can be done with ArcGIS Pro, but now all the tools and features are easier to find and use. Consequently, Tsagatakis believes it will be much simpler for new users to start using ArcGIS to undertake projects for clients, to the high standard that is necessary. “Our work estimating air quality is vitally important,” he says. “ArcGIS Pro is helping us to create high quality data that can be used by governments to improve the world we live in for us, our kids and future generations.”
Efficient large-scale data processing
Using ArcGIS Notebooks in ArcGIS Pro, Ricardo can apply scripting to automate highly complex data analyses and create cost-effective, repeatable processes. For example, the company is using ArcGIS Notebooks to allocate traffic emissions to Ordnance Survey’s Open Roads data, in what is a complex, enormous and annual project funded by the Department of Business, Energy and Industrial Strategy (BEIS) and the Department of Environment, Food and Rural Affairs (Defra). “Using the data processing capabilities of ArcGIS Pro makes our work as efficient and error free as possible,” Tsagatakis explains. “It enables us to complete high quality projects for our government clients within the time and budget they have available."
Simplified data sharing with government clients
The tight integration of ArcGIS Pro with ArcGIS Enterprise and ArcGIS Online makes it far easier for Ricardo to publish its data and share it with its clients, including Defra and BEIS, as well as international clients including, most recently, government departments in Cyprus and Peru. It used ArcGIS Pro to create the spatial components of a tool for viewing heat demand data across different postcodes and regions of Cyprus. It then published this data online, using ArcGIS Online, enabling people to explore the data on interactive maps.
Easy access to contextual maps and data
With ArcGIS Pro, it is easier for users to access new base maps and add data from the Esri Living Atlas to enhance projects. For example, when Ricardo was asked to review agriculture emissions data from the EU member states, it was able to quickly download land cover maps from the Living Atlas, which enabled it to see patterns of agriculture emissions against land type in ArcGIS Pro and visually verify the accuracy of the data. As Tsagatakis says, “Being able to add land cover data and other data sets to our projects, with just a few clicks, is one of the beautiful things about using ArcGIS Pro."