Blog Archives
Bord na Móna
We have invested in ArcGIS within the field and on our desktops to inspect contractors' work, track quality control trends and contribute to the success of government energy-saving programmes.
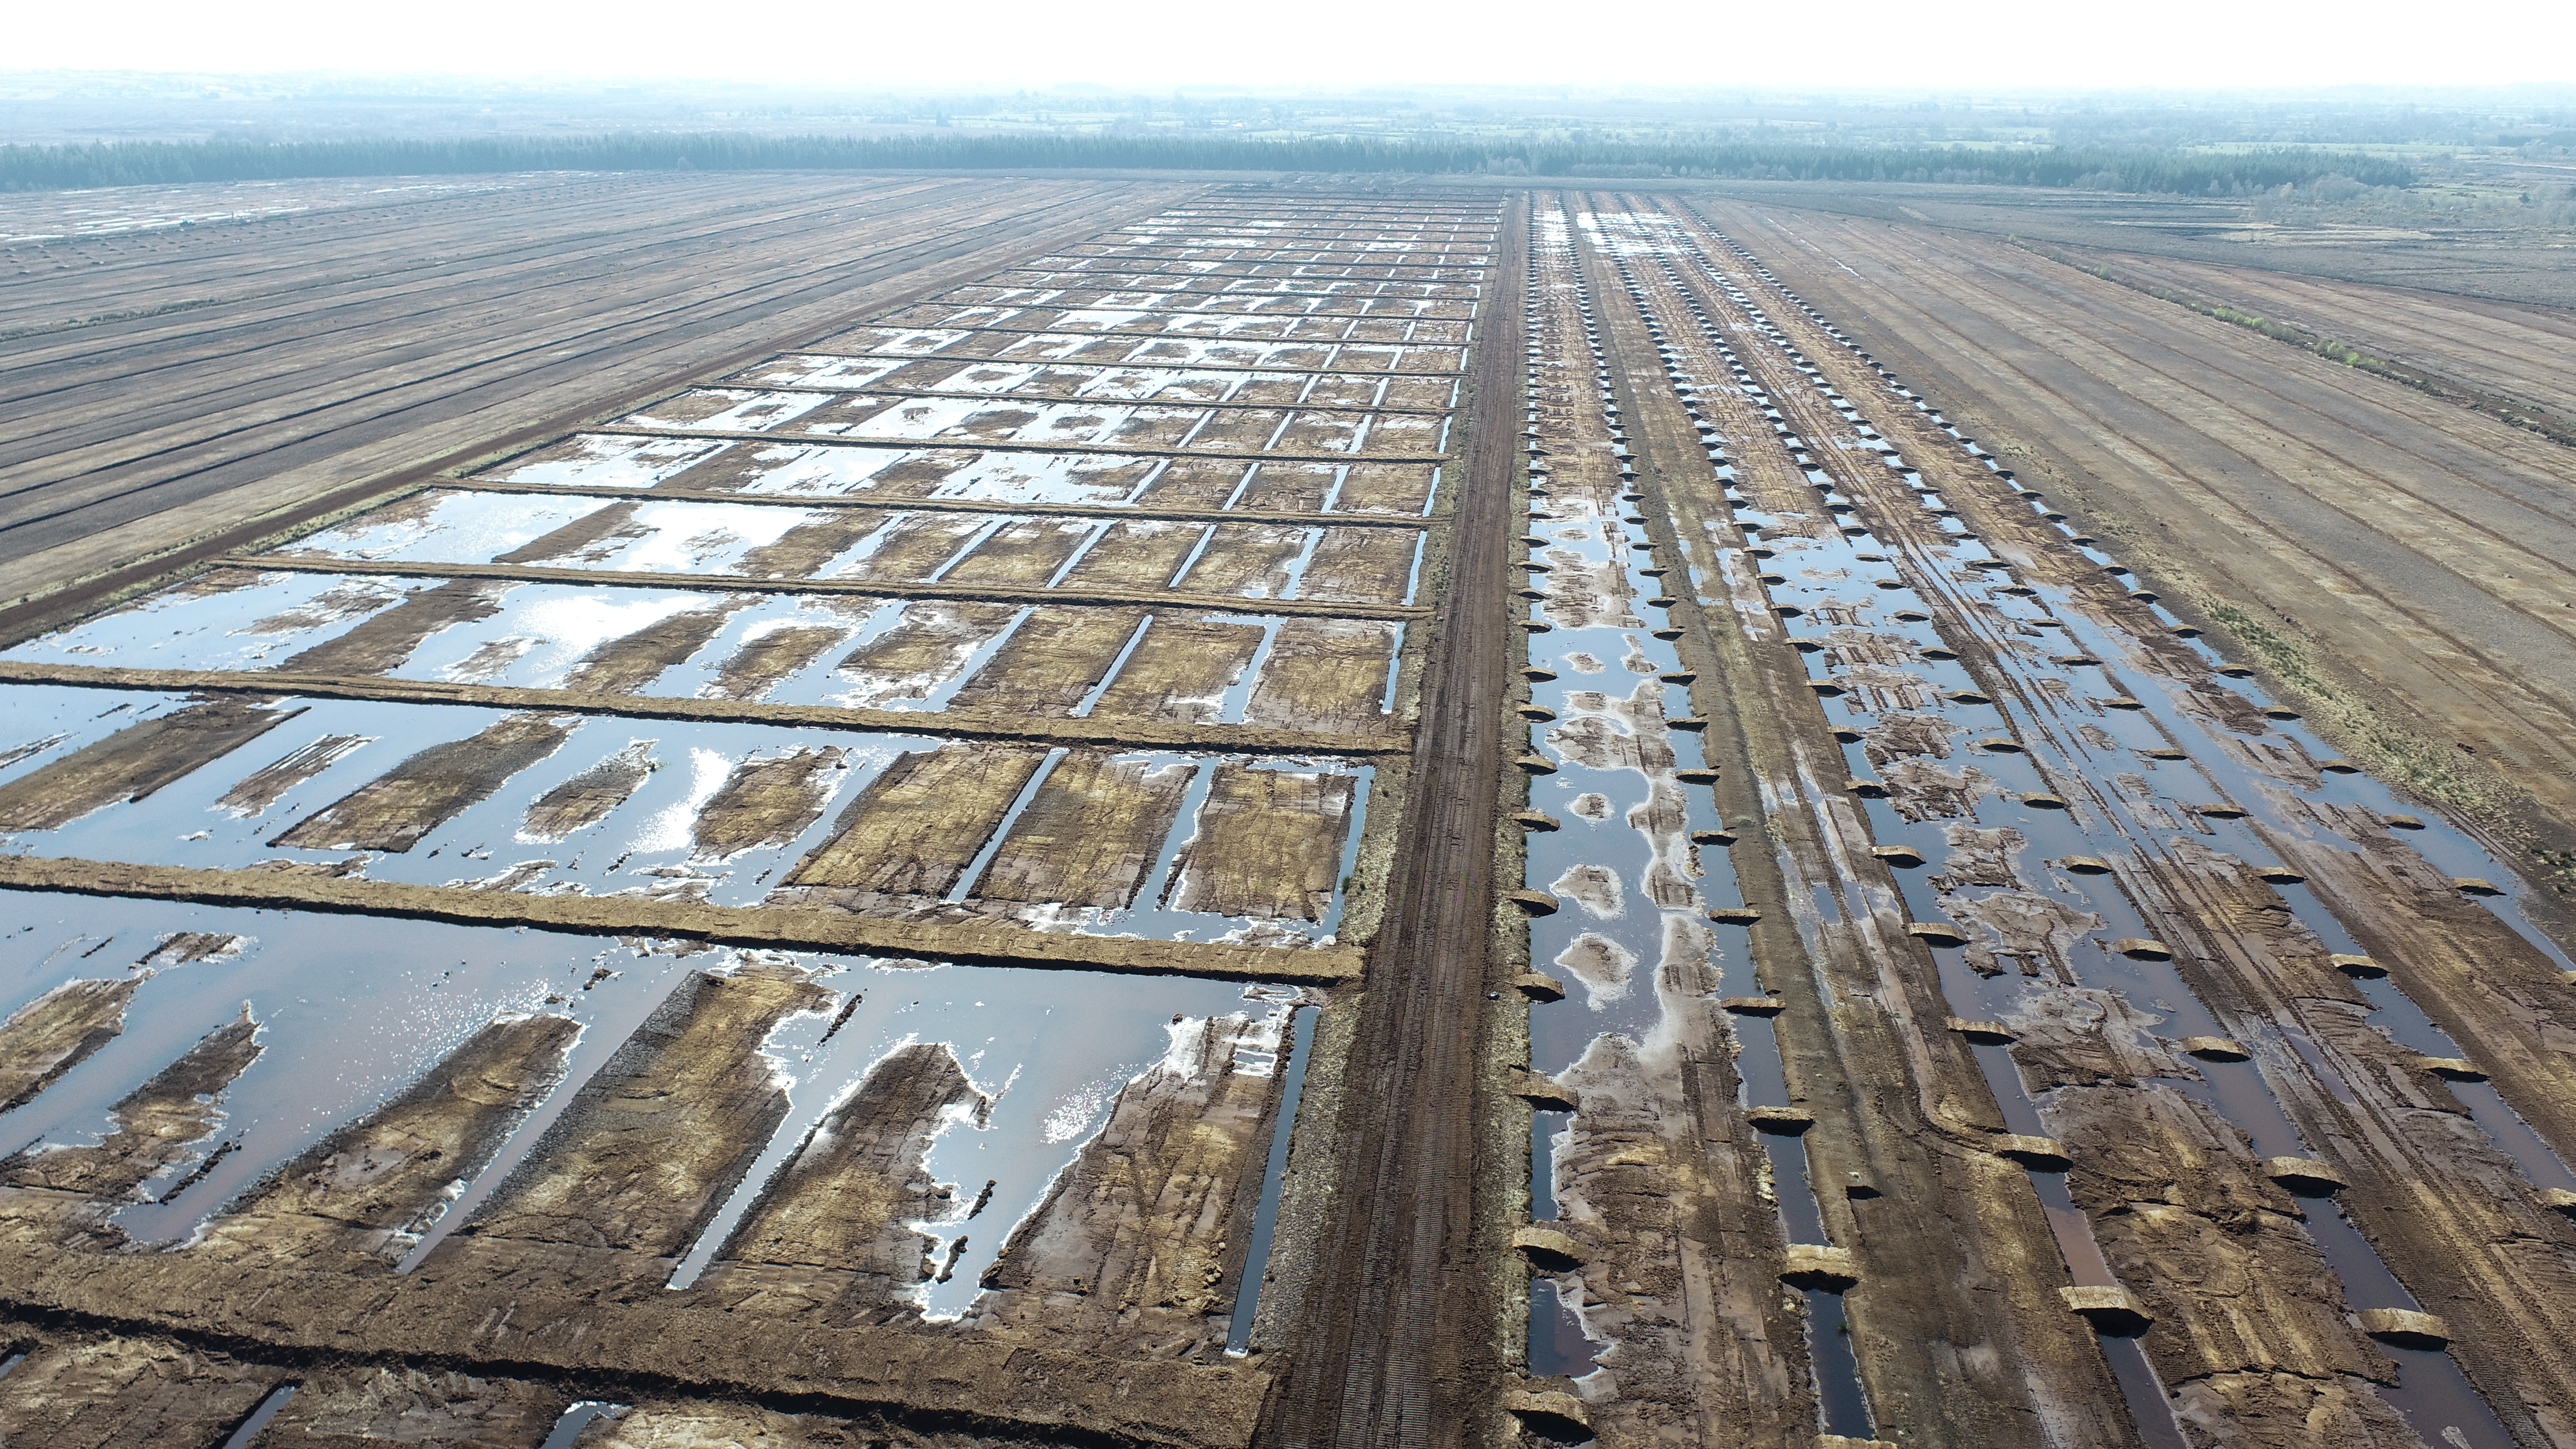
Bord na Móna is actively engaged in projects to restore and rehabilitate 33,000 hectares of peatlands. It uses ArcGIS to design the most appropriate rehabilitation measures and then implement a wide range of measures as quickly and efficiently as possible.
Ecologists and GIS specialists use ArcGIS Pro and SWEET for ArcGIS on the desktop to prepare detailed rehabilitation plans
Surveyors and engineers use ArcGIS online and in the field to ensure restoration measures are implemented accurately
Senior managers use ArcGIS dashboards to monitor the progress of up to 19 simultaneous rehabilitation projects per year
The Challenge
Bord na Móna is proud of the role it is playing in helping Ireland to achieve a net carbon zero future. Now that commercial peat extraction has ceased, the organisation is leading the way in restoring and rehabilitating precious peatland ecosystems. Recognising the vital importance of peatlands for carbon storage and ecosystem services, it has set itself the ambitious target of regenerating 33,000 hectares of peatland in just five years via the Peatland Climate Action Scheme, funded by the Government of Ireland and Bord na Móna.
Using ArcGIS, we can quickly visualise the existing conditions across thousands of hectares of bogs using numerous datasets and design and implement the most appropriate rehabilitation measures to restore peatland function and deliver climate action benefits.
Mark McCorry – Ecology Manager, Bord na Móna
The Solution
Having used geographic information system (GIS) technology from Esri for around twenty years to support its former peat extraction operations, Bord na Móna is now using Esri’s ArcGIS solutions for its rehabilitation activities.
For each bog identified for rehabilitation, GIS specialists and ecologists use the desktop solution ArcGIS Pro and 3D spatial analysis tools to examine the ground level and create detailed, map-based rehabilitation plans. The ecology team also uses the web-based editing solution Sweet for ArcGIS, to accelerate the editing and amendment of these plans, before sharing with the engineering team.
Once a rehabilitation scheme has been agreed, the map-based plan is uploaded to ArcGIS Online, where employees in environmental, survey and engineering teams can view it on a range of ArcGIS web apps and field apps to help them implement the recommended measures. For example, surveyors view the ArcGIS-based maps on GPS-enabled tablets while in bogs to accurately mark out on the ground where different measures, such as drain blocks, should be located. In very remote areas, with little or no mobile coverage, maps can be downloaded to mobile devices and updates synchronised later.
During rehabilitation projects, the engineering team uses ArcGIS field apps to record the progress of different initiatives within a bog area on colour-coded maps of each site. This data, collected on maps in the field, feeds into a series of Esri operational dashboards in near real time. Senior managers within Bord na Móna can view these dashboards at any time to obtain an overview of progress on each site and reports for scheme regulators and third parties can be easily generated.
“ArcGIS is engrained in our bog rehabilitation process,” says Michael Lenihan, GIS Lead at Bord na Móna. “We have around 85 day-to-day users of ArcGIS either on the desktop, via the web or in the field.”
With ArcGIS Online, everyone sees the most up-to-date plans, whether they are working in the office or in a bog, and this helps to ensure that ecology plans are carried out as intended.
Michael Lenihan - GIS Lead, Bord na Móna
The Benefits
Appropriate rehabilitation measures identified
The use of ArcGIS gives ecologists the detailed insight they need to identify which rehabilitation measures will be most appropriate, not just on each bog, but within different parts of the same bog. Each bog can be quite different, with a variable environment and a mosaic of peat depths, hydrology, habitats and topography, meaning there will be different goals and outcomes. Plans designed by ecologists can comprise multiple interventions such as drain-blocking and bunding to optimise hydrological conditions to re-wet peat. “Using ArcGIS, we can quickly visualise the existing conditions across thousands of hectares of bogs using numerous datasets and design and implement the most appropriate rehabilitation measures to restore peatland function and deliver climate action benefits,” says Mark McCorry, Ecology Manager at Bord na Móna.
Accurate implementation of measures
Through the use of ArcGIS Online, Bord na Móna is able to ensure that all employees have access to the latest versions of each of its rehabilitation plans and supporting datasets. This helps to minimise miscommunication, allows constant updating, and eliminates mistakes in the implementation of measures. “Changes to schemes occur regularly,” explains Lenihan. “With ArcGIS Online, everyone sees the most up-to-date plans, whether they are working in the office or in a bog, and this helps to ensure that rehabilitation plans are carried out as intended.”
Efficient working in remote, wild landscapes
With bogs from Galway to East Kildare, employees are generally dispersed across the country and work in very remote, wild landscapes. The use of ArcGIS field apps eliminates the need for them to record information on paper and type it up later, saving time and improving the accuracy of data collection. For example, the environmental team uses ArcGIS Survey123 to record the locations of railway lines, pipes and machinery, left over from the industrial era, that need to be removed. As the data collected is captured immediately on ArcGIS dashboards, plans to decommission this equipment can be drawn up and enacted more efficiently.
Clear visibility of progress made
Bord na Móna is currently planning or implementing rehabilitation schemes on up to 19 sites per year. The Esri dashboards give senior managers clear visibility of the progress of all of these simultaneous projects, wherever they are happening in Ireland. The GIS team can also use the dashboards to generate automated, accurate reports for stakeholders, such as the Department of Environment, Climate and Communications, and the National Parks and Wildlife Service. “Without the dashboards, we would have to spend a lot of time producing pdf maps and reports,” Lenihan says. “Instead, we can output progress data in a matter of minutes.”


LSTC
Migrating from ArcMap to ArcGIS Pro has led to significant improvements in the way that we conduct asset surveys and develop feasibility studies for our clients.
The decision to migrate from Esri’s ArcMap to ArcGIS Pro and ArcGIS Online enabled LSTC to reenergise key business processes and streamline the way that it collects, analyses and shares data, from field to client. The electricity industry services provider can now operate more efficiently and avail of more extensive, accurate data to help it plan the best routes for new electricity lines.
ArcGIS Pro and ArcGIS Online enable route planners and environmentalists to plan new electricity routes more quickly and easily
The migration to ArcGIS Pro and ArcGIS Online was the springboard for the creation of streamlined business processes
Surveyors and inspectors use ArcGIS mobile solutions to collect accurate data, upload images and create maps in the field
The Challenge
LSTC specialises in the design and survey of overhead lines, underground cables and substation systems, and its teams of engineers, asset inspectors and planners need to collect data in the field on an almost daily basis. Previously, they used a custom-built solution, but this Windows-based data capture software didn’t enable them to upload images alongside survey data or draw maps while in the field. Digital maps, work schedules and pdf reports for clients all had to be created manually when employees returned to the office, in what were unnecessarily disjointed and time-consuming business processes.
“We started to understand the whole ArcGIS concept and how it could support our business in more ways..”
Martin Straker, Director and Founder, LSTC
The Solution
LSTC was already using Esri’s ArcMap solution to support route planning, but had not previously considered using geographic information system (GIS) technology to streamline its field-based operations. The company’s Director Martin Straker participated in a series of webinars about Esri’s full suite of ArcGIS solutions and, as he says, “This sparked our interest in using GIS more extensively. We started to understand the whole ArcGIS concept and how it could support our business in more ways.”
A few months later, LSTC took the decision to migrate to Esri’s ArcGIS Pro and ArcGIS Online, opening the door for the company to make greater use of ArcGIS tools across multiple teams within the business – in the field, desktop and online. Experts from Esri UK’s Professional Services team supported LSTC with the product migration, helping the company to optimise its use of ArcGIS Pro and ArcGIS Online and transform business processes.
Now, LSTC’s route planners, surveyors and inspectors use ArcGIS Pro instead of ArcMap to view environmental data, map existing and potential electricity transmission and distribution routes and gain a comprehensive understanding of potential constraints along the way. The team finds ArcGIS Pro much simpler to use, with a cleaner interface, easy-to-find tools and a seamless link between the desktop and ArcGIS Online. Users can more easily incorporate live content and up-to-date base mapping into projects, work on multiple maps simultaneously and save and reuse their own mapping templates.
LSTC has used ArcGIS Pro, ArcGIS Online, and ArcGIS mobile solutions to build seamless workflows. For example, surveyors and inspectors now use a combination of ArcGIS Field Maps, ArcGIS Collector and ArcGIS Survey123 to collect survey data and images in the field, as well as view and edit digital maps. All of the data collected about the condition of electricity poles is collated in ArcGIS Pro, where it can be analysed, interrogated and visualised on interactive maps. Work schedules for clients, indicating which poles need repairs or replacement, are automatically generated from the data in ArcGIS Pro, without any manual intervention, and progress data can be shared with clients using ArcGIS Dashboards.
“ArcGIS enables us to show clients more easily why we have made certain routing or design decisions and why the routes proposed are the most suitable..”
Rob Salter, Managing Director, LSTC
Benefits
Increased business efficiency
The migration to ArcGIS Pro and ArcGIS Online has improved efficiency in the planning and environmental departments, as employees can do the same tasks that they have done in the past, more quickly and easily. Managers can also use ArcGIS Pro to deploy inspectors more logically so that they can survey more poles in the shortest amount of time. Equally, in the field, asset inspectors can effortlessly capture images alongside data, for the first time, as well as draw up maps on site. LSTC anticipates that the time savings gained will enable the company to complete more projects, with the same staff, ultimately delivering a good return on investment in ArcGIS.
Richer data to inform routing plans and feasibility studies
LSTC now has a larger, more varied and more accurate reservoir of data, which it can analyse in ArcGIS Pro and use to inform its routing plans and feasibility studies for clients. The Esri Living Atlas provides access to more extensive data resources, while employees can collect more data and images in the field to build up a fuller picture of sites. “With the ability to analyse so much more data, we can answer questions that weren’t even questions when we started to conduct our surveys,” says Rob Salter, Managing Director of LSTC.
Shared understanding of design decisions
Using ArcGIS Pro, LSTC can visualise existing and proposed new electricity transmission and distribution routes and easily demonstrate why routes need to be diverted, to avoid conservation areas or other utilities, for example. This helps employees within LSTC to collaborate more effectively and also improves communication with clients. As Rob explains, “ArcGIS enables us to show clients more easily why we have made certain routing or design decisions and why the routes proposed are the most suitable.”
Significantly improved business agility
With LSTC’s previous Windows-based data capture solution, it used to take a long time to implement survey changes, as each change required a full software update. Using ArcGIS tools however, LSTC has the agility to change and add survey questions on demand. Isaac Wood, Data Capture Manager at LSTC, says: “In the past, it could have taken two or three weeks to change survey questions, whereas with Survey123, changes can be made within an hour and delivered out to everyone in the field that same day.”


Transport Scotland
Transport Scotland’s ArcGIS Gritter Tracker solution has transformed the perception of gritting services in Scotland.
Road users in Scotland can now see for themselves precisely which roads are being gritted in bad weather, by taking advantage of an interactive ArcGIS app. Developed for Transport Scotland by Esri UK, the solution has attracted widespread media attention and improved public confidence in the organisation’s gritting services.
The ArcGIS app attracted well over a million visits in one winter season alone
Live vehicle GPS data from nine separate operating companies is displaying on a single interactive map
The solution is hosted and managed by Esri UK through its Managed Cloud Services
The Challenge
When temperatures fall and icy weather is forecast, people who live, work and travel in Scotland depend on Transport Scotland to ensure that 2,179 miles of trunk roads and motorway are gritted. The national transport agency for Scotland has over 210 gritting trucks, operated by nine regional contractors, and wanted to find a way to let people know exactly where they were and which roads were being gritted. “We have a huge fleet of gritters out there, but people claimed they never saw them,” says Iain McDonald, Network Resilience Manager at Transport Scotland. “We wanted a way to show where all the gritters are, in real time, and reassure the public that we are doing what we can to keep roads safe.”
“Esri UK’s Managed Cloud Services platform has been able to deal with huge spikes in the usage of the app, particularly during extreme weather or following publicity.”
Iain McDonald, Network Resilience Manager, Transport Scotland
The Solution
Transport Scotland had prior experience of using Esri’s ArcGIS, so decided to leverage this geographic information system (GIS) technology to help it improve public awareness of gritting activities. It engaged consultants from Esri UK to develop the solution, as well as host and manage it through Esri UK’s Managed Cloud Service. “We knew exactly what we wanted and because of our tried and tested relationship with Esri UK, we could trust them to build, host and manage the solution for us,” McDonald says.
In a development project described by McDonald as “some kind of wizardry,” the Esri UK consultants created a bespoke API to stream data from nine separate GPS tracking systems, used by Transport Scotland’s nine operating companies, and present the locations of all the gritters on the trunk roads in Scotland, on one live, interactive map for the first time. The consultants then added layers of supplementary data, including 3D terrain models and traffic data showing traffic delays. The app has an attractive, intuitive interface making it easy for members of the public to see all trucks, and their direction of travel, on any device.
To help it publicise the ArcGIS Gritter Tracker app and encourage members of the public to use it, Transport Scotland gave its gritters imaginative and fun names such as Sir Andy Flurry, Gritney Spears and Chilly Connolly. During the winter service period, which typically runs from 1st October until 15th May, anyone can access the app and search for their favourite gritter by name or see which gritters are in a specific location.
Having a hosted, managed GIS solution has been a significant advantage to Transport Scotland, as the organisation can be confident that the app will always be available and can scale up rapidly to meet unexpected surges in demand. “Esri UK’s Managed Cloud Services platform has been able to deal with huge spikes in the usage of the app, particularly during extreme weather or following publicity,” McDonald says. “The app has always been able to perform.”
“The ArcGIS app gives confidence to the general public that our winter service is being provided throughout the whole of Scotland on the Scottish Trunk Road Network.”
Iain McDonald, Network Resilience Manager, Transport Scotland
Benefits
Improved public confidence in gritting services
The ArcGIS Gritter Tracker app has significantly improved public awareness of the full extent of gritting services carried out in Scotland. The app received 1,020,985 hits in the winter of 2020 to 2021 and, in the same period, there was a substantial decline in the number of calls to Transport Scotland’s call centre from people asking about gritting. “The ArcGIS app gives confidence to the general public that our winter service is being provided throughout the whole of Scotland on the Scottish Trunk Road Network,” McDonald says. “By letting the public see all our gritters, the app improves recognition of the hard work that goes into providing winter service across the country.”
Widespread positive publicity for Transport Scotland
Transport Scotland shared the ArcGIS Gritter Tracker app extensively by social media and through public relations campaigns, resulting in widespread and highly positive publicity for the organisation. The app, together with the gritters’ names, really captured the public’s attention and attracted media interest from as far away as the USA, Canada and Russia. “The exponential rise in user figures, especially during severe weather, is the biggest measure of success for this project,” McDonald believes. “The public trusts our ArcGIS app and keeps coming back to it.”
Collaborative management of extreme weather events
Although the ArcGIS Gritter Tracker app was never intended to be an operational tool, it is nonetheless used internally within Transport Scotland to support the management of gritting operations. With instant access to live data on the locations of all gritting trucks, on one screen, together with data on traffic disruptions and terrain, Transport Scotland can better manage its contractors and make rapid, well-informed decisions during extreme weather events. When the ‘Beast from the East’ storm hit Scotland in 2018, the app was used in the National Control Centre to share live situational data with other agencies including Traffic Scotland and Police Scotland.
Engaging interactions with local communities
Transport Scotland and its local operating companies now use the ArcGIS Gritter Tracker app in community engagement initiatives to capture people’s interest. Popular with young people, the app is used in schools as a way to open up important conversations about road safety in bad weather. The app also helps to educate pupils about maps, showcase the use of digital technology in the delivery of public services and inspire them with ideas for their future careers.
British Red Cross
Migrating to the latest ArcGIS technology enabled us to accelerate the development of a suite of GIS apps and tools that are now helping us respond to emergencies, alleviate health inequalities and supporting displaced or migrating people.
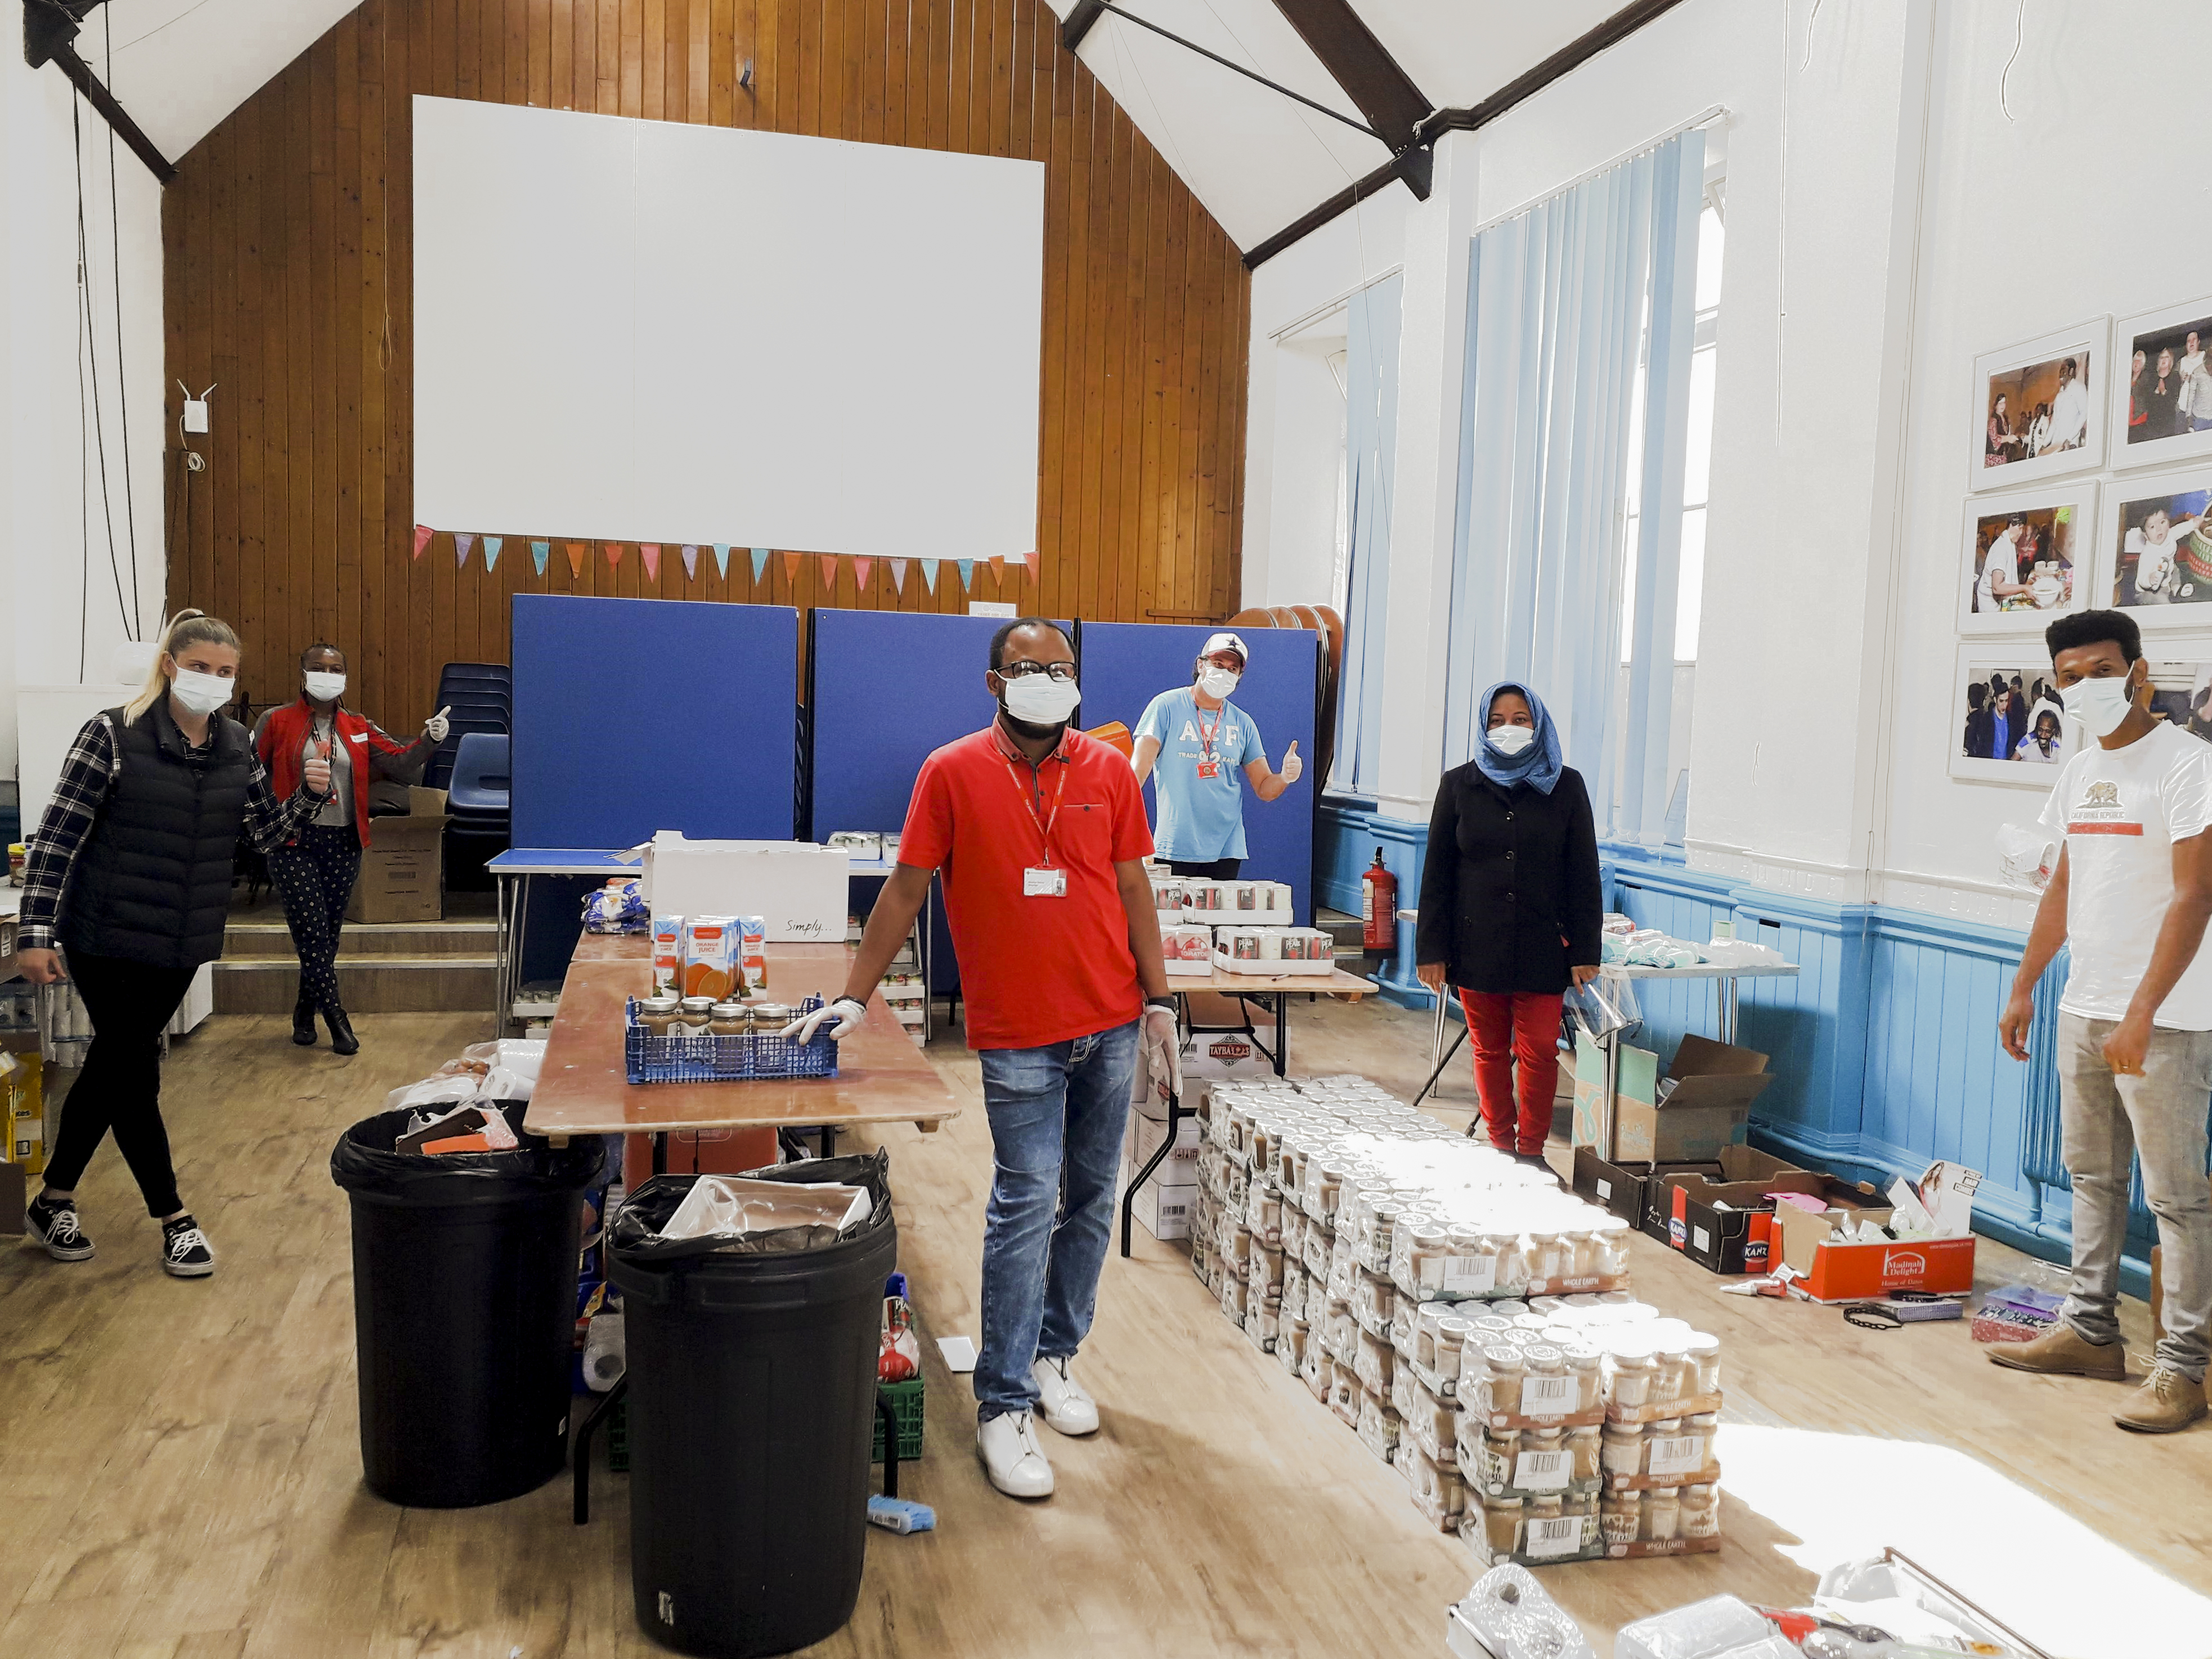
The British Red Cross is using the latest ArcGIS technology to help it respond more effectively to all kinds of emergencies, from sheltering people affected by house fires and flooding to supporting vulnerable people through lockdowns. It has developed a suite of new web apps that enable it to better allocate its resources, collaborate effectively with partners and provide faster support for people in crisis.
Crisis Response Contact Centre staff can easily see which vehicles are nearest to people who need urgent help
Staff, volunteers & 230 partner organisations have a shared understanding of the impacts of COVID-19 on communities
Emergency response coordinators and senior managers have clearer, map-based information to support decision making
The Challenge
In 2020, the British Red Cross launched a new ten year strategy, setting out its plan to not just respond to disasters and emergencies, but also play key roles in alleviating health inequalities and supporting displaced or migrating people. With this wider remit, the British Red Cross needed to be able to expand its use of data analytics and data visualisation tools to help it optimise the allocation of its resources and deliver relevant, efficient services to those most in need.
“The efficiency gains delivered by ArcGIS will allow the British Red Cross to support people in crisis faster and more effectively.”
Paul Knight, GIS and Information Management Technical Advisor, British Red Cross
The Solution
The British Red Cross had been using Esri’s ArcGIS Desktop solution for many years and decided to migrate to ArcGIS Pro and ArcGIS Online to gain access to the latest cartographic tools as well as a suite of ArcGIS apps, solutions and geospatial data. This advancement in the charity’s geographic information system (GIS) capabilities stimulated greater use of geospatial data within the organisation and led to the development of several brand new solutions and web apps that are now supporting the charity in achieving its strategic goals.
Alongside ArcGIS Pro, the British Red Cross uses ArcGIS Online to share data internally and with partners. In particular, the charity is increasing its use of ArcGIS Notebooks within ArcGIS Online, a cloud-based interface for conducting geospatial data analysis and visualising data in a geographic context. In addition, the British Red Cross uses ArcGIS Maps for Power BI, enabling it to create more sophisticated and intuitive maps within the Microsoft Power BI app.
The organisation is now exploring how it can use ArcGIS Hub to provide a single place where the organisation can publish all its geospatial data, making information more accessible to the whole organisation, as well as partners. “We are moving towards our goal of creating a single source of the truth and geographic data, for everyone to use,” says Paul Knight, GIS and Information Management Technical Advisor at the British Red Cross.
“Using the latest ArcGIS technology frees up our time to work with service departments and develop new solutions, so that British Red Cross can have a greater impact on the communities that it serves.”
Paul Knight, GIS and Information Management Technical Advisor, British Red Cross
Benefits
More efficient responses to emergencies
The British Red Cross has significantly improved the efficiency of its responses to domestic emergencies, such as house fires, through the use of a new web mapping tool. Created using ArcGIS Online, the tool provides staff in the Crisis Response Contact Centre with a more streamlined way of assessing the locations of response resources relative to the locations of people who are in need of urgent help. Working 24/7, staff can access all the information they need from within the app to source volunteers and initiate the most appropriate response. “The efficiency gains delivered by ArcGIS will allow the British Red Cross to support people in crisis faster and more effectively,” Knight says.
Shared understanding in a fast-moving situation
At the onset of the coronavirus crisis, the British Red Cross was able to use ArcGIS to rapidly create a COVID-19 Response App and a COVID-19 Vulnerability Index map, which provided its staff, volunteers and the 230 partner organisations that form the Voluntary and Community Sector Emergencies Partnership, with a shared understanding of the fast-moving situation. As everyone could see the same data, it was easier to coordinate the activities of multiple voluntary organisations and ensure that support was provided to groups most affected by the pandemic, lockdowns or furloughs.
Targeted allocation of resources to areas of greatest need
Using the capabilities of an ArcGIS Instant App template and ArcGIS Online, the British Red Cross has been able to analyse where to position its future service provision relative to need. For example, the organisation has used public deprivation data and its own derived
COVID-19 Vulnerability Index data, both hosted on ArcGIS Online, to identify where there is greatest need for workshops delivered by the Community Education Team on issues such as loneliness and digital exclusion. ArcGIS Online has enabled the British Red Cross to reuse its own powerful datasets in multiple products, allowing different users at operational
and strategic levels to make data-driven decisions.
Well-informed decision making and improved reporting
Using ArcGIS Maps for Power BI, the British Red Cross has been able to augment its existing Power BI reports and gain more insight into the specific areas where it delivers services. The ArcGIS Maps for Power BI visualisation allows the organisation to combine and present complex data on intuitive maps, within a tool with which users are already familiar. The information is easier for emergency response coordinators and senior managers to understand and use. For example, the British Red Cross uses Covid-19 Vulnerability Index data from ArcGIS Online, combined with volunteer location data from internal databases to analyse gaps in response capacity.
Time freed up to develop new solutions
The migration to ArcGIS Pro and ArcGIS Online has reduced the amount of time spent on data maintenance and data sharing, enabling the GIS team to work on more impactful projects. In one recent initiative, the British Red Cross has used ArcGIS Pro to identify the optimum locations for emergency response vehicle locations and reposition them to make them more accessible to the largest number of volunteers. “Using the latest ArcGIS technology frees up our time to work with service departments and develop new solutions, so that the British Red Cross can have a greater impact on the communities that it serves,” Knight says.

East Riding of Yorkshire Council
Using ArcGIS Survey123 we are transforming Health & Safety monitoring for safety-critical Council Service workers.
In a local government first, East Riding of Yorkshire Council has developed a new approach to keeping its Streetscene Services workers safe while optimising reliability and efficiency of data collected. Using ArcGIS Survey123 it has built a user-friendly Streetscene Services app, accompanied by performance dashboards to capture data, monitor and manage mobile workers. Similar apps are expected to be rolled out across further Council aid services.
Better management of the health and safety of staff in more safety critical roles
Authoritative and reliable data capture gives an enhanced picture of issues on the ground
Surveys quick and simple to spin up and amend, with no third-party support required
The Challenge
It was only by attending a GIS User forum that the Project Manager for Waste and Streets for East Riding of Yorkshire Council (ERYC) realised he had a problem. Steve Parkinson’s role is to find solutions for the Council to address key tenets of the Government’s ‘Resources & Waste Strategy for England’. Having attended the event, he could see that there was a better way to improve the undertaking and monitoring of site safety inspections for operational teams within ERYC’s Streetscene Services.
Delivered from five separate depots, ERYC’s Streetscene’s remit covers multiple services ranging from environmental programmes to highway maintenance and technical services. Site inspections of mobile workers are required by law, to monitor the compliance of operational teams with health and safety measures. However, the effectiveness of site inspections and the quality of data being collected was becoming an issue.
Software used to carry out site safety monitoring was unreliable. The app would often crash when users were submitting site safety inspections, so data could not be sent. Supervisors undertaking site inspections would also have to use paper forms to assess seasonal Health and Safety requirements, eg ensuring mobile workers were using sun cream on hot days, resulting in wasted time transferring data from paper records from surveys in the field, to a central database.
Given the importance of maintaining Health & Safety standards and, with ERYC mandated to perform one site safety inspection once per month, for each mobile worker, a more sophisticated yet simple-to-use digital approach was required.
“Seeing the demos at the GIS User Forum made me realise there was a better way of doing things at ERYC. I quickly configured a pilot survey in ArcGIS Survey 123 which was a major success, ultimately leading to survey roll-outs across all areas of Streetscene services.”
Steve Parkinson, Project Manager for Waste & Streets, East Riding of Yorkshire Council
The Solution
Even with only limited experience of using desktop GIS (ArcMap), Steve was able to transpose questions from Health & Safety Executive (HSE) guidance into a pilot site safety inspection survey, for waste collection and street cleansing services, into ArcGIS Survey123. Additional features offered by ArcGIS Survey123 such as location and photo capture and a signature box, were added.
The survey asked the supervisor to rate criteria such as staff, vehicle and operations as ‘satisfactory’ or ‘unsatisfactory’ or N/A. Prepopulated lists of answers avoided the issue of free text fields and a mandatory text field would pop up so that ‘unsatisfactory’ answers would enable the supervisor to give comments along with a mandatory image upload prompt, asking the supervisor to take a photo of the issue.
Filters were included to ensure that only relevant questions were included for each site inspection. For example, staff names and services were split so only the names of staff in the specific teams would be shown for each survey.
While data captured in ArcGIS Survey123 is immediately available in ArcGIS, Steve created dashboards to display data in a more user friendly and efficient way. Each dashboard was configured to show relevant data to various levels of management for each service area, from the group manager of environmental services to the service manager of the waste, streets and grounds service.
The initial trial was quickly expanded to include site monitoring for grounds, forestry, cemeteries and play areas. Then, following a group manager meeting for Streetscene Services, it was unanimously agreed to continue the roll-out into all areas of Streetscene Services. Now, any changes to survey questions can be easily and quickly configured in ArcGIS Survey123 in-house, no external IT support, specialist coding or developer services are required. Site inspections are paper free, and supervisors can immediately initiate Health & Safety prompts of the day.
“Managers can now more easily see problem areas they need to focus on because the incoming data is so much more reliable. We would never have had this insight previously an, ultimately, our citizens benefit from better Council services.”
Paul Tripp, Head of Streetscene Services, East Riding of Yorkshire Council
Benefits
Enhanced Health & Safety
Streetscene Services now have greater flexibility and the necessary reliability to better manage the health and safety of staff within the more safety critical aspects of the Council. A reporting mechanism captures any staff that have not received a monthly site safety inspection, ensuring that staff are up to date with health and safety matters and the council is protected from investigations by the HSE.
Integrity of Data
Authoritative data captured by the surveys allows for in-depth analysis to identify trends that can help improve the safety of staff. With greater knowledge of issues on the ground, supervisors can quickly and confidently solve problems thanks to more accurate location capture and images sent direct from site of the survey. Survey updates can be made daily such as new starters or vehicles no longer in use, so data collected is more accurate, further enhancing the reliability of data collected.
Ease of Creation & Use
Having the ability to create and update surveys in-house gives greater control and removes the inconvenience of having to bring in third party developers or specialist coding resources. With ArcGIS Survey123 and ArcGIS Dashboards the department now has a standardised system, the mobile app giving greater flexibility for supervisors carrying out inspections.
Better Use of Resources
Being able to include set text within a survey means that supervisors no longer need to use a paper copy of that month’s team brief. Digitised site inspection surveys with a note field highlighting any relevant messages or issues relating to health and safety removes the need for paper surveys to be printed off in the office, saving paper costs and reducing the burden on supervisors to upload data on their return to the office.

Public Health Scotland
Our rapidly expanding use of ArcGIS is helping us to respond to the challenges of COVID-19 today and plan ahead to develop the healthcare services that patients need for the future.
Geospatial data is now being used in diverse ways to raise awareness of public health issues and inform key decisions about life-saving NHS services in Scotland. Public Health Scotland is using a suite of tools from Esri’s ArcGIS system to help it manage the COVID-19 public health crisis, as well as ensure that healthcare services are located where they are most needed to improve patient outcomes.
Geospatial analysis leads to a deeper understanding of healthcare concerns and patient needs in Scotland
ArcGIS Insights improves the visibility and management of clusters of COVID-19 cases
ArcGIS Dashboards and web apps make public health information more accessible to everyone
The Challenge
For nearly 100 years, vast amounts of data have been collected and stored about medical conditions, healthcare services and facilities in Scotland. Yet, until recently, the location aspect of this huge reservoir of information was hidden away in databases and unused. Public Health Scotland set out to optimise the use of Scotland’s historical medical data, as well as new data on current healthcare concerns, to help it make well-informed decisions about the delivery of healthcare services in Scotland.
If we know where people are and where the health issues are, we can better target health interventions to improve patients’ health and wellbeing.
Andrew Gasiorowski – Principal Information Development Manager and GIS Lead, Public Health Scotland
The Solution
Using a suite of tools from Esri’s ArcGIS system, Public Health Scotland began to analyse data spatially to uncover regional healthcare issues and plan local healthcare interventions. This focus on geospatial analysis couldn’t have come at a more critical time; when COVID-19 emerged in early 2020, Public Health Scotland had the data, the skills and the GIS technology it needed to better monitor and understand the spread of the disease and respond effectively.
At the outset of the coronavirus pandemic, Public Health Scotland used ArcGIS Dashboards to create a COVID-19 dashboard for its website, providing the general public with an accurate picture of the spread of COVID-19 both within the community and in hospitals. Anyone could view the dashboard and use the embedded interactive ArcGIS maps to zoom into specific regions and see the cumulative number of cases by local authority area.
Subsequently, Public Health Scotland used ArcGIS Insights to develop a sophisticated track and trace solution, the Connections tool, which highlights the locations of clusters of COVID-19 cases. Highly secure and for internal use only, this solution allows incident management teams to visualise and analyse near real-time data, in ways that weren’t possible before. Public Health Scotland also worked in collaboration with the Scottish Government and other public sector bodies, using ArcGIS to find the best locations for over 2,000 vaccination centres, taking into account population densities, drive times and candidate facilities.
Public Health Scotland has used the advanced spatial analysis capabilities of ArcGIS in numerous projects to improve understanding of health concerns. In one initiative, the organisation analysed data on secondary schools and fast food outlets, revealing that a large percentage of pupils have access to unhealthy meals within just a five minute walk of their schools. This research is now being used to help develop greater understanding of childhood obesity and inform strategies to promote healthier lifestyles.
In several projects, Public Health Scotland has used ArcGIS to develop interactive map-based web apps that make public health information more accessible to the public. By taking advantage of the Sweet for ArcGIS web editing solution, for example, the organisation is managing an up-to-date map, showing the boundaries for all 942 GP surgeries in Scotland.
All this is just the tip of the iceberg. “We are starting to develop further ambitions around the use of spatial and exploring how we can use ArcGIS to underpin even more of what we do,” says Andrew Gasiorowski, Principal Information Development Manager and GIS Lead at Public Health Scotland.
Our ArcGIS Insights tool for track and trace allows us to analyse data that is incredibly complex and show change over time, which is proving so useful for the effective management of coronavirus clusters.
Andrew Gasiorowski - Principal Information Development Manager and GIS Lead, Public Health Scotland
The Benefits
Clear communication in a public health crisis
Public Health Scotland was able to use ArcGIS Dashboards to make authoritative and up-to-date data about COVID-19 cases available to the general public in a format that was clear and easy to understand. “Displaying information on a map helps people to understand it without large amounts of explanation,” Gasiorowski says. “People could use the maps on the dashboard to understand the implications of the virus in their own localities and see differences between local authority areas in Scotland.”
Improved management of disease outbreaks
The Connections tool developed using ArcGIS Insights makes it far easier for Public Health Scotland to monitor the spread of COVID-19 and manage outbreaks. The solution is so significant to the success of the battle against COVID-19 that it was presented to the Scottish Health Minister soon after it was launched. “Our ArcGIS Insights tool for track and trace allows us to analyse data that is incredibly complex and show change over time, which is proving so useful for the effective management of coronavirus clusters,” Gasiorowski explains.
Healthcare where healthcare is needed most
Critically, Public Health Scotland is using ArcGIS to help NHS Scotland make better informed decisions about where to base new services to deliver good patient outcomes. For example, it analysed historical information on the journeys that gastroenterology patients in Grampian made to access medical care. It is now using this information to understand how many miles of travel could potentially be saved for patients by using tele-health services or relocating services. “If we know where people are and where the health issues are, we can better target health interventions to improve patients’ health and wellbeing,” Gasiorowski says.
More accessible public health information
Through a variety of projects, Public Health Scotland is improving access to public health information for healthcare professionals and the general public. For example, Public Health Scotland is developing a web app to provide live information on where in the world infections like malaria and yellow fever are prevalent. This solution will save so much time for GP practices, as they will have instant access to the latest advice about which vaccinations people need when visiting countries around the world.

Sheffield City Council
Our decision to appoint Esri UK to host and manage our GIS systems and data has paved the way for us to improve GIS services for employees and the general public.
As part of a new ‘cloud-first’ IT strategy, Sheffield City Council migrated its ArcGIS systems to Esri UK’s Managed Services. Now, GIS apps are performing faster, employees are working more productively and the GIS team is empowered to innovate.
New GIS architecture set up in the cloud within one month of procurement
All legacy ArcGIS services and apps upgraded and brought into support
Managed Services contract includes annual updates, support and quarterly reviews
The Challenge
Geographic information system (GIS) technology is deeply embedded in the way that Sheffield City Council delivers services for the population of around 584,850 people who call Sheffield home. GIS is used to help the council fulfil its statutory duties, in areas such as maintaining rights of way; it is used to help the council allocate resources based on an improved understanding of citizen needs in different parts of the city; and it is used by the general public to find information about council services and make the council aware of issues such as faulty street lighting.
For many years, the management and maintenance of the infrastructure and systems providing these essential GIS services was the responsibility of an outsourced IT provider. The council had a small in-house GIS team but it struggled to introduce new solutions and update existing GIS applications quickly. When the council decided to adopt a new ‘cloud first’ IT strategy and move all its IT systems away from the outsourced IT provider, the GIS team was presented with an ideal opportunity for change.
“Moving to Esri UK’s Managed Service has enabled us get data and evidence into more areas of the council, where it can be used to help us deliver services more efficiently and engage with the public in more interesting ways.”
Anne Tetley, Geographic Information Strategy Officer, Sheffield City Council
The Solution
Sheffield City Council started looking for a cloud-based GIS solution and, as it had been using Esri’s ArcGIS technology for nearly a decade, it approached Esri UK for information about its Managed Services. “It didn’t take us a long time to decide to stay with Esri,” recalls Anne Tetley, Geographic Information Strategy Officer at Sheffield City Council. “Esri UK offered a really great opportunity for us to have GIS experts managing our preferred GIS software for us.”
Sheffield City Council’s in-house IT team was under a lot of pressure at that time, as it needed to migrate a large number of on-premise IT systems away from the outsourced provider simultaneously. The council was, therefore, delighted when Esri UK got all of the GIS architecture up and running in the cloud within just a month of procurement. “It was amazing,” Tetley says. “Esri UK’s professionalism and efficiency was really appreciated given the complexity that the IT team was dealing with at the time.”
The migration to the cloud took place in the nick of time, as the COVID-19 pandemic emerged just weeks later. Using the new solution, the GIS team set up hundreds of new user accounts rapidly, enabling employees to access data and GIS services from home during lockdowns. “We were able to very quickly deploy new web apps and remote desktops – something that was very much appreciated by teams across the council,” Tetley explains.
The Esri UK Managed Service complies with government-recommended standards such as Cyber Essentials and was procured through the G-Cloud Framework. “We know we can trust Esri UK to keep our systems and data secure,” Tetley says. “I have been really impressed by the knowledge of the Esri UK team and by how quickly they have responded to our queries.”
“Esri UK’s Managed Services take the burden of application support away from our new in-house IT function and give us the reassurance of having our GIS applications managed to agreed performance KPIs and nationally approved security standards.”
Anne Tetley, Geographic Information Strategy Officer, Sheffield City Council
Benefits
An enhanced user experience
Following the migration to Esri UK’s Managed Services, users at Sheffield City Council have been able to work more productively. The council’s highways records team, for example, can now perform tasks more quickly thanks to the improved performance of ArcGIS and simplified data sharing. “Map projects that used to take 15-20 minutes to open now open in less than 20 seconds,” Tetley reports. “This has hugely improved the user experience and, in turn, improved the general perception and adoption of GIS within the council.”
Unfettered access to the latest GIS technology
Whereas previously Sheffield City Council had access to some ArcGIS solutions via its outsourced IT provider, the organisation now has access to the full suite of ArcGIS technology. This means that it has been able to use ArcGIS Portal for the first time to share data and apps internally in a far more logical and accessible way. It has also begun to use Story Maps and has expanded the use of geospatial data analysis throughout the council to support evidence-based policy making. According to Tetley: “Moving to Esri UK’s Managed Service has enabled us get data and evidence into more areas of the council, where it can be used to help us deliver services more efficiently and engage with the public in more interesting ways.”
Agile development of innovative GIS apps
The move to a hosted GIS system has empowered and inspired the council’s small in-house GIS team to create innovative new apps and GIS services, more quickly. In the past, it could have taken as long as four days for a requested application change to be actioned due to over-complicated workflows. Now, Tetley and her colleagues can develop, adapt and deploy apps themselves on demand. She exclaims, “It used to be so frustrating! Now, though, things that used to take days just take minutes.”
Simplified system support responsibilities
Under the terms of the Managed Services agreement, Esri UK will update the council’s ArcGIS software annually and review performance quarterly, simplifying system support responsibilities for the council’s IT team. “Esri UK’s Managed Services take the burden of application support away from our new in-house IT function and give us the reassurance of having our GIS applications managed to agreed performance KPIs and nationally approved security standards,” Tetley says.

KSN Energy
We have invested in ArcGIS within the field and on our desktops to inspect contractors' work, track quality control trends and contribute to the success of government energy-saving programmes.
KSN Energy uses ArcGIS on rooftops, in attics and on factory floors throughout Ireland to verify the quality of products installed under a variety of government-backed sustainable energy programmes. The company can now more intelligently assign inspectors to jobs, collect more accurate data and operate more efficiently to increase revenue.
ArcGIS Survey123 allows inspectors to complete complex surveys and gather accurate data on mobile devices
ArcGIS Workforce enables employees to be allocated to jobs based on location, job type, qualifications needed and priority
ArcGIS Dashboards reveal trends in quality control issues and improve the management of service level agreements
The Challenge
KSN Energy inspects newly installed heating systems, insulation, solar panels and other grant- funded energy-saving measures to ensure that they have been implemented in compliance with industry guidelines and regulations. With the introduction of a number of smaller grant-funded schemes and pilot programs, the company began to support the development of new inspection processes that did not benefit from digital assistance. These supplementary projects quickly increased from 10-12 site visits per year to over a thousand, posing two major challenges.
KSN Energy's primary goal was to find a way to convert highly complex paper-based surveys into mobile, digital operations. Second, a more efficient method of assigning Engineers with the necessary qualifications to inspections was required. “When we saw a demonstration of Esri's ArcGIS, we realised it could solve both of these challenges,” says David Cadwallader, Communications Manager at KSN Energy.
ArcGIS is a truly innovative technology that we are thrilled to be implementing across the organisation.
Michael Slevin – Director, KSN Energy
The Solution
KSN Energy started with ArcGIS Survey123, creating a few digital survey forms for internal use. Convinced that this versatile geographic information system (GIS) could meet its requirements, KSN Energy then hired Esri Ireland experts to help the company modernise its client-facing inspection process.
The task was not easy. The new Survey123 app had to not only support long and complex inspection surveys, but it also had to run on multiple devices and be usable in cramped, dark spaces like attics, roofs and factories. “The expertise of Esri Ireland experts helped us get to where we wanted to go,” Cadwallader says. “They were able to think outside the box, which was essential in this situation.”
Subsequently, KSN Energy and Esri Ireland used ArcGIS Workforce to develop a job management platform for assigning work to inspectors based on their location, credentials and survey type. The software uses priority settings and due dates to better control which jobs are completed and when and how many assignments of various schemes are assigned to each inspector. KSN Energy currently uses this work management platform to allocate jobs across all of the 10+ energy schemes that it handles, not just those that use Survey123.
KSN Energy has also begun using ArcGIS Dashboards to see the status of several sustainable energy initiatives at a glance. Internal dashboards provide employees with a clear view of how many inspections have been completed in a given week, month or year, as well as show trends in survey data. External dashboards provide clients with real-time, interactive updates on the status of inspections, allowing KSN Energy to reassure programme management that service level agreements (SLAs) are being met.
“Utilising ArcGIS across KSN Energy has meant that all staff are now aware of the status of all projects; our team can tailor reports for clients and management; and we have reduced our carbon footprint because we no longer use paper for reporting because everything is stored on the cloud,” says KSN Energy Director, Michael Slevin. “ArcGIS is a truly innovative technology that we are thrilled to be implementing across the organisation.”
Because we are better able to manage our resources across all schemes, we anticipate being able to complete more tasks and, as a result, increase our revenues.
David Cadwallader - Communications Manager, KSN Energy
The Benefits
Revenue growth from more effective job scheduling
For the first time, KSN Energy’s scheduler can see all jobs across all schemes on one map, making it easier for her to organise jobs spatially to optimise efficiency. The company can arrange large and small, domestic and commercial jobs, while providing all employees with the opportunity to meet specific goals and receive bonuses. “Because we are better able to manage our resources across all schemes, we anticipate being able to complete more work and, as a result, enhance our revenues,” Cadwallader adds.
Annual time savings of 2,000+ hours
KSN Energy's use of ArcGIS has resulted in significant time savings in areas such as task scheduling, report production, field surveying and data sharing with clients. Cadwallader emphasizes that “the option to generate custom reports directly from Survey123 has been a big time saver. It saves two or more hours per day for each of the four programmes we handle with Survey123, amounting to more than 2,000 hours per year. What was formerly a time-consuming operation is now as simple as clicking a button.”
Accurate survey data, gathered easily in the field
Using Survey123, inspectors can now collect accurate data far more easily than using paper-based survey forms. Photographs may be quickly linked to surveys; color-coded menus clearly highlight which elements of the survey remain unfinished; and a summary verification screen allows inspectors to double-check the quality of the information they have submitted. “Our inspectors' feedback has been unanimously positive,” says Quality Assurance Auditor Ian Donnelly. “We also have faith in the statistics because we know the inspectors went through a rigorous survey process.”
Clear visibility of recurring quality control concerns
KSN Energy now has the capacity to examine and analyse data in new ways, as well as discover reoccurring quality control issues, thanks to the development of ArcGIS Dashboards. It can, for example, detect recurring errors in the installation of individual measures and then offer specific training to improve the quality of future installations. Cadwallader observes that “ArcGIS makes it easy to spot trends that were always there but are now clearer.”
Department of Agriculture, Environment and Rural Affairs
The veterinary process for investigating and managing TB in Northern Ireland is now significantly more efficient, enabling DAERA to provide a high quality service for farmers.
The Veterinary Service Animal Health Group within DAERA has completely transformed its animal disease investigation process, swapping paper forms on clipboards for field-based survey apps and online dashboards. Using its new digital workflows, DAERA can now respond more quickly to disease outbreaks and instigate the most appropriate measures to prevent the spread of disease.
Animal Health and Welfare Inspectors collect epidemiological and spatial evidence at infected farms using ArcGIS Survey123
Veterinary staff view biosecurity & risk assessment scores and contiguous premises on a database available on ArcGIS web map apps
Managers monitor the progress of inspections and review risk summaries and patterns on an ArcGIS Dashboard
The Challenge
In more than thirty years, the animal disease investigation process in Northern Ireland had changed very little. The farm maps used by Animal Health and Welfare Inspectors during farm visits were still printed out on paper, taken out into fields in all weathers and annotated on farmhouse kitchen tables. In addition, a vast amount of data, on everything from the locations of diseased animals to the presence of badger sets and the number of neighbouring farms, was collected manually in paper-based forms on clipboards and written up into reports later. The whole approach was resource intensive, inefficient and in urgent need of digital transformation.
We transformed the data collection process – from clipboard to dashboard.
Alan Clements – Veterinary Officer, Veterinary Service and Animal Health Group, DAERA
The Solution
The Veterinary Service Animal Health Group (VSAHG), a business area of the Department of Agriculture, Environment and Rural Affairs (DAERA), appointed Esri Ireland to help it modernise the disease investigation process. Throughout the project, Esri Ireland worked closely with Veterinary Officers and DAERA’s internal GIS team, passing on knowledge of how to optimise the use of the ArcGIS solutions available to DAERA through its Enterprise Agreement. Esri Ireland helped to capture business requirements and build a suite of ArcGIS web apps resulting in field-based solutions and dashboards.
Animal Health and Welfare Inspectors now use ArcGIS Survey123 on iPads to gather evidence to investigate outbreaks of Tuberculosis (TB). This interactive, digital, form-based survey replaces 6-page, paper-based questionnaires and automatically generates a biosecurity score for each farm, based on a pre-determined weighting of numerous farm practices. It also generates a risk score for each separate parcel location, based on a pre-determined weighting of know hazards. Another Survey123 workflow has been developed to survey hygiene practices in meat processing plants, and further similar mobile data capture solutions are planned, including one for managing outbreaks of Avian Influenza as a template for other Epizootic Diseases.
All data collected in the field is instantly uploaded to ArcGIS Enterprise, known internally as the DAERA Information Hub, and shared via ArcGIS web apps. For example, veterinary staff use a web app to view TB surveys and access all the information they need to make decisions about any follow-up actions to limit the spread of disease. They can use the web app to search by herd number or by location, view TB reports in pop-up boxes and export data into reports. A similar web app displays the locations of avian influenza outbreaks, making it easy for veterinary staff and other stakeholders to see where cases have been detected and which farms are within designated surveillance areas. A public external viewer is now available for poultry keepers to see the detail of all Control Zones and Trade Restriction Areas on the DAERA website.
Finally, information on the progress of inspections is displayed in ArcGIS Dashboards. Managers can see, at a glance, how many TB risk assessments have been completed, what the level of risk is and how many further inspections are outstanding. Common sources of infection and the important hazards can now be easily quantified, and the ArcGIS Dashboard provides easy access to all the information managers need to manage TB inspections across the whole of Northern Ireland. “We have transformed the data collection process – from clipboard to dashboard,” says Alan Clements a Veterinary Officer in the Veterinary Service and Animal Health Group. “We shall soon be adding farm maps using the ArcGIS Collector app, allowing digital annotation of relevant spatial risks.
The use of ArcGIS moves risk assessments away from opinion and towards impartial evidence.
Alan Clements - Veterinary Officer, Veterinary Service and Animal Health Group, DAERA
The Benefits
Faster animal disease interventions
The end-to-end process, from surveying a farm to evaluating the data collected, determining follow-up actions and arranging interventions, can now be completed far faster than before. The ArcGIS web apps provide veterinary staff with instant access to all the information they need to make their professional judgements more quickly and ensure the most appropriate action is taken to halt the spread of disease in Northern Ireland.
More efficient farm inspections
Animal Health and Welfare Inspectors no longer have to write up their reports and don’t have to spend as much time travelling to and from the office to collect printed maps or to deliver reports. Consequently, they can work far more efficiently and complete significantly more inspections in the same amount of time.
Consistent assessment of animal health risks
The new ArcGIS-based survey method allows animal health risks to be recorded and weighted in a standardised way. DAERA policies can then be applied fairly and consistently across all farms throughout Northern Ireland, without regional variations. As Clements observes, “The use of ArcGIS moves risk assessments away from opinion and towards impartial evidence. This evidence based approach is a more solid base for TB policy decisions.”
Clear visibility of ‘the bigger picture’
The new ArcGIS-driven process for disease investigations enables the Veterinary Service and Animal Health Group to see what Clements calls “the bigger picture.” Managers can use the ArcGIS dashboard to better manage and monitor the work of over 100 inspectors working across the whole of Northern Ireland. Meanwhile, veterinary staff can use ArcGIS web apps to access data on up to 6,000 TB inspections per year, as well as outbreaks of Avian Influenza, and better understand animal health risks.

Transport for West Midlands
Esri’s ArcGIS Dashboard enables us to share live and crowd-sourced data with the police and 17 partner organisations so that we can all work together to minimise congestion and improve the quality of journeys by road, rail, bus and tram.
In a highly ambitious and collaborative project, Transport for West Midlands has developed a state-of-the-art ArcGIS Dashboard that combines live transport data from 17 public and private sector partners with crowd-sourced information. Using this dashboard, the organisation, its partners and the police can now intervene quickly to minimise the impact of congestion, improve journey experiences and support the growth of the local economy.
Esri’s ArcGIS Dashboard provides a single, real-time view of all transport issues across the road, rail, bus and tram networks
The transport duty managers and partner organisations have instant access to real-time and crowd-sourced data to help them make fast decisions
The ArcGIS solution was developed in just two months and is now being extended to incorporate added functionality
The Challenge
In the West Midlands, a booming economy and a rapidly growing population are placing unprecedented pressure on public transportation services and the local road network. £4.4 billion is currently being invested in the region on a range of road, tram, bus and rail network improvements, which are expected to alleviate this congestion in the future. However, in the interim, construction traffic and building works for new rail stations and tram services are creating added disruption and exasperating the challenges.
In line with its strategy to create ‘Movement for Growth’, Transport for West Midlands (TfWM) wanted to help local authorities, public transport operators, Highways England and the police to better manage planned and unplanned transportation network disruptions. It aimed to support growth in the local economy, by making it easier for people and goods to move around the area.
“Our dashboard gives us the real-time and analytical information we need to improve movement throughout the region and support economic growth, by enabling a proactive response to the causes of congestion.”
Stuart Lester, Data Insights Manager, Transport for West Midlands
The Solution
TfWM used Esri’s ArcGIS Dashboard to bring together real-time transport data from seventeen local partners, including local authorities, commercial rail, tram and bus operators, Network Rail and Highways England. The organisation then used ArcGIS GeoEvent Server and FME Workbench to enhance and integrate this live data, as well as geocode railway stations and bus stops. TfWM also used the Waze Live Alerts Layer in ArcGIS to incorporate crowd-sourced data about slow-moving traffic and harvested information about disruption to tram services from Twitter.
According to Stuart Lester, Data Insights Manager at TfWM, “The development of the Esri solution was fast and agile. We had a trial version, incorporating crowd-sourced and third party data, up and running within just two months, which helped us to gain the buy-in and confidence of partners,” he says.
TfWM’s dashboard is now displayed on a huge screen at TfWM’s new Regional Transport Coordination Centre and can be viewed online by TfWM managers from any location. The dashboard is also used by partners, in their own local operations centres including, Highways England, local authorities, transport providers and emergency services, giving everyone the same comprehensive overview of the status of all transportation services and roads, across the entire region.
By continuing to leverage the capabilities of ArcGIS, TfWM is now extending the functionality of its dashboard to enable it to generate automatic alerts about transport issues for the general public, using links to Satnavs, radio and TV channels, social media and subscription-based news services. All of the live information presented in the dashboard is stored in ArcGIS, and a trial project is currently underway to analyse this data using ArcGIS Velocity tool in order to gain insight into long term transport patterns and changes in commuter behaviour.
“The dashboard will play a pivotal role when Birmingham hosts the Commonwealth Games in 2022. It will enable us to manage the impact of millions of additional visitors to the region, ensuring they have a pleasant travel experience, while minimising disruption for the people who live and work in the West Midlands every day.”
Stuart Lester, Data Insights Manager, Transport for West Midlands
Benefits
A holistic view of the entire transport network
For the first time, all local authorities, the police and transportation providers have a holistic view of all transportation issues, on roads, railways, tram and bus services, across the entire region, all on one screen. Consequently, if a delivery vehicle obstructs road traffic, or a train service is delayed, all duty managers can instantly see the issue and anticipate the impact on other local roads and alternative public transport.
Better travel experiences, across all modes of transport
With instant access to live information via the dashboard, duty managers at TfWM’s Regional Transport Coordination Centre, and other local operations centres, can react quickly to unplanned incidents, to improve the travel experience for West Midland’s 2.8 million residents. For example, they could guide partners to re-phase traffic lights to alleviate congestion on a diversion route or issue an alert to warn commuters about a cancelled train. “Travel disruptions are inevitable, but we can now intervene quickly to alleviate the situation and provide people with good quality, timely information so that they can decide when and how to travel to make best use of their time,” Lester says.
A reliable transport infrastructure for economic growth
The dashboard will help TfWM to support the local economy, by enabling it to reduce disruption from the £4.4 billion of infrastructure projects taking place in the region. In particular, it aims to make journey times more predictable, so that commercial vehicles can deliver components to just-in-time manufacturing plants on schedule, and reduce the cost of congestion for the region’s businesses, which was estimated by INRIX, in 2018, as being £994 for every driver in Birmingham. “Our dashboard gives us the real-time and analytical information we need to improve movement throughout the region and support economic growth, by enabling a proactive response to the causes of congestion,” Lester says.
Effective planning for high-profile events
The insight that TfWM will gain, over time, from analysing live traffic data will help all seventeen partners, and the police, to put effective plans in place for special events, when COVID-19 travel restrictions are relaxed and large events can take place safely again. “The dashboard will play a pivotal role when Birmingham hosts the Commonwealth Games in 2022,” says Lester. “It will enable us to manage the impact of millions of additional visitors to the region, ensuring they have a pleasant travel experience, while minimising disruption for the people who live and work in the West Midlands every day.”