Blog Archives

Fields in Trust
ArcGIS helps us demonstrate just how important it is to protect parks and green spaces for future generations
The vital importance of Britain’s green spaces was brought to the forefront of national attention during the COVID-19 lockdown. When almost all other leisure venues were closed, parks and recreation grounds provided safe places for people to exercise, enjoy the fresh air and meet others at a social distance. Fields in Trust has used ArcGIS to expose inequalities in access to green spaces and highlight the urgent need to protect these valued places for perpetuity.
Clear evidence of the growing need to protect green spaces is revealed through analysis using ArcGIS Desktop
Compelling insights into the value of green spaces are shared with stakeholders in ArcGIS web maps
Public awareness of the vital importance of green spaces is increased through the publication of ArcGIS story maps
The Challenge
Fields in Trust was founded in 1925, in the aftermath of the First World War, to create playing fields and save open spaces in congested towns and cities. Ninety five years later, the need for green spaces where people can exercise, relax and socialise is just as great as ever. The charity therefore continues to work with landowners, community groups and policy makers to instigate better protection for green spaces at both local and national level.
To help it raise awareness of why it is important to protect parks and green spaces, Fields in Trust wanted to adopt a more evidence-based approach to its work. In particular, the charity wanted to better understand how access to these spaces, close to home, varies for people across different nations and regions of Great Britain. It also wanted to be able to demonstrate the effect of changes in population meaning that more protected parks are needed to meet the needs of future generations.
“ArcGIS has given us a way to evidence the need to protect land and will help us save our parks and green spaces for future generations.”
Alison McCann, Policy Manager, Fields in Trust
The Solution
Fields in Trust now uses Esri’s ArcGIS Desktop to carry out spatial analysis of Ordnance Survey’s green space data and UK population data. Called the Green Space Index, this annual research project analyses the quantity of green space provision across nations and regions and against minimum standards. It also calculates the number of people who are not within a ten minute walk of a green space and takes into account factors such as the proportion of the available green space that is legally protected.
To present the findings of the Green Space Index, both internally and externally, Fields in Trust uses ArcGIS Online to create and publish web maps. The charity can efficiently build these interactive digital maps for specific audiences, such as a local authority, and embed additional spatial data, such as local health information, to illustrate the need for a green space in a particular locality. In the future, Fields in Trust also plans to produce further spatial analysis comparing the data from each year’s Green Space Index with the data from previous years, to create a statistical barometer of the changing outlook for green space provision in Great Britain over time.
Fields in Trust also uses ArcGIS Online to create story maps that help it convey information about its work and the Green Space Index in a format that people will find engaging and easy to understand. For example, a story map produced in May 2020 includes interactive maps that clearly show the 100 local authority areas where the provision of green space per person will reduce by more than 10% in the next 20 years if nothing is done to increase the amount of available parks and recreation grounds in these areas.
“ArcGIS enables us to present our case in a much more compelling way.”
Alison McCann, Policy Manager, Fields in Trust
Benefits
Evidence to support the case for legal protection
ArcGIS has given Fields in Trust the ability to obtain tangible evidence to strengthen its campaigns for protecting Britain’s existing green spaces. For example, the 2020 Green Space Index revealed that even if there is no loss of existing green space whatsoever, the amount of green space per person in Britain will still decline by 7.57% by 2040 due to population growth alone. “There is such high demand for development land that our parks and green spaces won’t be around for ever unless they are protected,” says Alison McCann, Policy Manager at Fields in Trust. “ArcGIS has given us a way to evidence the need to protect land and will help us save our parks and green spaces for future generations.”
Improved focus on areas of greatest need
As ArcGIS enables the green space data to be analysed, at a small geographic area, Fields in Trust can easily identify those areas of the country where interventions are most needed to help protect green spaces. For example, the 2020 Green Space Index showed that the East of England is likely to be hardest hit over the next five years with more than a 10% increase in the number of people who do not live within a ten-minute walk of a green space. “With this insight, we can focus our activities and proactively protect the green spaces where they are most needed,” McCann says.
More purposeful engagements with stakeholders
The use of ArcGIS web maps helps Fields in Trust to have more purposeful engagements with stakeholders, from local councils to national policy makers. “Being able to incorporate health indicators and other data into web maps along with our Green Space Index, and share these maps with stakeholders in a highly visual format, is incredibly powerful,” McCann says. “ArcGIS enables us to present our case in a much more compelling way.”
Successful media relations campaigns
Finally, Fields in Trust has enjoyed great success with its story maps, one of which helped to generate over 200 pieces of media coverage. “As story maps are interactive, people can explore the data themselves and see their own areas, and this makes the data more accessible,” McCann says. “Compared to a press release with a data table, a story map brings the story to life and sparks the interest of a larger number of people.”


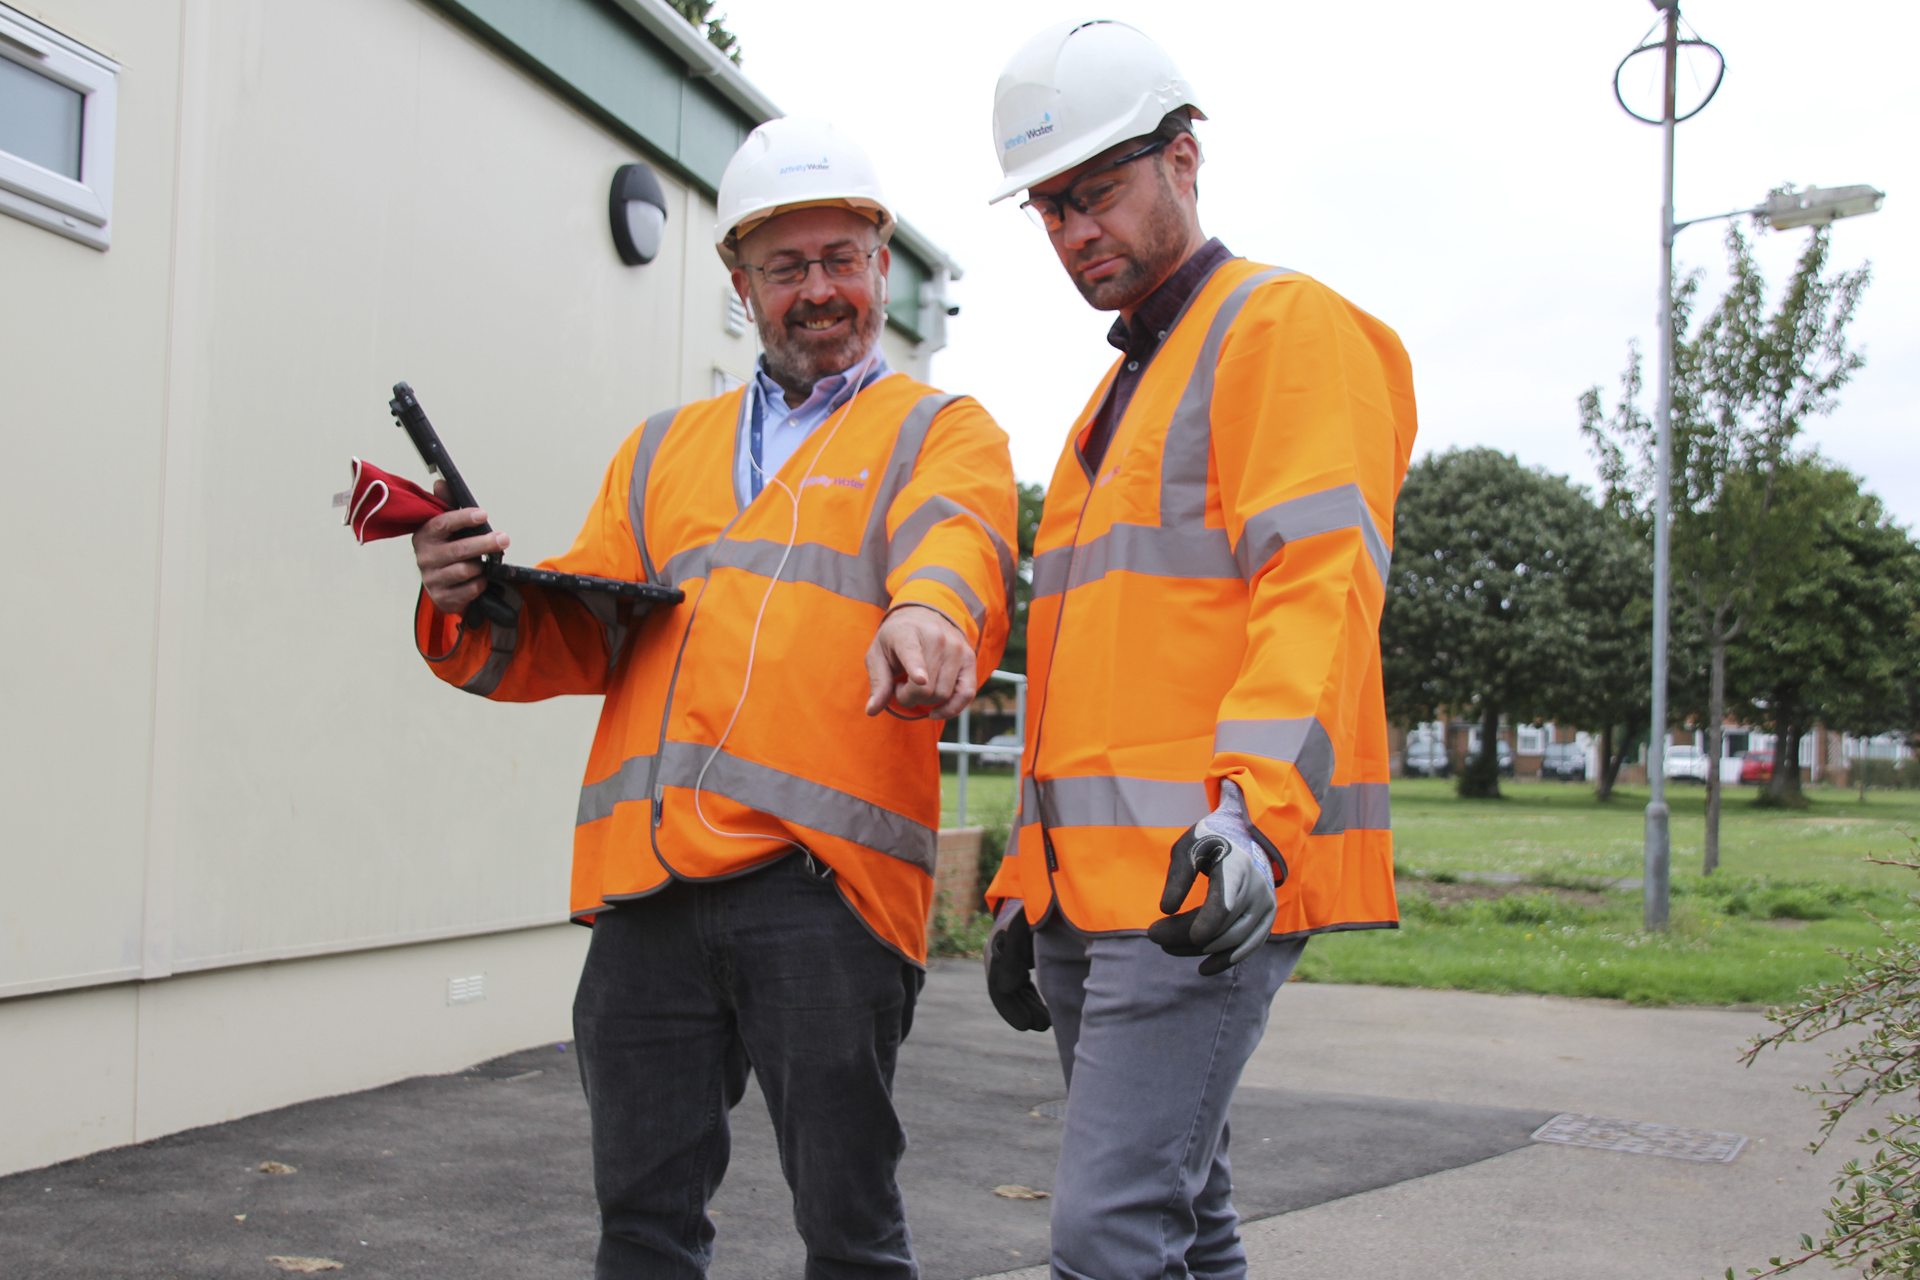
Affinity Water
ArcGIS is a key technology that is helping us to respond more quickly and effectively to water supply interruptions and leakages and deliver excellent services for customers
After achieving its industry-leading target for water leakage reduction, Affinity Water has committed to further reductions in the next five years. It now uses Esri’s ArcGIS, together with open source technologies, artificial intelligence, machine-based learning and a whole lot of ingenuity, to help it respond faster than ever before to water supply interruptions and leaks.
The network control team can respond more quickly to supply outages with instant visibility of issues
Engineers can respond more effectively and proactively to leaks, locating them within one day rather than two weeks
Call centre staff can respond more knowledgably to customers, providing better customer service
The Challenge
In July 2020, Affinity Water announced that it had achieved the most challenging five-year leakage reduction target of any water company in England and Wales and reduced leakage by 15%. Not content to stop here, it then launched an ambitious new five-year plan including targets to reduce supply interruptions by 17% and cut leakage by a further 20% by 2025. Meeting this target matters not only for ensuring future generations can continue to enjoy a reliable water supply. It is also a core part of the company’s mission to protect the local environment where water is drawn from.
To enable it to meet its key performance commitments, Affinity Water is on a path of continuous business improvement. It is investing in the latest technology to help it find and fix leaks faster than before and respond more quickly to water supply interruptions.
“The power of ArcGIS is that developers can just run with it and create these amazing tools.”
James Tyreman, Head of IT Development at Affinity Water
The Solution
Affinity Water created a browser-based application, using the ArcGIS JavaScript API and open source technology, that knits together data from legacy systems, including customer relationship management and vehicle tracking solutions, and makes it visible on interactive maps. Critically, the solution also incorporates live feeds from nearly 4,000 water flow and pressure loggers installed on the network, as well as 20,000 acoustic loggers that ‘listen’ for sounds that might indicate leaks. “ArcGIS pins all of our subsidiary systems together and gives us a geographical representation of our business information,” says James Tyreman, Head of IT Development at Affinity Water.
Known by Affinity Water as the Situational Awareness solution, this transformational system is used 24/7 by the organisation’s network control team on desktop and laptop computers and by engineers in the field on tablets. If there is a water pressure alert or a customer call, the ArcGIS map at the centre of the solution automatically zooms into the location of the issue. Employees can then click on the map to access data from other integrated systems, such as work orders for managing repairs and street plans for arranging road closures, all from the interactive ArcGIS web map. It is what Tyreman describes as “a single pane of glass” providing clear visibility into all aspects of the Affinity Water network at that precise moment in time.
Affinity Water also uses ArcGIS in combination with machine learning, artificial intelligence and its loggers to help it identify the most likely locations of leaks and bursts with a greater degree of accuracy. Rather than just relying on alerts from its loggers, it uses machine learning and artificial intelligence to analyse geospatial factors such as the directional flow of water, the location of the pipes, the contour of the ground, the soil type and the surface structure, to ‘learn’ with greater accuracy the most probable locations of a leak.
Both the Situational Awareness solution and the new GIS-embedded technique for modelling leaks were developed in-house by Affinity Water in a series of continuous improvement cycles using thorough documentation provided by Esri. “The power of ArcGIS is that developers can just run with it and create these amazing tools,” Tyreman says.
“We anticipate that our Situational Awareness solution will help us to reduce the average time that properties are without water and support us in achieving our Ofwat performance target for 2020-25.”
Sue Fenlon, Head of Control Operations, Affinity Water
Benefits
Faster responses to emergency water outages
The new ArcGIS-based Situational Awareness solution is helping Affinity Water to respond more quickly to water supply interruptions. Employees have instant visibility of all incidents, on an interactive map, as soon as they occur and can easily access all the information they need to plan the best response, all from one screen, which will enable the organisation to restore water services more quickly. “We anticipate that our Situational Awareness solution will help us to reduce the average time that properties are without water and support us in achieving our Ofwat performance target for 2020-25,” says Sue Fenlon, Head of Control Operations at Affinity Water.
Rapid and effective measures to reduce leaks
By using geospatial analysis in conjunction with artificial intelligence and machine-based learning for the first time, Affinity Water can now more accurately and more quickly identify the most likely locations of leaks within District Metred Areas (DMAs). Indeed, the organisation estimates that it has reduced the amount of time required to narrow down the search for a leak from around two weeks to one day. This time saving will help Affinity Water to operate more cost efficiently, fix leaks more promptly, reduce water loss and deliver on its commitments to reduce leakage further.
More efficient business operations
Through its combined use of both the two new ArcGIS-powered solutions, Affinity Water expects to make significant, sustainable operational efficiencies. For example, engineers can use their tablets in the field to see live pressure changes on sensors without having to call head office or perform time-consuming manual checks. In the network control team, employees can access all the information they need to plan a road closure from within the ArcGIS map, without having to access multiple different systems. Asset teams can also use the Situational Awareness tool to look back at the history of a section of network and gain insight to inform maintenance programmes.
Improved customer measure of experience
Although it is still early days, Affinity Water anticipates that its new Situational Awareness solution will help it to improve its customer satisfaction over time and, in particular, help it to achieve a positive ranking in the Ofwat Customer Measure of Experience (C-MeX). As Tyreman explains: “Our ArcGIS-based Situational Awareness solution gives us early visibility of issues, so that when customers ring, we can say exactly what we are already doing to resolve the problem and can give our customers added confidence in our ability to restore their services quickly.”

Thames Water
When unexpected weather events cause disruption to the water supply, we reply on ArcGIS to help us deliver a rapid, customer-focused response.
Extreme weather events and unexpected pipe bursts can occur anywhere, at any time, interrupting the supply of clean water for customers. Thames Water is now using ArcGIS to help it respond more quickly to these unforeseeable incidents, so that it can deliver a high standard of service for its ten million clean water customers and successfully deliver 2.7 billion litres of drinking water every day.
Live information about emerging incidents is presented visually in Esri dashboards, displayed on large screens
Interactive maps are reviewed and edited collaboratively to aid the planning of emergency responses
Event data is viewed and analysed subsequently to support continuous business improvement
The Challenge
When the ‘Beast from the East’ stalked across Southern England in February 2018, this exceptionally cold and icy weather front had a significant impact on the water network in London and the Thames Valley region. Many homes and businesses experienced interruptions to their clean water supply, and heavy snowfall impeded Thames Water’s ability to make network repairs and deliver bottles or tanks of water to customers. While water outages on this scale occur very rarely, the event made Thames Water realise the importance of being able to visualise unfolding events. It wanted to have better access to real-time information, to help it deliver a faster and more customer-focused response.
“We are continuing to identify new opportunities to expand our ArcGIS Emergency Event Management solution and deliver added value to the business.”
Jon Regan, Head of Digital and Innovation, Thames Water
The Solution
A long-term user of Esri’s ArcGIS Enterprise platform, Thames Water used the Esri Dashboard to build an Emergency Incident Management solution. Developed using an agile project methodology, the solution quickly evolved beyond the initial project scope and advanced in functionality to become a platform with three main components:
Incident Viewer – This interactive dashboard is currently displayed on three huge screens in the Thames Water control room, event coordination room and customer incident centre. When there have been six or more ‘red’ calls to the customer contact centre within any one half hour period in the same location, or a series of automated alerts from asset sensors, an incident is highlighted on the map.
Incident Manager – This solution allows managers to edit the map of an incident area to show the locations of temporary water standpipes, the proposed parking spots for water tankers and other interventions. The solution provides a detailed view of what is happening, improving communication between teams working on the ground and employees at head office.
Incident Reviewer – The third component of the solution enables Thames Water to look back at Incidents that have occurred in the past, using a time-slider tool. Managers can rewind back to a specific date, see the number and location of calls during a defined window of time, assess the risks and actions taken and use this insight to learn from previous incidents.
Thames Water subsequently enhanced the core Emergency Incident Management solution with the addition of an ArcGIS mobile app, which enables employees working in the field to record changing water levels at water stations during emergency situations or report new leaks. As soon as data is recorded in the field, this up-to-the-minute information is instantly visible to managers on the Incident Viewer dashboard. “We are continuing to identify new opportunities to expand our ArcGIS Emergency Incident Management solution and deliver added value to the business,” says Jon Regan, Head of Digital and Innovation at Thames Water.
“The Event Reviewer enables us to see in five minutes how the events of a 24 hour period unfolded and how they were managed. We can then learn a great deal about how to improve our response in the future to minimise or eliminate the impact of an unplanned event on our customers.”
Chris Davis, Incident Manager, Thames Water
Benefits
Customer-focused responses during major incidents
The Incident Viewer enables Thames Water to identify potentially serious incidents, as soon as they occur, and focus on minimising their impact on customers. The organisation can, for example, proactively contact customers to let them know by text that there is an issue in their area, significantly improving customer service. In addition, when weather-related incidents occur in different locations at the same time, as happened during the Beast from the East, incident managers can use the Incident Viewer to look holistically across the whole region, better understand how different customers are being affected and tailor responses.
Faster restoration of water supplies for customers
Using the Incident Manager solution, managers at Thames Water can make more rapid decisions during serious incidents, plan interventions more effectively and allocate resources more appropriately. This ultimately improves the efficiency of the organisation’s emergency response, enabling it to restore water supplies more quickly. Indeed, Thames Water is confident that its use of the new ArcGIS solution will help it to meet the tough new targets set by the water industry regulator Ofwat and restore customers’ clean water services within 3 hours, rather than the previous target of 4 hours.
Greater readiness for future emergencies
The Incident Reviewer solution is particularly valuable as it provides Thames Water’s managers with a simple but effective way to review past incidents and learn from them. “As part of any business resilience model, you must always be looking for ways to improve and change how things were done in the past,” explains Chris Davis, Incident Manager at Thames Water. “The Incident Reviewer enables us to see in five minutes how the events of a 24 hour period unfolded and how they were managed. We can then learn a great deal about how to improve our response in the future to minimise or eliminate the impact of an unplanned event on our customers.”
Improved collaboration with stakeholders
The new Emergency Incident Management platform not only helps different teams within Thames Water to work more effectively together; it also improves communication between Thames Water and other organisations, such as local councils. “After the Beast from the East, collaboration was identified an area for business improvement,” says Louise Bates, Platform Architect at Thames Water. “ArcGIS allows us to share information far more effectively with external stakeholders. The maps of incident areas bring the situation to life, so other organisations can easily understand what is going on and can support us.”
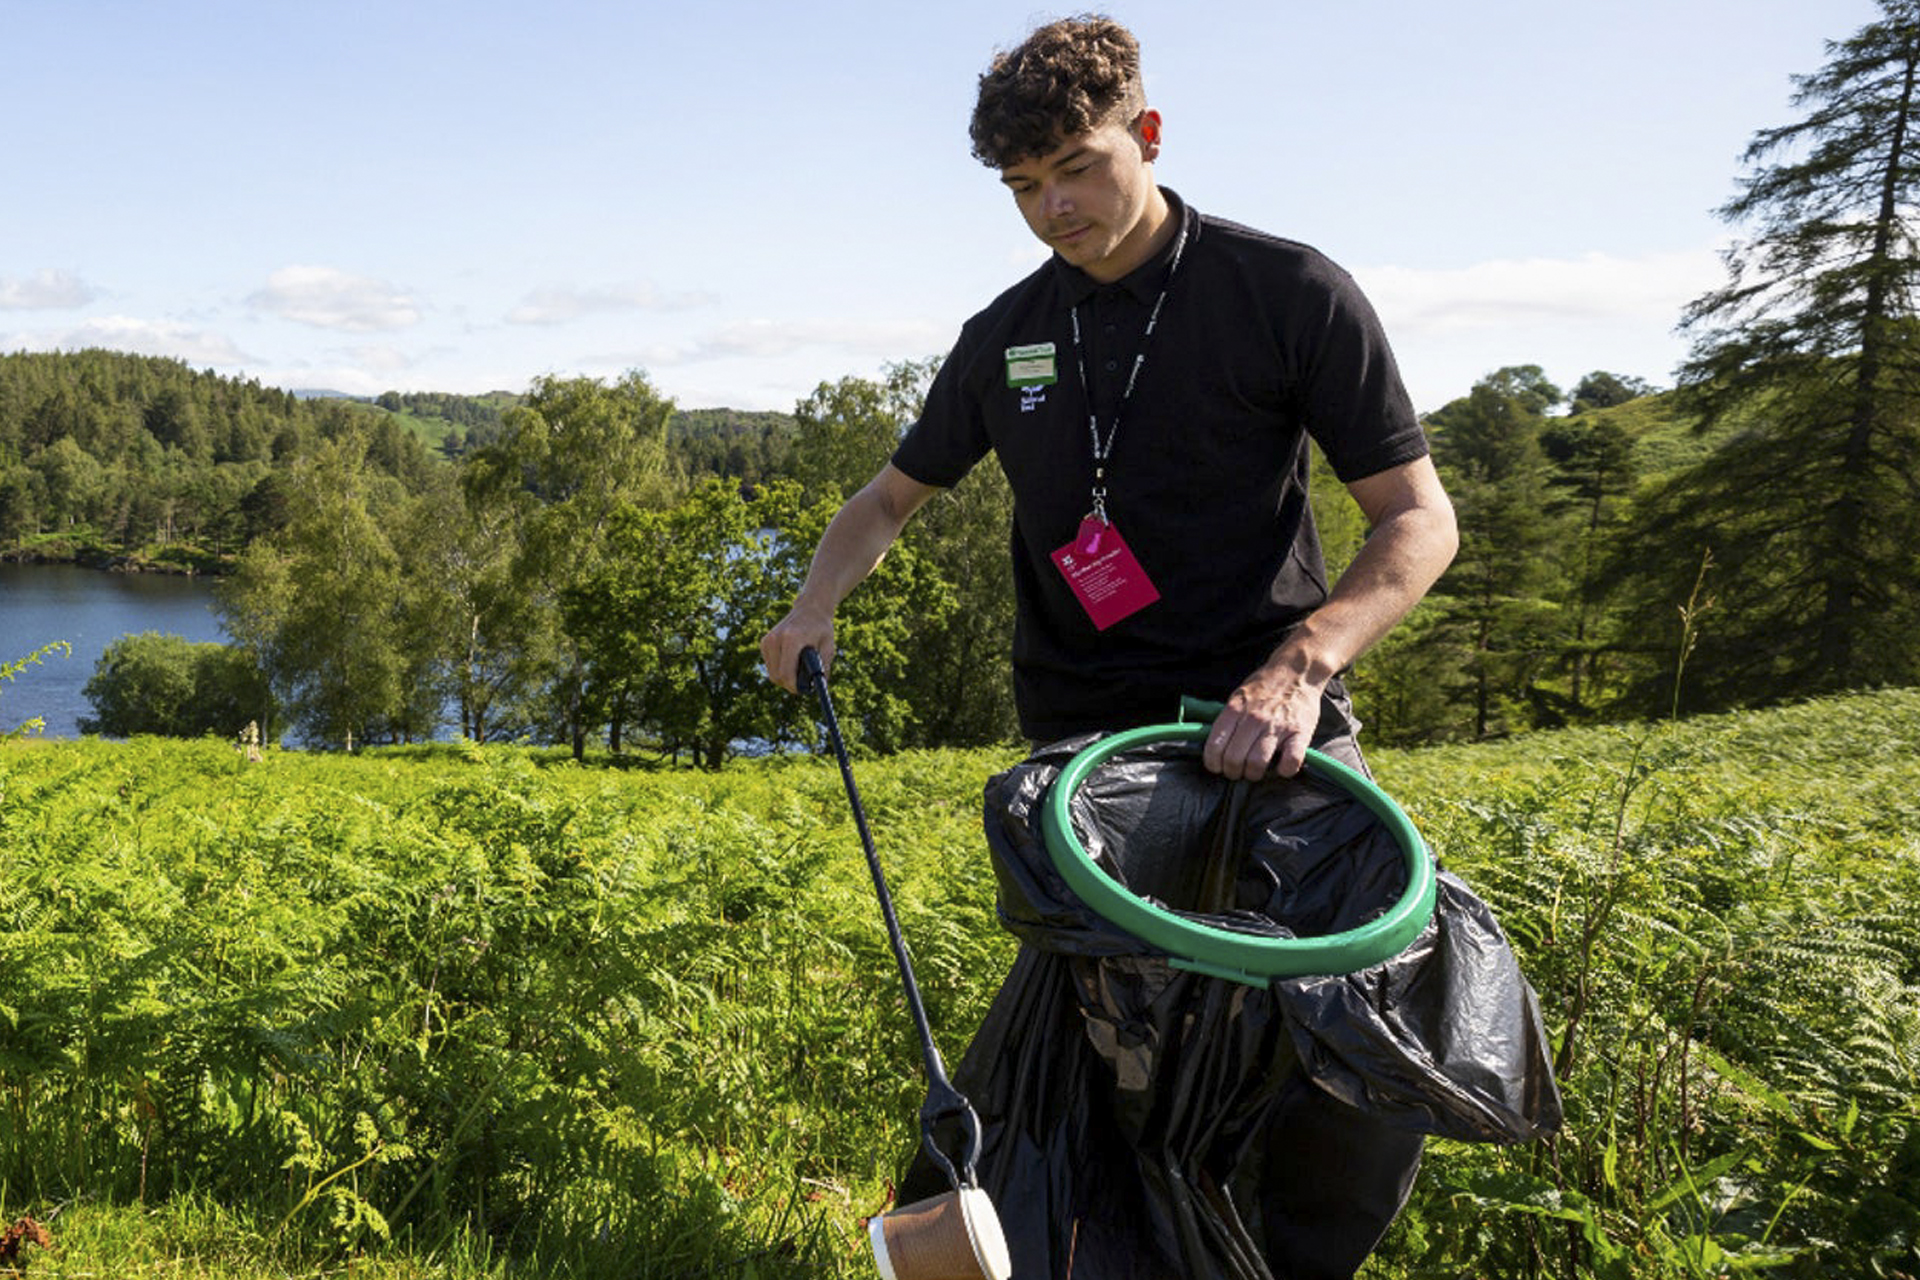
National Trust
Through a series of innovative pilot projects we are pioneering new ways to engage with volunteers and enabling more people to make a valuable contribution to our conservation work.
Volunteers play an invaluable role in helping the National Trust to protect and care for the nation’s cultural heritage and natural landscapes. The not-for-profit organisation is now embracing crowdsourcing and is using ArcGIS in a series of ground-breaking pilot projects that will enable more people to get involved and make a valuable contribution to its conservation work.
Accurate asset and conservation data can be crowdsourced by volunteers and the general public
Live conservation project data can be viewed securely online by large numbers of volunteers
Volunteers from different organisations can combine their data and share insight to aid collaboration
The Challenge
The National Trust has over 60,000 volunteers who play a vital role in helping the charity to manage 250,000 hectares of land, 778 miles of coastline, 80,000 archaeological features and 28,000 buildings. The organisation wanted to optimise the role played by this enthusiastic group and find a way to engage even more people in its activities. At the same time, it wanted to show its volunteers the value of their contribution and help them to feel more involved in conservation projects.
“Our pilots are putting crowdsourcing into practice and demonstrating how volunteering programmes can be managed more successfully in the future.”
Huw Davies, Head of Conservation, National Trust
The Solution
The National Trust is now pioneering new ways to engage with volunteers using Esri’s ArcGIS platform. In a series of pilot projects, the organisation is beginning to use ArcGIS mobile solutions, including Collector for ArcGIS and Survey123 for ArcGIS, to allow volunteers to upload information from their smartphones and tablets to a central portal. Called ArcGIS Hub Premium, this portal provides secure, authenticated identity for huge numbers of volunteers, which allows them to see the data they have collected, in the context of the wider project. Volunteers can therefore appreciate what they have done and the value of their contribution to the National Trust’s conservation schemes.
In the first of the National Trust’s pilot solutions, volunteers in the Peak District are gathering data on the condition of archaeological features on National Trust land, including barrows, ruins and ancient quarries. They are then uploading and sharing this data via ArcGIS Hub Premium, helping the National Trust to build up a clearer picture of the condition of ancient sites that are rarely visited but are nonetheless important to the history of the nation.
A second, similar pilot solution allows people to record and share information on the condition of styles, gates and steps when walking along the 25,000 km of footpaths that cross National Trust land. This app is currently being trialled by National Trust staff members, but will be rolled out to volunteers and members of the public in the near future, so that more information can be obtained to help the organisation plan footpath maintenance activities.
The National Trust has also developed a volunteering solution for a Riverlands conservation project near Manchester, which will be used by its own volunteers, as well as partner organisations and their teams of volunteers. Large numbers of people will be able to use the same ArcGIS apps to collect data on everything from biodiversity and invasive species to water quality. They will then all be able to view this data on the ArcGIS Hub Premium portal and gain a shared understanding of the conservation challenges along the river valley.
“ArcGIS Hub Premium will allow individual volunteers to see the emergence of critical conservation issues and appreciate the importance of their contribution to the project.”
Huw Davies, Head of Conservation, National Trust
Benefits
A positive experience of volunteering with the National Trust
When these pilot projects are fully implemented they will help the National Trust to provide a more engaging experience for visitors and volunteers. It will be far easier for volunteers to collect data on their mobile devices than on paper and, using ArcGIS Hub Premium, they will be able to see the data they have collected and understand the bigger picture. Huw Davies, Head of Conservation at the National Trust explains, “ArcGIS Hub Premium will allow individual volunteers to see the emergence of critical conservation issues and appreciate the importance of their contribution to the project.”
An effective way to engage larger numbers of volunteers
The rollout of ArcGIS volunteering apps will eventually help the National Trust to significantly expand its volunteer base. For the first time, students, families and corporate groups will be able to play a role in conservation activities on a casual basis, without having to commit a minimum amount of time or apply through the National Trust’s formal volunteer application process. For example, the National Trust is currently planning a new pilot project for litter collections on beaches, which will eventually enable the organisation to crowdsource data from the general public, significantly increasing the number of people who can support its coastal conservation projects.
Well-informed decisions about conservation and maintenance
Over time, the use of the new ArcGIS volunteering apps will enable the National Trust to collect a larger quantity of high quality data, which it can use to support its decision making. In particular, the organisation anticipates that volunteers will be able to help it build up a far more comprehensive picture of the condition of assets and habitats, such as signs and ponds. It can then use this information to see where it should prioritise its conservation activities and how best to plan effective, proactive maintenance programmes.
More successful collaborative conservation projects
Although it is still early days, the National Trust already recognises that ArcGIS Hub Premium is a highly effective tool for improving collaboration with large numbers of volunteers and partners. In initiatives such as the Riverlands project near Manchester, the organisation expects ArcGIS Hub Premium to play a pivotal role in enabling large numbers of people to share data and work together. “It feels exciting,” Davies says. “Our pilots are putting crowdsourcing into practice and demonstrating how volunteering programmes can be managed more successfully in the future.”

Thirteen
ArcGIS completely removed a daunting IT systems integration challenge and gave us the platform we needed to create a cost efficient, sustainable and customer-focused business.
Initially daunted by the challenge of integrating data from multiple systems, the housing association Thirteen discovered that Esri’s ArcGIS provided a simple solution. It has developed a suite of ArcGIS apps to deliver business insight directly to employees and has successfully transformed its cost efficiency, financial sustainability and customer services.
ArcGIS web apps put customer data at the fingertips of neighbourhood teams on mobile devices
An Esri Operations Dashboard allows managers to make better decisions to improve asset performance
Collector for ArcGIS enables employees to gather and share up-to-date data in the field
The Challenge
When four housing associations came together in July 2017 to establish Thirteen, the newly founded company found itself faced with the enormous challenge of managing thirty seven separate IT systems. Data about the organisation’s 70,000 customers and 34,000 properties was spread across a myriad of databases and spreadsheets with little or no integration. Consequently, employees could not easily access the information they needed to enhance the quality of services for tenants and improve the operational efficiency of the new business.
“ArcGIS has been a game changer for us. Before, we may have had an intuition about why properties remained empty or needed repeated repairs, but now we have hard evidence.”
Mark Arnold, Senior Sustainability Manager, Thirteen
The Solution
The organisation began to investigate ways to simplify its IT landscape and integrate data from all parts of the business. “Discovering ArcGIS was a lightbulb moment,” says Mark Arnold, Senior Sustainability Manager at Thirteen. “The challenge of how to integrate data went from extremely complicated to extremely simple.”
Thirteen now has twelve different IT systems, but does not integrate them directly. Instead it has assigned a geospatial reference to all its business data and links everything together through the medium of Esri’s ArcGIS. “We can use the right systems for the business, without having to worry about integration,” Arnold says.
The organisation also streams data from external sources, such as government data on deprivation, and makes this external data, together with its own internal data, instantly available to employees through a range of ArcGIS apps. Rapidly growing in number, these bespoke solutions currently include:
- An ArcGIS web app for neighbourhood teams, allowing them to access customer information on mobile devices about everything from recent property repairs and rent arears to anti-social behaviour reports.
- An ArcGIS web app showing grounds maintenance teams the land owned (and not owned) by Thirteen and the precise locations of the hedges, grass and flower beds they need to maintain.
- Collector for ArcGIS apps enabling employees to report changes and issues, ranging from flower beds that have been grassed over to fly tipping and graffiti.
- An Esri Operations Dashboard, known as the Sustainability Modelling and Regeneration Tool (SMART), that brings together data about repair costs, property values, investments, and social and environmental factors and assigns a performance score to each property between 1 (best) and 5 (worst).
“Thirteen is making annual cost savings of £158,000, by allocating grounds maintenance staff to the right places with the right equipment.”
Mark Arnold, Senior Sustainability Manager, Thirteen
Benefits
“Game-changing” intelligence about the business
Using ArcGIS, Thirteen has been able to take information from multiple IT systems and external sources and turn it into true business intelligence. For the first time, it can clearly see how external factors such as anti-social behaviour impact on the condition of its properties and monitor property ceiling prices by street, to understand return on investment at individual properties. “ArcGIS has been a game changer for us,” Arnold says. “Before, we may have had an intuition about why properties remained empty or needed repeated repairs, but now we have hard evidence. We can see the correlation between crime, anti-social behaviour and empty properties and make smarter decisions.”
Significantly improved financial performance
The development of the SMART dashboard has given senior managers an unprecedented overview of the financial performance of Thirteen’s assets and provided a springboard for significant business improvement. “The Esri dashboard helps us make smarter decisions about where to invest to convert underperforming assets into financially sustainable ones,” Arnold explains. “When the dashboard was first launched, 10% of the organisation’s assets had a score of 4 or 5 and were therefore deemed to be underperforming; now, using this same scoring system, the number of underperforming assets has reduced to zero.”
£158,000 annual saving on grounds maintenance
Thirteen has been able to significantly reduce its ground maintenance costs, because the organisation can now see how to allocate its grounds maintenance staff and equipment more appropriately. According to Arnold, “Thirteen is making annual cost savings of £158,000, by allocating grounds maintenance staff to the right places with the right equipment. We can now be confident that we are only maintaining land owned by Thirteen and only investing in the right quantity of high-value equipment, such as ride-on lawn mowers.”
Personalised and professional customer services
Teams working in neighbourhoods from the Scottish Borders to Suffolk have data about customers at their fingertips, which they can use to deliver highly personalised and professional services for customers. They can see information on rent arrears, voids, customer satisfaction feedback, local anti-social behaviour and outstanding property repairs, all on one screen, and have more meaningful conversations with their customers as a result.
“ArcGIS gives our employees working in communities the data they need, when they need it,” Arnold adds. “We can therefore customise our services for our customers and treat each tenant as an individual person.”

Oxfordshire County Council and Oxfordshire Fire & Rescue Service
With ArcGIS we can support the provision of excellent services to our residents, while promoting equality and ensuring fairness.
With its diverse and varied population, Oxfordshire County Council aims to provide excellent services to all its residents while promoting equality and ensuring fairness. For the Council to succeed, it is working towards attaining a diverse workforce that has an awareness and understanding of the diversity and needs of all its communities, supporting its position as a Stonewall Diversity Champion.
Secure, anonymous data collection helps the Council understand the effectiveness of its services being delivered to diverse communities.
Mobile apps increase efficiency of field reporting and streamline back-office administration processes.
Enhanced reporting through dashboards make findings easy to analyse and act upon
The Challenge
Oxfordshire County Council’s GIS (Geographic Information Systems) team has an extremely broad brief to provide ICT support across the organisation, including Oxfordshire County Council’s Fire & Rescue Service. This small team assesses requirements and requests, gathers business analysis and provides user support while building interactive dashboards and web and mobile apps for internal and external use.
Fire prevention is a core function of the Fire & Rescue Service and is the way in which the Council reduces demand on its services and helps to protect its residents. Safe and Well visits are a key part of prevention work, where firefighters make visits to vulnerable residents to decrease the risk of fire in their homes.
Previously, assessment data obtained during home visits had been recorded straight onto spreadsheets, an unwieldy and time-consuming process. This also created a challenge for safeguarding purposes: LGTBQ+ data needs to be collected anonymously ensuring that individuals are not identifiable by tracking down their responses to different questions.
Furthermore, vulnerable individuals, particularly the elderly, often find it difficult to talk about their gender. A more sophisticated but simple-to-use self-service digital approach was needed, ensuring complete anonymity, while giving the Council the data it requires to ensure the services it provides to its residents is inclusive to those of all identities and sexual orientations.
“For anyone who is looking to gather metrics on the sort of communities they have and are providing services for, ArcGIS is a fantastic platform to work with, providing a secure environment for reporting and apps that protect anonymity.”
Jo Ellis, Service Delivery Officer, Oxfordshire County Council
The Solution
Under its Enterprise Licence Agreement, Oxfordshire County Council has been using Esri’s ArcGIS platform exclusively since 2017 as its corporate GIS infrastructure. This has enabled the GIS team to build out a greater number of requirements, more quickly and efficiently, and help transform service delivery.
In March 2019 the Safe and Well service went digital. Workforce for ArcGIS was used to coordinate and allocate daily visits before crews left their stations and questionnaires incorporating broader health messages from the public health team were built using Survey123 for ArcGIS. The electronic forms were filled in onsite at residents’ homes and when there was no signal or internet available, users could carry on working and save a copy of the form on their mobile device. When the devices were next connected, completed surveys were synced directly back to the database in the office so colleagues could see which assessments had been undertaken, and the data visible on a central management dashboard.
The GIS team identified the opportunity to redesign the service so that fire crews could capture information on the demographics of their service users and capture this anonymously. A separate questionnaire from the Safe & Well form was created with Survey123, for vulnerable residents to fill out themselves during their visit using the firefighter’s device. This form now collects information on age, ethnicity, religion, sexual orientation and gender identity.
Three back-end reporting apps have also been built:
The Safe & Well Administration app: an overall map view of survey outputs enabling the business support team to easily manage tasks, query datasets and export visit information requested by managers.
Equal Opportunities app: an interactive dashboard showing the output from anonymised data collected separately to the core Safe & Well questionnaire, relating to Equal Opportunities. Users can check whether the service is being accessed by diverse groups and see how different groups rate the service to ensure the Council is meeting their needs.
Safe & Well reporting app: instantly shows key statistics and data from Safe and Well visits for central reporting to senior management, with no processing time required.
“Our increasingly effective use of GIS supports so many of the Council’s services and, vitally, now helps us to understand whether these services are meeting the needs of all our communities.”
Anne Kearsley, GIS Manager, Oxfordshire County Council
Benefits
Supporting Diversity
The redesigned service demonstrates Oxfordshire County Council’s responsibility as a Stonewall Diversity Champion, committed to sexual orientation and gender identify equality. In its second year of inclusion the Council now ranks at 127 (out of 503 organisations) in the Stonewall Workplace Equality Index, compared to its previous ranking at 220 out of 445.
Secure data collection
Users can confidently collect anonymous data, securely, enabling the Council to collect vital information which ensures that the service it provides residents is inclusive to those of all identities and orientations, as well as help the organisation climb the Stonewall Workplace Equality Index.
Saving time
The use of ArcGIS apps has significantly enhanced the efficiency of reporting in the field as well as back in the office. Firefighters making home visits report that the quality of their visits and range of services offered has improved, and they feel more confident and competent in carrying out their work. The administration process has also been streamlined as admin staff no longer have to input data collected from paper-based surveys, reducing the potential for human error.
Improved reporting
Performance and productivity figures are now displayed in dashboard format which makes them easy to analyse for day-to-day management and reporting purposes, and reports can easily be shared upwards to the Senior Leadership Team as required.

Dover District Council
By modernising our event approval process with ArcGIS, we have avoided costs of £40,000, freed up hundreds of hours of staff time and improved the efficiency of our service for partners and event organisers.
In and around the busy town of Dover in Kent, there is a full and varied programme of community events, providing highly valued amenities and activities for local residents and visitors alike. Dover District Council now uses Esri’s Event Coordination app to help it approve plans for all these events, which saves staff time, improves collaboration with partners and enables the council to deliver a high quality, cost-effective public service
Up to 400 hours of administration time removed annually for Dover District Council
£40,000 saved by using ArcGIS rather than standalone event planning software
Improved collaboration with partners including the police and ambulance service
The Challenge
Every year, over 200 community events take place in Dover, Deal, Sandwich and the surrounding areas, including carnivals, regattas and festivals. Whenever a member of the public or local organisation wants to put on a new event, Dover District Council has to liaise with partners to consider requirements for road closures, health & safety measures and licensing requirements, before permission can be granted for the event to go ahead.
This event approval process used to be extremely time-consuming, as it relied on paper-based forms and emails. Dover District Council wanted to streamline the entire process, to save time not only for staff in its internal events team, but also for its partners including the police and ambulance service. The council also wanted to make the event application process easier to use for members of the public, to help it support a thriving and varied programme of events in the Dover region.
“This project is a great example of how Dover District Council has maximised the return on investment from its ArcGIS and used GIS technology to deliver improved services for citizens in the Dover area.”
Abi Robinson, Digital Services Manager, Dover District Council
The Solution
Initially, Dover District Council evaluated a specialist event planning tool, used by a neighbouring local authority. However, it then realised that it could transform its event approval process using Esri’s Events Coordination app, a web-based geographic information system (GIS) solution available as part of the Esri ArcGIS. As Dover District Council already had an Enterprise License Agreement for ArcGIS, it could implement the Esri Events Coordination app for no additional cost.
Now, using the Esri Events Coordination app:
- Applicants fill out an online form with details about their proposed event, which is automatically sent to the council’s events team
- An administrator uses an ArcGIS web app to plot the event on an interactive map, including details such as road closures required or the locations of emergency services
- An email notification is automatically sent to partners including the police with an authenticated link so they can view the proposed event in ArcGIS and make comments within map layers
- Real-time email updates are created using a data integration platform (FME) which allows data to be read from one source, manipulated and written to another source
- All stakeholders are automatically notified by email when new comments are made, enabling the partners to share concerns and easily collaborate on plans surrounding the event
- The administrator can make further changes to the map and communicate any requirements to the applicant
- When approved, the status of the event is changed to ‘approved’ and the applicant is notified
- All information relating to the event is stored in ArcGIS Online and can be reused to provide information on public websites, such as maps of road closures
- A full record of the event approval process is recorded in a single system, ArcGIS Online, providing a complete audit trail
- The council can repurpose any of the data collected to create end of year summary reports or support GDPR compliance.
“The research we did into the full capabilities of ArcGIS really paid off.”
Josh Cone, Web Developer and Analyst, Dover District Council
Benefits
Up to 400 hours of administration removed
The Esri Event Coordination app has completely transformed the council’s community event approval process, creating a fully integrated, automated workflow. Administrators no longer need to send information by email, chase up feedback from partners and collate responses, which has led to significant time savings. Indeed, the council estimates that it saves between half an hour and two hours per event, which equates to between 100 and 400 hours saved annually, based on 200 events per year.
More efficient collaboration with partners
Critically, the new process makes it far easier for the council and its partners to collaborate on plans for events. The use of the ArcGIS web app reduces the back-and-forth of emails, as everyone shares information in the same place. The ArcGIS app is also used at meetings relating to major events, during which the maps can be edited in real-time to depict decisions such as access routes and road closures. The heightened efficiency of the entire process, for all parties, is expected to lead to faster event approvals in the future.
Cost saving of £40,000 from avoided expenditure
Dover District Council was able to save around £40,000, as well as avoid a lengthy and costly tender process, by using the ArcGIS solution rather than buying a separate software package. “The research we did into the full capabilities of ArcGIS really paid off,” says Josh Cone, Web Developer and Analyst at Dover District Council. “Other local authorities in the South East of England have invested a significant amount of money in software solutions specifically for event planning, but we have been able to modernise our event approval service using our existing Esri platform at very little cost.”
Improved experience for event organisers
The new event application process is much easier for members of the public to use and keeps them up-to-date on the status of their application. The Esri solution also generates high quality event maps, which can be made available on the council’s website and through other channels to help advertise events and provide improved public information about access and road closures. “This project is a great example of how Dover District Council has maximised the return on investment from its ArcGIS and used GIS technology to deliver improved services for citizens in the Dover area,” says Abi Robinson, Digital Services Manager at Dover District Council.
LUC – Working on behalf of CPRE
ArcGIS enabled us to uncover clear evidence of the importance of England’s protected landscapes and present complex information in a format that made it really engaging and understandable for everyone.
Working on behalf of CPRE, the countryside charity, an award-winning environmental consultancy, LUC, has revealed indisputable evidence of the importance of England’s National Parks and Areas of Outstanding Natural Beauty (AONBs). LUC conducted advanced geospatial analysis with ArcGIS and created an interactive story map, which has played a pivotal role in informing the recommendations of an independent review.
30+ layers of socio-economic, environmental and transport network data analysed using ArcGIS
2,100+ views for an interactive ArcGIS story map, presenting key findings from geospatial analysis
Positive feedback from lead reviewer and panel members of independent landscapes review
The Challenge
Seventy years after legislation was first passed to protect England’s finest landscapes, the government commissioned an independent review of the country’s 10 National Parks and 34 AONBs. This review was a direct response to a commitment in the government’s 25-year Environment Plan and was led by Julian Glover and a panel of experts. It aimed to understand how to do things better, including how to connect more people with these landscapes and how to enhance biodiversity.
The Glover Review panel issued a public call for evidence, asking a range of questions about how National Parks and AONBs could be improved in the future. CPRE, the countryside charity, aimed to submit a detailed response and wanted an innovative way to communicate the value of these landscapes. It therefore appointed LUC to conduct geospatial analysis and uncover factual information that it could use to support its recommendations and have a significant impact.
“ArcGIS enabled us to delve into diverse topics and analyse over 30 layers of data to gain a far deeper understanding of issues relating to the role of England’s protected landscapes today.”
Diana Manson, Head of GIS and Visualisation, LUC
The Solution
LUC used Esri’s ArcGIS platform, including the Esri Network Analyst and Spatial Analyst tools, to investigate a wide range of societal, environmental and cultural issues relating to the National Parks and AONBs. LUC searched Esri’s Living Atlas for relevant data, used open data from government sources and its own extensive data libraries. “We put Esri's geoprocessing tools to the test with a range of national datasets,” says Diana Manson, Head of GIS and Visualisation at LUC. “ArcGIS enabled us to delve into diverse topics and analyse over 30 layers of data to gain a far deeper understanding of issues relating to the role of England’s protected landscapes today.”
As part of the project, LUC recommended presenting the ArcGIS analysis in a story map format, an idea that CPRE’s Rural Enhancement Lead, Emma Marrington, describes as “completely genius!” LUC used Esri’s ‘Cascade’ story map format to display its ArcGIS analysis in a series of maps, with short explanations of key points, and communicate its findings in a very visual way. This story map succeeded in making CPRE’s submission really stand out from the other 2,500 contributions, which were made to the landscapes review.
While the ArcGIS story map was created specifically for the review panel, it actually reached a much wider audience. Julian Glover shared the story map publically on Twitter, describing it as “brilliant and fascinating” (29 January 2019). CPRE subsequently promoted the story map in the media, gaining coverage in national newspapers and national and regional TV. During the consultation period alone, the story map was viewed over 2,100 times, with more than 200 views on a single day.
“The ArcGIS story map provided the panel with hard evidence for why there needs to be improved access to National Parks and AONBs for everyone, wherever they live.”
Emma Marrington, Rural Enhancement Lead, CPRE, the countryside charity
Benefits
Greater clarity about the role of National Parks and AONBs
The spatial analysis that LUC undertook using ArcGIS enabled CPRE to evaluate the significance of protected landscapes more precisely. For example, the ArcGIS analysis revealed that National Parks and AONBs are home to an enormous number of cultural heritage assets, including 41% of England’s Scheduled Monuments, 27% of Registered Parks and Gardens, 17% of listed buildings and 92% of World Heritage Sites (increased by the Lake District being awarded the status in 2017). This helped CPRE to demonstrate how important protected landscapes are for preserving the nation’s cultural heritage.
Strong evidence to inform recommendations
Critically, the ArcGIS analysis and story map gave the independent review panel accurate, statistical evidence that it could use to help formulate its recommendations. For example, this evidence meant that the panel could see that 36% of the population (19 million people) live more than 15 miles by road from a National Park or AONB, and almost half of people in the most deprived communities are not well-served by the current network of protected landscapes. “The ArcGIS story map provided the panel with hard evidence for why there needs to be improved access to National Parks and AONBs for everyone, wherever they live,” says Marrington. “We had very positive feedback from the review panel, saying how innovative and helpful our submission was.”
A powerful tool for raising awareness
The ArcGIS story map proved to be a very powerful tool, which has successfully raised awareness of key National Park and AONB issues with the panel, the media and the wider public. The clarity of the story map format makes it very easy for everyone to understand important issues, including who currently benefits from these landscapes and who does not have easy access. “The ArcGIS story map captures people’s imaginations and communicates something quite complicated in a visual way that everyone can access and understand,” Manson says.
Insight to inform future planning
In line with its 2020-26 strategy, CPRE is now using the insight it has gained from ArcGIS to inform its future plans. For instance, CPRE is supporting pilot projects to improve local green spaces in those areas where ArcGIS has shown that 30% or more of the population does not have easy access to National Parks and AONB. “We have far exceeded our initial goals,” Marrington says. “The ArcGIS analysis and story map have not only influenced the Glover Review, but will also influence what CPRE does in the future.”

Dŵr Cymru Welsh Water
How a spatial approach to data is helping us to enhance catchment management and deliver valuable insights, to create a more efficient business.
Welsh Water’s Catchment team has the huge responsibility of ensuring the water quality that reaches its water treatment works is of the best quality it can be, minimising the treatment it requires before being delivered to over three million customers. Driving an organisation-wide spatial and more collaborative approach to data helped the team developed the WaterSource Portal, an ArcGIS enterprise solution which is supporting a more proactive, preventative approach to catchment management.
Collaborative approach is driving more meaningful stakeholder engagement
Improved data management helps the business rapidly adapt to changing situations
Enhanced health and safety prompts support workers in remote and isolated locations
The Challenge
With an operational area covering more than half of Wales and managing 136 drinking water catchments which feed 61 Water Treatment Works, Welsh Water’s Catchment Spatial Risk Analysts play an important role in delivering wholesome and acceptable drinking water to over three million customers.
With limited land holding across these catchments, the not-for-profit water company has little or no control over how it is used. Agriculture, forestry, the use of chemicals including pesticides, fertilisers and nutrients, as well as human settlements and adverse weather conditions can all determine the quality of raw water that enters their water treatment works.
To help understand and monitor its catchment areas, the Catchment Risk Analysis team, who sit within the wider Water Services Science department, acquire data from a range of sources. Traditionally, it relied on huge amounts of data from raw water sampling, along with spot samples and field observations. In recent years the organisation has started to capture knowledge and intelligence through proactive stakeholder programmes with farmers and landowners, to better understand the root causes of deteriorating or changing raw water quality.
The team was keen to demonstrate how a spatial and more collaborative approach to managing data from a variety of sources could transform how it provides scientific evidence and advice to the Water Services team. By safeguarding raw water quality before it reaches the water treatment works, Welsh Water can avoid using additional chemicals and energy to turn it into perfect drinking water, while safeguarding the environment and protecting drinking water sources for generations to come.
“Water from catchment areas reaching our treatment works needs to be of manageable and expected quality. Where situations are often unpredictable, new means and ways of working with spatial data is critical for us in our work, so we can produce tailored web and mobile apps within hours.”
Shaun Lewis, Catchment Spatial Risk Analyst, Welsh Water
The Solution
ArcGIS has historically been used by Welsh Water primarily to consolidate its network and asset-related data. The Catchment Spatial Risk Analysts identified that, as a system of engagement, the ArcGIS platform could be used to share and manage data both internally and externally, working more collaboratively with its stakeholders across catchment areas including farmers and landowners. The team developed the WaterSource Portal, which was initially trialled in November 2018 and quickly adopted 24/7/365 as a business-critical system, taking data out of spreadsheets and sharing it online, through web services, on maps and dashboards.
Data from multiple sources is stored in its Microsoft SQL server database acting as the data store for ArcGIS Enterprise, which collates, analyses, records and manages spatial data to identify and predict issues affecting raw water quality. Portal for ArcGIS acts as the ‘one stop shop’ for the team’s GIS needs, enabling them to create, use and share maps and apps with colleagues and external stakeholders.
Survey123 helps the team to work off-line in often remote and isolated environments, capturing and incorporating data from the field, supporting the team’s ability to identify specific areas of water deterioration. For example, areas where soil erosion has resulted in extra silt in rivers, flowing into reservoirs and requiring more treatment. Working with farmers to plant trees on the sides of valleys is reducing the erosion of soil into rivers, ensuring that water reaching the drinking water treatment works is of a more manageable and expected quality.
Data from the field is now quickly visualised and summarised using Operations Dashboards, highlighting such potential causes of water deterioration and providing business intelligence to help the Water Services Science team identify solutions for smarter catchment management. As business demands evolve and conditions change, such as the impact of adverse weather conditions, the Catchment team can quickly tailor collection and visualisation apps, thanks to configurable templates in ArcGIS Enterprise.
The team used the company’s pre-existing ArcGIS Enterprise and ArcGIS Online platforms to build the WaterSource Portal, utilising out-of-the box functionality with no additional software licensing costs. The WaterSource Portal now acts as a showcase to the wider business, demonstrating how spatial analytics can provide enhanced functionalities to different user groups by taking data out of spreadsheets and sharing it online, and supporting regulatory responsibilities.
“Encouraging innovation is extremely important to Welsh Water as it allows us to remain industry-leading and keeps us relevant in an ever-changing environment. Success of the WaterSource Portal demonstrates just how much people can achieve when given the time and flexibility to innovate and challenge the status quo.”
Dr Phillippa Pearson, Head of Water Services Science, Welsh Water
Benefits
Supporting business and environmental objectives
By working more collaboratively with external stakeholders and share areas of potential concern through a geographic approach, the organisation can support better land management. As the quality of water which needs treating improves, fewer chemicals are required to reduce pollutants thereby helping to reduce operating costs, while safeguarding the environment.
Shared insights
The WaterSource Portal allows instant access to data and insights, putting powerful spatial analytics into the hands of day-to-day users across the company. Vital business intelligence for the team’s regulatory responsibilities can now be summarised in a matter of seconds.
Enhanced health and safety
Task assessment forms created in Survey123 forms have led to improved health and safety. Forms now include prompts to tell people to stop working in adverse weather conditions, reminders to accurately mark hazards on a map and further prompts asking whether the user can take any steps to make the job in hand safer.
Improved enablement
ArcGIS Enterprise enables the team to work more efficiently, more accurately, more safely and more confidently with enhanced awareness of changeable environmental conditions. The business response is more robust, and a broader user group now benefits from access to powerful spatial analytics.
Better data management
Data, from multiple internal and external sources, can be managed more efficiently and productively in ArcGIS Enterprise. Information can be stored and retrieved quickly, and forms and additional documentation such as images from the field can be attached and shared with colleagues and stakeholders.

Jacobs
The web app we have developed using ArcGIS is helping our clients to improve efficiency in their infrastructure and other major projects.
Jacobs has developed a pioneering solution for making CAD designs and other BIM data accessible in a web-based, 3D GIS environment. Used by clients including Highways England, the solution provides a single point of access to all project information and allows multi-disciplinary teams to collaborate more efficiently during large, complex projects.
Jacobs built an innovative solution to clients’ challenge using ArcGIS technology
Users save time by accessing CAD, BIM and GIS data via a single, interactive web app
Teams collaborate more effectively, with shared access to the same technical documentation
The Challenge
Jacobs is a global organisation delivering impactful solutions to some of the world’s most critical problems for thriving cities, resilient environments, mission-critical outcomes and scientific discovery. Through a wide range of technical solutions and professional services, the company helps clients succeed by developing solutions to the real-world challenges they face every day.
Many of Jacobs’ clients are tackling the toughest infrastructure and technology challenges, where large multi-disciplinary teams need to collaborate closely and share a vast amount of technical documentation in order to complete high quality projects, on schedule. The company identified that project data was often stored in different systems, making it harder for teams to find, view and interact with the data they need to enable them to work efficiently. For example, designs created in Computer-Aided Design (CAD) software packages couldn’t be easily shared, as not everyone had access to the required specialist software or the skills to use it. So, Jacobs set out to develop a web-based solution that would combine CAD files, building information modelling (BIM) data and geospatial data to create a single, interactive and 3D viewer for all project information.
“The success of our 3D GIS solution puts us at the cutting edge of GIS development.”
Lorna Sherman, GIS Analyst, Jacobs
The Solution
Jacobs’ Digital Solutions team already used Esri’s ArcGIS to deliver a range of services to clients, so it decided to leverage Esri technology in designing the new solution. The team started by creating a streamlined workflow for transforming thousands of individual CAD files and Autodesk Revit files, stored in a BIM environment, into a format suitable for publishing in a 3D geographic information system (GIS) environment.
Then, using Esri’s ArcGIS Pro and ArcGIS Enterprise, the Digital Solutions team created a 3D Viewer, allowing users to view CAD designs, BIM data and geospatial data all in one place. The solution brought together both 2D and 3D data files, allowing everything to be viewed side by side in a 3D environment for the first time. This web-based solution allows Jacobs’ clients to create a single, interactive repository for all their project data, enabling employees to explore multiple layers of project information. Users can navigate easily around different components of a design, get a better understanding of the geographic context of the project, such as the line of sight, and even explore sub-surface features.
Highways England became the first of Jacobs’ clients to use Jacobs’ 3D Viewer to see data from junctions 3-5 of the M20. Use of this pioneering solution allows project teams to zoom in on maps of the project to see 3D designs of new gantries, road signs, stairways, carriageways, verges and underpasses. Users simply click on any feature, such as a section of underground pipe or gantry, to see detailed attribute data and can use embedded Esri tools to take measurements within the app.
“By creating innovative technical solutions using ArcGIS we are helping clients improve efficiency in their projects and solve real world problems.”
Lorna Sherman, GIS Analyst, Jacobs
Benefits
Improved efficiency in complex projects
The ArcGIS-based 3D Viewer improves the efficiency of project teams by making all project data available to view and explore in one place. Employees don’t waste time looking for information across multiple different software systems and can interact with CAD, BIM and GIS data at the same time, to gain a faster understanding of complex tasks.
More effective collaboration within teams
Critically, the 3D Viewer improves collaboration within teams, by making the same information available to everyone. Team members who are not CAD experts can now access CAD files in an interactive format that they can easily view and interrogate without the need for specialist CAD software and training. “In the rapidly evolving world of BIM, collaboration is key in keeping everyone on the same track and ensuring efficient, quality outputs,” says Liam Gallagher, Jacobs Director for Digital Delivery and Head of BIM, Smart Motorways Programme. “The development of this 3D viewer will change the way project teams interact with data and one another. This is part of the bigger picture that is BIM integration on projects.”
Innovative use of GIS to solve problems
The company has successfully leveraged the latest ArcGIS technology to create a web-based app with the potential to add value for clients right around the world. “The success of our 3D GIS solution puts us at the cutting edge of GIS development,” says Lorna Sherman, GIS Analyst at Jacobs. “By creating innovative technical solutions using ArcGIS we are helping clients improve efficiency in their projects and solve real world problems.”