Blog Archives
Mines Advisory Group
ArcGIS is helping us to save lives and build better futures for communities living with the threat of danger from landmines and other unexploded ordnance
The Mines Advisory Group has removed nearly 5 million landmines and unexploded ordnance from countries around the world – but millions more remain undetected, putting communities at risk. The organisation is now using a suite of solutions from Esri’s ArcGIS platform to help clear landmines more quickly and save lives.
More lives saved, with land being cleared of unexploded ordnance more quickly
Additional land made accessible for farming, alleviating poverty in local communities
Greater safety for land clearance teams, thanks to better information about the terrain
The Challenge
The Mines Advisory Group (MAG) aims to save lives by removing the millions of landmines, booby traps and unexploded bombs that still lurk beneath the ground in countries ravaged by years of brutal war. In Cambodia, MAG has already cleared over 74,600 landmines and 224,400 items of weaponry, but the risk to human life remains immense. Undetected landmines and other abandoned explosive devices continue to kill and injure two people every week in Cambodia, deepening the poverty suffered by thousands of families by impeding their use of the land for farming.
Traditionally, teams of specialists from MAG, working on the ground in Cambodia, relied on a series of manual processes to collect, collate and share information in the field. Observations about search areas were recorded on paper and then typed into spreadsheets and reports at the base. Senior managers could not gain an overall picture of sites until the notes were collated and analysed centrally and, as a result, they were unable to make the rapid decisions required about how best to deploy resources.
Using ArcGIS, MAG can cover more ground, more quickly, enabling local communities to live safer lives, sooner
Shathel Fahs – Technical Field Manager, Team Leader, MAG
The Solution
MAG had been using Esri’s ArcGIS as a corporate geospatial information system (GIS) for many years, but the technology was used purely for recording data and generating maps. “Historically, GIS was about showing, on a map, the areas of land we had cleared,” says Greg Secomb, Global Information Systems Advisor, MAG. “We decided to start using GIS not only as a reporting tool, but also as an operational tool to help us improve our effectiveness in the field.”
Commencing in Cambodia, MAG in collaboration with HD R and D Program began to use ArcGIS Online and Collector App for ArcGIS to collect data in the field and make it instantly available to team leaders. “I know exactly where my teams are and how much ground they have cleared, without having to wait two months to get a map,” says Shathel Fahs, Technical Field Manager, Team Leader, at MAG. “It is so powerful to see the map progressing every day.”
At the same time, the organisation replaced all its paper-based reporting in the field in Cambodia with Survey123 for ArcGIS. Described by Fahs as “amazing”, this mobile survey app is used by 17 teams across the country to collect geo-referenced information on all unexploded ordnance (UXO) detected, in dual languages. The data collected is shared instantly via ArcGIS Online and is more accurate, as there is no risk of mistakes occurring during the re-typing of handwritten notes.
MAG now also uses drones in Cambodia to fly autonomously over contaminated areas and photograph the land, in high resolution. Using Esri’s Drones2Map for ArcGIS app, it then transfers these images directly to ArcGIS Online, where the information is instantly accessible to operatives working in the area. As a result, team leaders no longer have to rely on a visual assessment of the terrain, limited to the area that is within the range of their eyesight; instead they have a detailed understanding of the entire area, including beyond hills and within dense forests.
We have pioneered a new way of operating in Cambodia and are excited to roll it out to all our teams, working in over 20 other countries
Greg Secomb – Global Information Systems Advisor, MAG
Benefits
Faster clearance of deadly explosive devices
MAG is now able to clear land and remove potentially deadly devices in Cambodia more quickly, as it has a far better understanding of the terrain. For instance, the insight gained from Drone2Map for ArcGIS allows team leaders to better anticipate when and where they will need mechanical clearing machinery and other specialised resources. Team leaders can also change plans and redirect their teams spontaneously, as ArcGIS Online gives them a rapid picture of the situation on the ground. “Using ArcGIS, MAG can cover more ground, more quickly, enabling local communities to live safer lives, sooner,” Fahs says.
Activities prioritised to alleviate poverty
The use of ArcGIS is also helping MAG to alleviate poverty in Cambodia. If a stretch of land is photographed by drone and identified by ArcGIS Online as being suitable for farming, MAG can prioritise the clearance of this area. As Fahs says, “Instead of just relying on informants for local knowledge, we can identify potential agricultural land ourselves. We can see the whole picture.”
Improved safety for mine clearance teams
With more accurate and current information available at base and in the field, MAG can make better decisions to help protect workers. The organisation can view historical data on ArcGIS Online and see how many devices were found in other similar areas and the density of them. It can then use this information to gauge the likely level of threat and ensure everyone in the team is fully briefed on what kinds of devices to expect.
A more productive and efficient global organisation
ArcGIS has undoubtedly improved the efficiency of MAG’s operations in Cambodia. Indeed, five people are now each saving up to two days effort a week because they no longer need to manually enter data into spreadsheets and databases. These productivity gains will soon be multiplied, as MAG is poised to introduce the same suite of ArcGIS products throughout its entire global organisation. “We have pioneered a new way of operating in Cambodia and are excited to roll it out to all our teams, working in over 20 other countries,” Secomb says.


Greater London Authority
GLA have used Esri’s ArcGIS platform, to develop an inventive web app that will help public and private sector organisations make better investment decisions and deliver the right infrastructure to meet the needs of over 10.5 million Londoners by 2041.
The Greater London Authority (GLA) is pioneering a new, more collaborative approach to infrastructure planning to guide the long-term growth of the capital. Using Esri’s ArcGIS platform, it has developed an inventive web app that will help public and private sector organisations make better investment decisions and deliver the right infrastructure to meet the needs of over 10.5 million Londoners by 2041.
Time and cost savings for private and public organisations, as they can collaborate more effectively on joint works
Reduced road disruption leading to happier Londoners and an estimated cost saving of £4 million
Accelerated home building with utility infrastructure delivered ahead of demand
The Challenge
Based on an analysis conducted by the GLA, the number of people living in London is expected to grow by almost 2 million between 2018 and 2041, placing a significant added strain on the city’s core water, energy and transportation infrastructure. Indeed, the city will require sizeable capacity increases across its infrastructure networks, including public transport, electricity, waste processing, digital communications, recycling and other services to support the building of 66,000 new homes per year.
Recognising the need for considerable long-term investment in infrastructure in the city, London City Hall launched a new coordinated approach to infrastructure planning, called The London Infrastructure Plan 2050. The former Mayor then convened an Infrastructure Delivery Board, comprising top leaders from London’s water, energy and transport providers, as well as London borough councils, central government departments, engineers, developers and advisors. Very quickly it became clear that these infrastructure providers needed an effective way to share their long term business plans and gain better information to help them coordinate their delivery of infrastructure schemes.
We believe that use of our ArcGIS app can encourage utilities to invest ahead of demand and therefore support the delivery of the Mayor’s housing targets.
Molly Strauss, Senior Policy and Programme Officer, Greater London Authority
The Solution
The GLA is a long-standing user of geographic information system (GIS) solutions from Esri UK. Using Esri’s ArcGIS Online and the Esri JavaScript API, the organisation built a prototype app for infrastructure planning in London, known as the GLA Infrastructure Mapping Application (IMA), with support from Esri UK’s Professional Services team. The GLA continued to refine and build on the solution over several months and then, on 1st August 2017, it launched Version 2.0, a more sophisticated and user-friendly solution.
The app brings together future investment data on everything from new housing and schools to sewerage and rail services, and shows it alongside relevant contextual data on population growth and, increasingly, capacity requirements. As a result, users can easily see where infrastructure and development is planned—to help them identify opportunities for coordination and evaluate where additional infrastructure investment is needed—in a highly visual map-based format. The app is available in two versions: one limited to infrastructure providers and the public sector, and another for members of the public.
Molly Strauss, Senior Policy and Programme Officer at GLA, says, “Our Infrastructure Mapping Application represents a major step forward in integrating disparate data sets from industry and the public sector in London. In the first four months alone, the app generated nearly 9,000 page views.”
Were our ArcGIS-based app to reduce road congestion from planned works on the TfL network by just 1% over one year, the GLA has estimated that the cost savings due to avoiding delay would be in excess of £4 million
Molly Strauss, Senior Policy and Programme Officer, Greater London Authority
The Benefits
Time and cost efficiencies from joined-up project delivery
The GLA anticipates that the private and public sector organisations involved in delivering new infrastructure in London will make time and costs efficiencies, in the medium and long term, through more joined-up project planning. For instance, a water utility can see where and when a new rail tunnel is being dug – many years in advance – and potentially plan to upgrade a nearby water main in conjunction, generating cost savings. Similarly, gas and electricity providers can see if they are making infrastructure improvements in the same area, in a similar time period, and make plans to share labour and materials to reduce costs.
Reduced road disruption and associated costs
Using the GLA IMA, organisations can collaborate more closely to minimise road disruption for Londoners. For instance, two utility companies can better coordinate the timing of works so that they both operate on the same street at the same time, reducing the need for repeat road closures. This is not only good news for Londoners; it also leads to significant cost savings, as Strauss explains. “Were our ArcGIS-based app to reduce road congestion from planned works on the TfL network by just 1% over one year, the GLA has estimated that the cost savings due to avoiding delay would be in excess of £4 million.”
The right investments, ahead of demand
For the first time, utilities and transportation providers in London can easily see the locations of planned new housing, public sector and commercial developments and make the informed investment plans to ensure that the necessary services are ready before they are needed. For example, a water utility can see if large-scale growth is expected in an area where there is limited capacity in its water drainage network and plan appropriately to extend it. “We believe that use of our ArcGIS app can encourage utilities to invest ahead of demand and therefore support the delivery of the Mayor’s housing targets,” Strauss says.
Better outcomes for Londoners
Finally, the use of the GLA IMA contributes greatly to better long-term decision making in London. The public sector, utilities, transportation providers, developers and engineers are able to plan ahead based on improved knowledge of population growth, housing developments, new schools, existing infrastructure constraints and planned infrastructure investments. “The result of all of this is better outcomes for Londoners,” Strauss says. “With the development of our ArcGIS app, we are helping the public and private sector to work together more effectively to help create the necessary infrastructure for the new homes, jobs and services that Londoners need.”


Avon & Somerset Constabulary
When we put our police and community liaison officers on the beat, we can be confident that our beats have been designed effectively to best meet the needs of the people we serve.
In a ground-breaking project, Avon and Somerset Constabulary has used Esri UK’s Sweet to transform the way in which it designs its beats, based on a deeper understanding of the needs of individual communities. It can now make more well-informed decisions and implement beat changes more quickly to improve the effectiveness of its Neighbourhood Policing Teams.
15 days of police time saved, every time a beat is changed, typically four or more times a year
Design and consultation process for new beats reduced from 6 months to 1 month
Beats can be changed more frequently to meet the evolving needs of communities
The Challenge
Avon and Somerset Constabulary divides its region into 121 tightly defined territories known as beats, where dedicated Neighbourhood Policing Teams engage with the local community on the streets, in neighbourhood meetings and at schools. Three or four times a year, the organisation needs to adjust the shape of its beats to optimise the allocation of police officers and ensure its resources are directed to the areas where they can most benefit local communities.
The process for redesigning, agreeing and implementing beat changes was incredibly complex. Police officers used to mark their proposed changes on paper maps, which were then passed between local teams and the force’s geographic information system (GIS) manager until a final version was agreed. Following ward boundary alterations in Bristol, it took Avon and Somerset Constabulary six months to agree changes to beats in the city, which caused unnecessary delays and consumed a significant amount of staff time that could have been better spent delivering more valuable policing services.
The beat is right at the heart of community policing, so we have to get this right. Sweet enables us to adapt our beats and meet the needs of communities in a more agile way.
Olivia Powell – GIS Manager, Avon and Somerset Constabulary.
The Solution
A long-time user of Esri’s ArcGIS platform, Avon and Somerset Constabulary discovered the solution to its challenge at Esri UK’s Annual User Conference, when Esri UK’s new application, Sweet, was introduced. Soon afterwards, the organisation used Sweet to develop a proof of concept for beat management and then built the solution in just four days with support from Esri UK’s professional services team.
Once fully rolled out, local policing teams will be able to use Sweet to view current beat boundaries, model changes and see the potential impacts of changes on population size, numbers of crimes and anti-social behaviour incidents and crime types. They can then share their proposed beat models with colleagues via a web map, so that consensus can be gained before changes are sent to the GIS team for implementation. A key advantage of SWEET Sweet is its simple interface, which enables it to be used by non-technical police sergeants, after just a small amount of training.
Critically, the solution utilises topological rules within SWEET Sweet to ensure that new beats are created consistently in accordance with the force’s procedures and naming conventions, no matter who produces them. For instance, it is impossible for police officers to inadvertently create new beats that overlap other beats or leave ‘gaps’ not covered by beats. This ensures that beats are designed correctly from inception and reduces the need for subsequent editing.
Police officers and specialist GIS professionals in the force can now be more productive in other areas, where they can add greater value for communities.
Olivia Powell – GIS Manager, Avon and Somerset Constabulary.
The Benefits
Faster implementation of beat changes
Avon and Somerset Constabulary anticipates that its use of Sweet will significantly reduce the amount of time required to implement beat changes in its region. This is primarily because the solution allows beat boundary amendments to be delineated electronically and shared with colleagues via a web app, which accelerates the consultation process. “Using Sweet, we now expect to be able to create new beats and gain consensus on the changes in less than a month, rather than up to six months,” says Olivia Powell, GIS Manager at Avon and Somerset Constabulary.
Substantial personnel cost and time savings
The force has calculated that it can potentially save around fifteen days of personnel time for a typical beat change: three days for a police inspector, one day for a police sergeant, three days for a police analyst and eight days for a GIS specialist. In monetary terms, this time saving equates to an annual financial saving of at least £12,000 for four beat changes a year, which represents a return on investment of over 2000%. In reality, the time saving frees up highly trained police personnel to work on different projects. As Powell explains, “Police officers and specialist GIS professionals in the force can now be more productive in other areas, where they can add greater value for communities.”
Better-designed beats that reflect demand and improve efficiency
Through its use of Sweet, Avon and Somerset Constabulary will be able to make better decisions about the optimal size and shape of beats, based on an improved understanding of crime in each community and policing best practices. For instance, police officers will be able to see how a proposed change in the geographic shape of a beat might increase the level of crime in that beat and necessitate the reallocation of neighbourhood policing resources. At the same time, the topographical rules in Sweet will ensure that new beats are optimally designed to avoid situations like doughnut-shaped beats that are inefficient to police.
Greater agility in meeting the needs of citizens
Most importantly, Sweet will give Avon and Somerset Constabulary the ability to respond more effectively to the evolving needs of the communities it serves. It will be able to implement beat changes more frequently to react to changes in demand for its services and create beats that make sense to communities, rather beats that are imposed by IT systems. “The beat is right at the heart of community policing, so we have to get this right,” Powell says. “Sweet enables us to adapt our beats and meet the needs of communities in a more agile way.”

Lambeth Council
We can ensure that our Open Data meets the needs of citizens, local businesses, national government agencies and international organisations using ArcGIS Online.
The London Borough of Lambeth Council has become a pioneer of best practice in the publication of local government Open Data in the UK. Using ArcGIS Online and preconfigured Open Data templates, the council doesn’t just make Open Data available; it makes it relevant and useable for the widest possible range of people and organisations.
Council employees save weeks of effort each year by not having to respond to Freedom of Information and data requests
Citizens gain online access to council data in a map-based format that they can more easily understand
Third party organisations harvest Open Data in a wide choice of formats to suit their business needs
The Challenge
When the UK Government launched its Transparency Agenda and announced that data about public sector operations would be made ‘open’ to everyone, it unleashed an enormous technical challenge for local authorities. As Tom Brown, Geographic Information Manager at Lambeth Council says, “After years of funding cuts, we had no budget for additional on premise IT equipment or external IT services to enable us to create an Open Data system. We also lacked the technical expertise in-house to put in place a wide range of download options for citizens and third party organisations.”
To comply with the Local Government Transparency Code, the council initially just uploaded data sets to its website, all on separate web pages, which involved manually exporting and updating files. This process consumed a huge amount of time and didn’t necessarily result in the publication of data that was useful for citizens; a list of council expenditure that Lambeth Council had a mandatory requirement to publish only received a handful of views in two years. “We needed a better system for publishing Open Data that would be more cost effective and time efficient,” says Tom Brown. “Yet we also wanted to be able to publish the kinds of data that citizens would actually find helpful and present it to them, in context, in a range of formats that they could use.”
ArcGIS Online has definitely helped to push us to the forefront of the Open Data movement.
Tom Brown, Geographic Information Manager, London Borough of Lambeth Council
The Solution
Lambeth Council achieved its goals using Esri’s ArcGIS Online and pre-configured ArcGIS Online Open Data templates. As a hosted, web-based solution, ArcGIS Online requires no investment in on premise hardware, no space in the council’s data centre and no complex software configurations. Furthermore, as the council has been using Esri’s ArcGIS geographic information system (GIS) platform for many years and already has an existing ArcGIS Desktop license, it can use ArcGIS Online without any additional costs.
From the outset, Lambeth Council found it very straightforward to set up the ArcGIS Online Open Data portal and integrate it with its own website. “It is incredibly easy to add, configure and standardise metadata for each web service and I don’t have to manually export data past the council’s firewall anymore,” Brown says. “The data is also live-linked to our internal corporate data, so I don’t have to constantly update it.”
A key advantage of ArcGIS Online for Lambeth Council is that the Open Data template provides a wide range of data download options, including creating spreadsheets, integrating with multiple API codes and exporting in .kml or .shp formats. The solution also allows multiple data sets to be visualised together on the same interactive map, for the first time. These features enable Lambeth Council to cater for the data needs of a much wider range of users, from those with very low IT skills to highly experienced, technical GIS professionals.
Lambeth Council publishes more spatial Open Data than any other local authority in the UK. But it’s not just about publishing the most. Using ArcGIS Online we can also publish our data in the best range of formats to make it useful and relevant for the widest number of people.
Tom Brown, Geographic Information Manager, London Borough of Lambeth Council
The Benefits
Significant time savings within the council
The new ArcGIS Online Open Data portal has freed up a substantial amount of time for council employees, working across multiple departments. In the IT department, at least one day per week has been saved as employees no longer have to export, convert and dispatch map-based data files to external organisations such as council-appointed architects and companies maintaining traffic light systems; these organisations can self-serve the information they need themselves. When data on business rates was made available on the Open Data portal, the number of freedom of information requests made to the council reduced by 75%, significantly reducing administration time in that area.
Better information available to citizens
Rather than just viewing isolated lists of information, citizens can now view council data in the context of an interactive map and integrate it with other data to help them better understand the services available in their areas. Likewise, local groups, like residents associations, can easily access information about everything from local planning policy to refuse services, and display all pertinent data in the same format, on the same map, in a format they can understand. Lambeth Council’s new Open Data portal has also been used within the council’s call centre, enabling employees to respond to citizens’ enquiries quickly and knowledgeably, delivering a high quality of service.
Greater support for third party organisations
The ArcGIS Online Open Data portal has been extremely well received by third party organisations, which can now download council data in precisely the format they need, to integrate it into their own business systems. SAT NAV providers regularly stream data from the portal to improve the accuracy of their routing information, while small graphic design agencies can obtain free, easy access to map images to illustrate their reports. Lambeth Council’s Open Data will be automatically harvested by regional and national data hubs, like data.gov.uk, making it readily accessible to many more organisations, far beyond the boundaries of the borough.
Leadership in the advancement of Open Data
With more than 100 data sets already available via ArcGIS Online, the council has become one of the UK’s leading advocates of Open Data in local government. “Lambeth Council publishes more spatial Open Data than any other local authority in the UK,” says Brown. “But it’s not just about publishing the most. Using ArcGIS Online we can also publish our data in the best range of formats to make it useful and relevant for the widest number of people. ArcGIS Online has definitely helped to push us to the forefront of the Open Data movement.”

Sport Wales
Sport Wales has gained a far deeper insight into the distribution and accessibility of sports facilities in Wales thanks to a geospatial analysis plug-in developed by the University of South Wales.
Sport Wales has gained a far deeper insight into the distribution and accessibility of sports facilities in Wales thanks to a geospatial analysis plug-in developed by the University of South Wales. Based on Esri’s ArcGIS platform, the tool enables Sport Wales to provide the Welsh Government, local authorities and national sports governing bodies with clear evidence of where to invest to deliver health benefits for the widest number of people.
Non-technical users can perform sophisticated analyses of sports facilities in just five or six simple steps
Analysis results are displayed quickly, clearly and attractively in easy-to-interpret interactive maps
The use of floating catchment area models enables users to allow for different drive time scenarios
The Challenge
A key part of Sport Wales’ work is to increase further the number of people who participate in sport and physical recreation on a frequent and regular basis, to have a positive impact on the physical health and happiness of people living in Wales. Recognising that people are more likely to engage in regular sporting activities if they have access to facilities close to their homes, the organisation sought to gain a better understanding of where sports facilities are available and how many people could potentially use them.
There are a large number and diverse range of sports facilities throughout Wales, but many are aging and in need of investment at a time when public funding for service improvements is severely constrained. Sport Wales hoped to gain a clear insight into the potential future usage of sports facilities, to help local authorities and sports associations make informed decisions about which amenities to develop, in which locations, to benefit the largest number of people.
We can perform highly nuanced analyses with ArcGIS, quickly and easily, to gain real evidence of the best places to allocate funding to benefit the largest number of people and specific sections of communities.
Dr Jonathan Radcliffe, Senior Data and GIS Officer – Sport Wales
The Solution
The solution to this challenge was proposed and developed by Dr Mitchel Langford and Professor Gary Higgs based in the Wales Institute of Social and Economic Research, Data and Methods (WISERD) at the University of South Wales. With funding from Sport Wales as part of its Illuminate scheme, the university team created a bespoke Add-In for Esri’s ArcGIS Desktop and Network Analyst solutions to calculate the geographical accessibility of sports facilities.
Critically, the solution was designed to take users with absolutely no expertise in geographic information systems (GIS) through the analysis process in a series of simple-to-follow steps, making it possible for anyone to gain a clear, accurate understanding of the potential usage of sports facilities. The Add-In draws on Sport Wales’ own ArcGIS database of sporting facilities and uses open source Ordnance Survey road network datasets that allows the organisation to perform analysis by travel distance, age, gender and socio-economic status to different types of sporting facilities for the first time.
The development of the Add-In built on the success of previous research projects at the University of South Wales that have used ArcGIS and Floating Catchment Area models to examine spatial patterns of accessibility to a wide range of public services. The use of Floating Catchment Area analysis gives Sport Wales greater flexibility in how it analyses demand for each different category of sporting facility. For example, the maximum drive time can be adjusted for each search, as appropriate, to reflect the fact that some people may be prepared to drive further to get to a swimming pool than a gym, while people in rural areas may be more accustomed to slightly longer journeys than people in cities.
ArcGIS will help Sport Wales to ensure that sports facilities are accessible, fit-for-purpose, sustainable and in the best locations. In this way, we can play a key role in encouraging people to become more active and help to improve the health and happiness of everyone in Wales.
Dr Jonathan Radcliffe, Senior Data and GIS Officer – Sport Wales
The Benefits
Greater insight into demand for sporting facilities
The ArcGIS-based solution will not only be used by Sport Wales, but could also be used by up to 40 separate sport governing bodies, providing all these organisations with greater insight into demand for facilities. It has, for example, been used by Welsh Gymnastics, to review the gymnastics facilities available across Wales and the range of coaching levels provided at each site. The solution revealed hot spots where the provision isn’t ideal for the local population, and this evidence can now be used to inform the introduction of new gymnastics facilities in key locations.
Improved allocation of sports funding
Significantly, Sport Wales can use the ArcGIS-based tool to advise the Welsh Government about where public sector funding should be invested in sports facilities, to deliver the greatest benefit. For instance, ArcGIS analysis has shown that although the database contains attribute data for 262 bowling greens in Wales, there is relatively poor provision in those areas of South West Wales within a 15km drive distance or 20 minute drive time for some demographic groups. “We can perform highly nuanced analyses with ArcGIS, quickly and easily, to gain real evidence of the best places to allocate funding to benefit the largest number of people and specific sections of communities,” says Dr Jonathan Radcliffe, Senior Data and GIS Officer at Sport Wales.
More collaborative approaches to long-term planning
Sports Wales anticipates that the clarity of the evidence presented in ArcGIS will help public sector bodies and private organisations collaborate more effectively on the provision of sports and recreational facilities. For instance, councils will be able to easily see where facilities exist in academies and FE colleges that could potentially be opened up to the public outside of school hours, making facilities available to the wider public. In this way, the solution strongly supports the Welsh Government’s Wellbeing of Future Generations Act, important legislation that requires organisations to work together on initiatives to improve health and other social issues.
A healthier, happier nation
Although the new ArcGIS-based tool for analysing sports facilities is still in its infancy, Radcliffe anticipates that it will have a profound impact on Sport Wales’ ability to lead the maintenance, enhancement and creation of sports facilities across Wales. “ArcGIS will help Sport Wales to ensure that sports facilities are accessible, fit-for-purpose, sustainable and in the best locations,” he says. “In this way, we can play a key role in encouraging people to become more active and help to improve the health and happiness of everyone in Wales.”
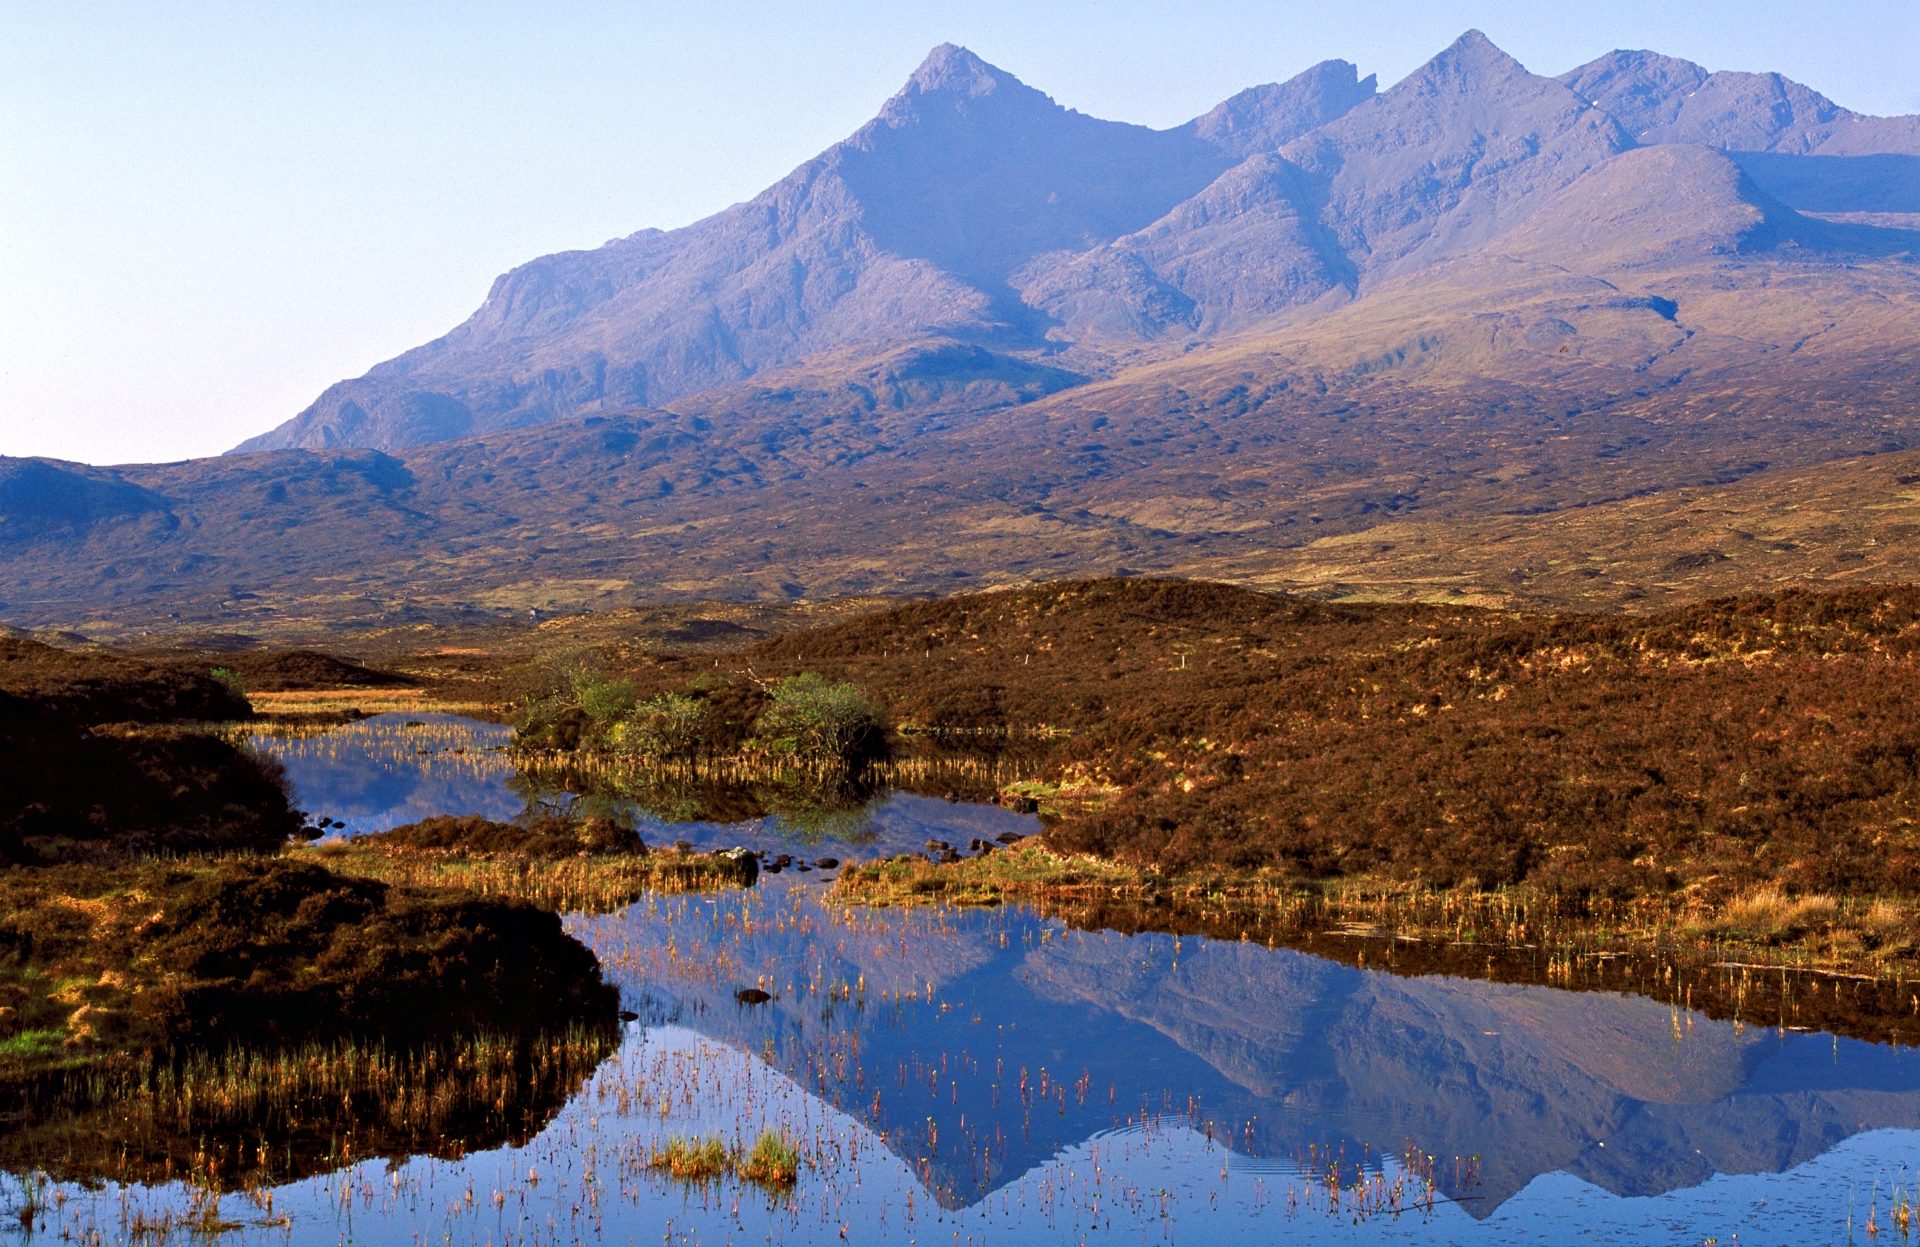
Scotland’s Coastal Change Assessment
ArcGIS shows Scotland's Coastal Change Assessment not only where coastal change has occurred in Scotland over the last century, and how quickly, but where future changes will occur and which of our infrastructure assets will be at risk.
ArcGIS shows us not only where coastal change has occurred in Scotland over the last century, and how quickly, but where future changes will occur and which of our infrastructure assets will be at risk.
Public sector organisations can collaborate more effectively with a shared understanding of coastal change
Businesses can identify risks to their property and make well-informed decisions to protect their assets
Members of the public can better understand and prepare for coastal changes in Scotland
If we had been doing this project five years ago, before ArcGIS Online, we wouldn’t have been able to be as responsive to the original vision of the project and share our coastal change insight with everyone
Lachlan Renwick – GIS Services Manager, Scottish Natural Heritage
The Challenge
While Scotland is renowned for its spectacular coastal cliffs and scenic rocky coves, 19% of the country’s 21,000 km of shoreline is formed of beaches, sand dunes and saltmarshes. Government and university experts are concerned about the potential long-term implications of climate change on these soft landforms, because they are highly susceptible to erosion, as well as accretion from the build-up of sediments along the coast.
The Scottish Government recognises the importance of the likely future impacts of climate change on Scotland’s soft coastal landscapes and joined forces with Scottish Natural Heritage (SNH) and the University of Glasgow to undertake the country’s first ever National Coastal Change Assessment. However, before researchers could begin to assess future risks, they first needed to understand what changes had taken place in the last 120 years, where they had occurred and the pace at which these changes had happened.
Ultimately the information in DynamicCoast.com helps Scotland, its businesses and communities become more resilient to climate change
Professor Jim Hansom – Principal Researcher for Dynamic Coast, University of Glasgow
The Solution
With funding from Scotland’s Centre of Expertise for Waters (CREW), researchers used Esri’s ArcGIS Desktop to analyse geo-rectified historical maps from the 1890s and 1970s alongside modern maps and LiDAR surfaces. They used over a million data points in the soft, erodible sections of the Scottish shoreline and built up a fully interactive map, enabling them to not only depict a century of coastal change, but also calculate the rate of change for every 10 metres of the soft coast. The analysis showed an increase in erosion extent of 39%, a fall in extent of accretion of 22% and a doubling of erosion rates, above historic baseline levels.
Using this evidence base, the researchers then performed sophisticated spatial analysis to identify areas likely to experience future change. They highlighted the areas of anticipated future erosion in dark red on the map and included a ten metre erosion influence area, which together includes more than 50 buildings, 5 km of roads, 2 km of railway and 2 km of water pipes that may be threatened by erosion by 2050. Over £340m of assets are at risk if erosion continues, however, in total, £13bn of assets are protected by ‘natural defences’.
Finally, the project team used Esri’s ArcGIS Online platform to share its insight into coastal erosion via an accessible web map that everyone can easily view, interrogate and understand. Called DynamicCoast.com, it enables people to browse every beach in Scotland, zoom in to view potential erosion risks at any location, using any device, whether they are at home, at work or standing on a beach. Lachlan Renwick, GIS Services Manager at Scottish Natural Heritage says, “If we had been doing this project five years ago, before ArcGIS Online, we wouldn’t have been able to be as responsive to the original vision of the project and share our coastal change insight with everyone.”
The GIS-led research approach we developed gives us accurate, statistical evidence and allows us to provide objective recommendations with confidence
Dr Alistair Rennie – Dynamic Coast Project Manager, Scottish Government
The Benefits
Firm evidence of climate change along Scotland’s coast
Using ArcGIS Desktop, researchers have gained tangible evidence about climate change, which they can use to make secure judgements about the future. “As scientists, we are all inherently cautious about making future predictions, yet as advisors we need to give advice to help the Scottish Government, businesses and citizens prepare for the future,” says Dr Alistair Rennie, Dynamic Coast Project Manager, Scottish Government. “The GIS-led research approach we developed gives us accurate, statistical evidence and allows us to provide objective recommendations with confidence.”
Improved resilience to climate change
By accessing DynamicCoast.com, the public and organisations can now easily find out how the continuance of past coastal changes may impact their property and assets and, as a result, make better informed decisions to reduce their longer term risks and costs. For instance, electricity suppliers can use the information to plan the installation of new electricity cables with more confidence, to avoid those areas where their condition and safety may be jeopardised by erosion or changing sea levels in the future. The University of Glasgow’s Prof. Jim Hansom, Principal Researcher for Dynamic Coast, says: “Ultimately the information in DynamicCoast.com helps Scotland, its businesses and communities become more resilient to climate change.”
Greater public awareness of coastal change
As the data is displayed on simple-to-use, interactive maps via ArcGIS Online, people with absolutely no prior experience of GIS can easily understand the implications of continued erosion and climate change on the areas of coastline where they live, work or visit. “For many climate change is a vague and distant topic, but everyone can now see for the first time, precisely how much change has happened and what the future impacts may be on the specific beaches they love,” Renwick says.
A collaborative response to the challenges of coastal change
The versatility of the ArcGIS platform, and the breadth of the analysis available, is the cornerstone of future collaboration between government bodies in Scotland and will lead to more joined-up responses to the challenges of coastal change. Organisations like SNH, SEPA, Historic Environment Scotland and Local Authorities can work more effectively together to assess the implications for threatened sites of historical and environmental interest and put strategies in place to protect and preserve them for future generations.
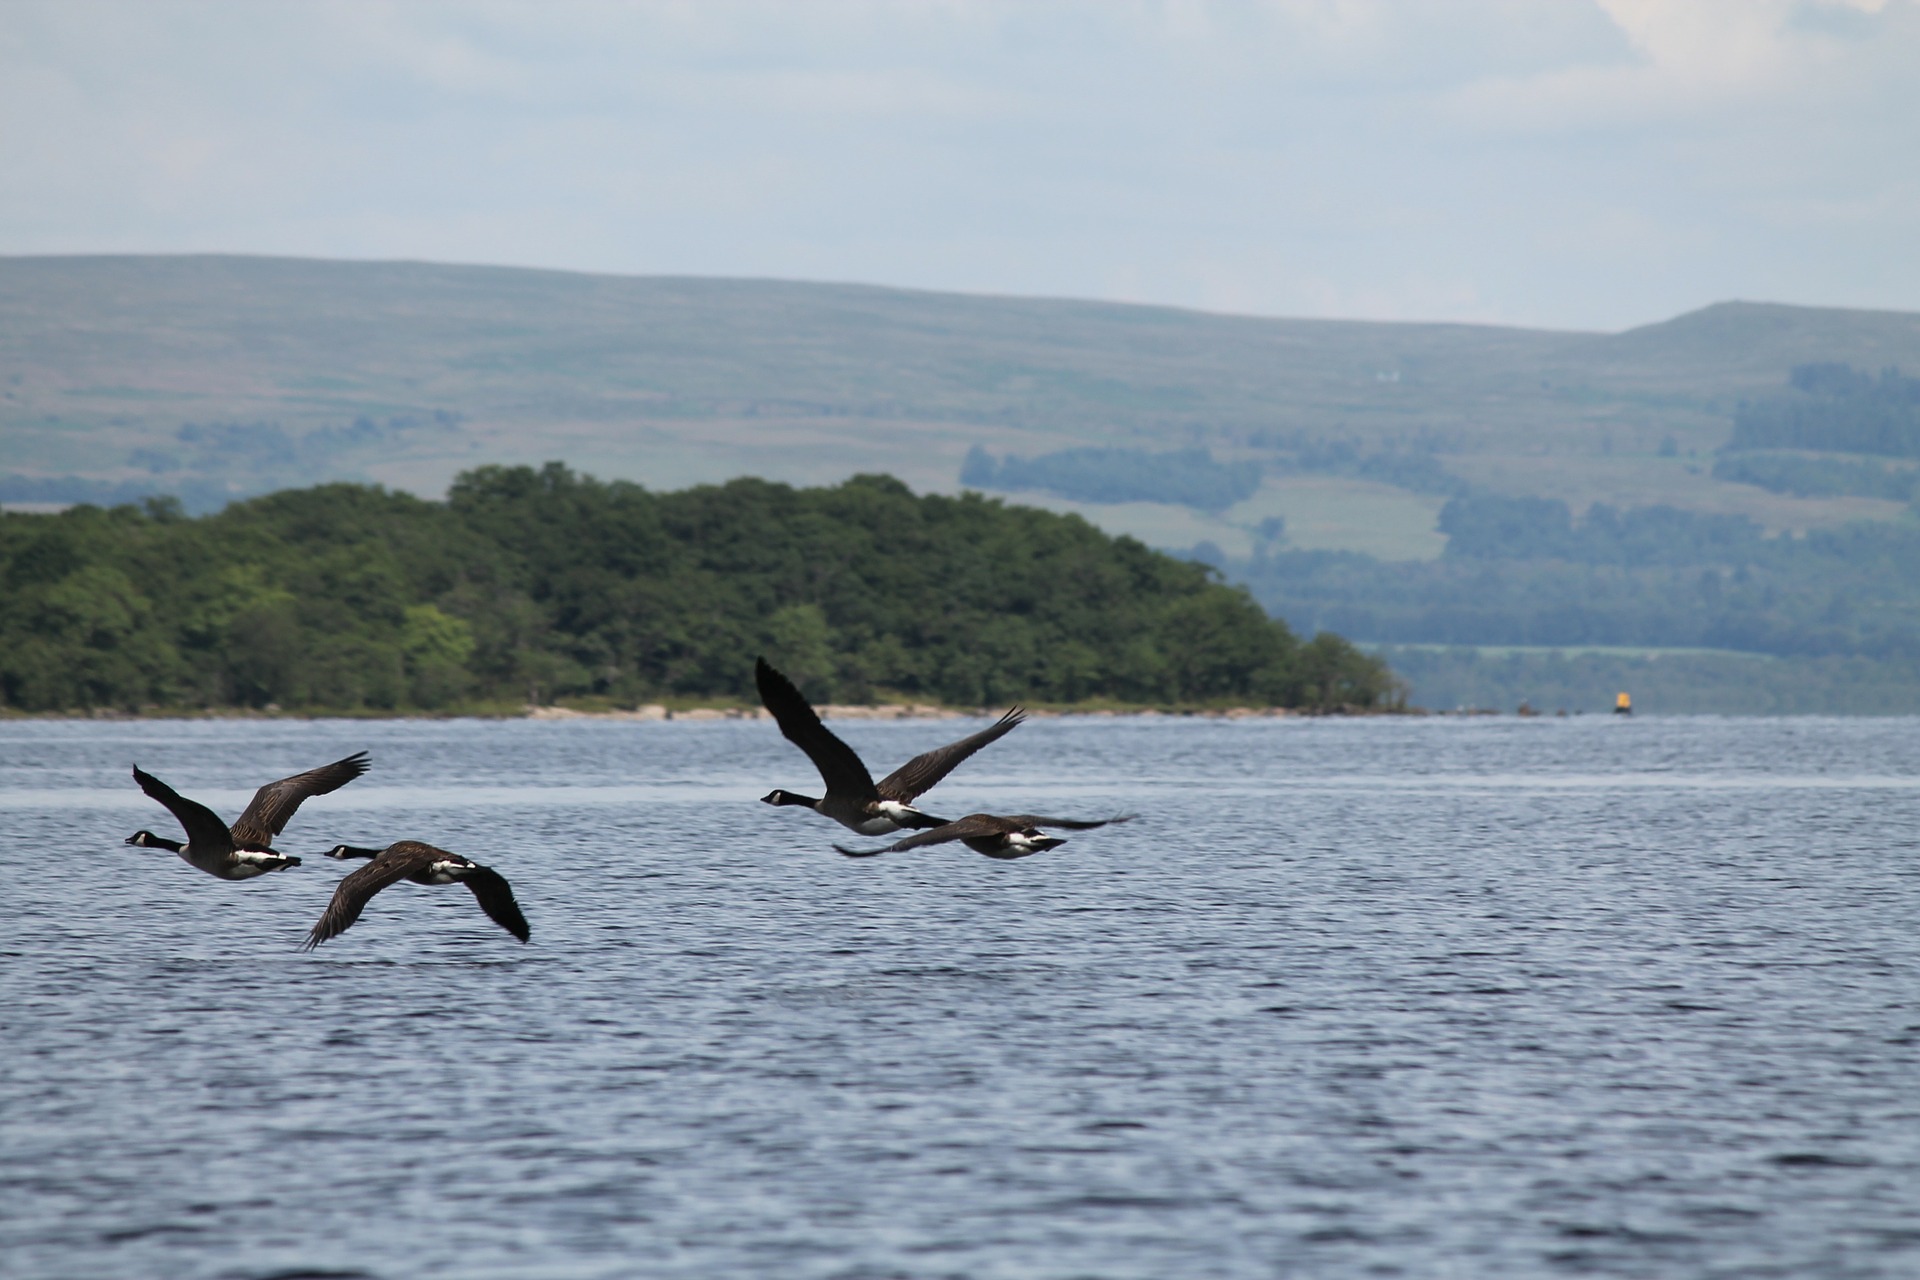
Loch Lomond
Using ArcGIS apps on tablets and smartphones, our rangers and specialists can collect more accurate data in the park to inform our vital conservation and maintenance programmes
In one of the most scenic regions of Scotland, a small organisation has accomplished a big transformation in the way that it records data in the field, using Esri’s ArcGIS Online platform and mobile GIS apps. Loch Lomond & The Trossachs National Park Authority can now collect better data, monitor its conservation activities more successfully and make faster interventions to protect and enhance this popular national park.
Improved customer satisfaction with 50% fewer call centre calls relating to failures in grounds maintenance
Projected cost savings of at least 10% which can be reinvested in grounds or used to lower customer charges
68% of process steps removed or automated & weeks of effort saved in new, transparent process
The Challenge
Covering an area of 720 square miles, Loch Lomond & The Trossachs National Park comprises twenty one Munros (Scottish mountains over 3,000 feet), twenty two large lochs, two forest parks and the UK’s largest National Nature Reserve. The park authority has a responsibility to protect and conserve these outstanding natural environments, while allowing visitors to enjoy the area safely. To achieve these goals, it needs to collect a vast amount of information on everything from the locations of rare orchids to the conditions of footpaths.
Conservation specialists and park rangers used to collect data in the field on paper and then either file their notes to use in reports or input them into spreadsheets. As a consequence, the data collected in the field was inconsistent, incomplete and often inaccessible. Furthermore, the GIS team needed to spend a considerable amount of time cleaning and consolidating handwritten, printed and digital data in order to create the digital maps that the park authority needed to support its conservation planning.
The more ArcGIS mobile apps we have developed, the more opportunities we have found to use them.
Sally Newton, GIS Manager, Loch Lomond & The Trossachs National Park Authority
The Solution
Loch Lomond & The Trossachs National Park Authority had the inspiration to use GIS mobile apps to address its challenges when it gained free access to Esri’s ArcGIS Online solution and apps, as part of its license agreement with Esri UK for ArcGIS Desktop. “When we saw the Collector App for ArcGIS we immediately recognised the potential that it had for our organisation,” says Sally Newton, the park’s GIS manager. “We then went and talked with other organisations in Scotland that were using the app, and the tremendous results that they had already achieved really backed up our business case.”
Using ArcGIS Online, the Collector App for ArcGIS and Survey123 for ArcGIS, Loch Lomond & The Trossachs National Park Authority quickly created and rolled out over 12 bespoke data collection apps, for more than 30 members of staff, to support different business activities. For example, an ‘Orchid Habitats’ app allows staff to note the locations of rare orchids and complete surveys in the field to record their habitat and environment. “The more ArcGIS mobile apps we have developed, the more opportunities we have found to use them,” Newton says.
Data is entered on a variety of tablets and smartphones via dropdown boxes, making it very easy for people to collect all of the required information in a consistent format, as well as take pictures. Staff can work offline, as mobile coverage is poor in the more remote parts of the park, and upload all their data to ArcGIS Online when they reach a Wi-Fi hotspot.
Even though Loch Lomond & The Trossachs National Park Authority is a relatively small organisation, with a small number of experienced GIS professionals, it has been able to develop its new apps very quickly and easily. Francis Corbett, the park authority’s GIS systems officer, says, “Once all the planning is done, and you know which survey questions need to be answered, creating the app and setting it up in ArcGIS Online can be achieved in a few hours.”
By helping us to collect information in the field more accurately, and make it available to staff almost immediately, ArcGIS Online supports a broad range of the National Park Authority’s work including conservation, rural development and visitor experience.
Simon Jones, Director of Conservation and Visitor Operations, Loch Lomond & The Trossachs National Park Authority
The Benefits
Faster interventions to preserve the park
As the data collected no longer needs to be inputted manually, with less post-processing and cleaning, the GIS team has been able to reduce the time required to create and share digital maps by as much as four weeks, for some of the mobile GIS apps introduced. Consequently, managers within the organisation have faster access to information on critical issues – such as the current whereabouts of rare species and damage to bridges and footpaths – and can make more rapid decisions about any necessary interventions. “By helping us to collect information in the field more accurately, and make it available to staff almost immediately, ArcGIS Online supports a broad range of the National Park Authority’s work including conservation, rural development and visitor experience,” says Simon Jones, Director of Conservation and Visitor Operations at Loch Lomond & The Trossachs National Park Authority.
Improved monitoring of conservation schemes
The use of Collector App for ArcGIS helps the park authority to more precisely monitor the spread of non-native invasive species, as employees can capture their locations on digital maps simply by walking around the footprint of the invasive plants. “We can pick up changes in the distribution and spread of invasive species far more accurately with our mobile GIS apps,” says Newton. “We can also monitor the effectiveness of different types of treatment more closely, over time, which helps us to achieve targets for the reduction of invasive species.”
More cost-efficient park maintenance programs
Now that the park authority is able to collect better information about the condition of footpaths, footbridges, signs and information boards around the park, it is beginning to put new processes in place that will, in the future, improve the cost efficiency of its maintenance programs. Staff will be able to prioritise urgent repair requests and simultaneously identify other less-urgent maintenance tasks in the same vicinity, to undertake multiple nearby jobs on the same visit. As Newton says, “One of the park authority’s biggest costs is staff time, so if we can reduce repeat trips to remote areas, we can increase efficiency and reduce the number of vehicle journeys.”

Flagship Housing
We are getting it right for our customers by delivering a fast, effective and cost efficient grounds maintenance service using ArcGIS
As part of a bold strategy to in-source its grounds maintenance activities for over 22,000 homes, Flagship Group developed a fully integrated and automated grounds maintenance management system based on Esri’s ArcGIS platform. The initiative resulted in greater customer satisfaction, created significant internal efficiency gains and paved the way for an innovative new business venture.
Improved customer satisfaction with 50% fewer call centre calls relating to failures in grounds maintenance
Projected cost savings of at least 10% which can be reinvested in grounds or used to lower customer charges
68% of process steps removed or automated & weeks of effort saved in new, transparent process
The Challenge
With around 22,500 properties, Flagship Group is the largest housing association in the East of England, comprising Flagship Homes and repairs and maintenance company RFT Services. Since its inception, the organisation had relied on two or more subcontractors to carry out its grounds maintenance tasks, including mowing lawns, weeding driveways, trimming hedges and maintaining shrub beds. However, Flagship had little or no visibility of when and whether specific tasks were taking place and which areas were being routinely maintained. This lack of transparency hampered Flagship’s ability to respond quickly and effectively to customer queries relating to grounds maintenance.
Committed to delivering the highest possible quality of customer service, Flagship made the strategic decision to bring its grounds maintenance activities in-house, by expanding the remit of RFT Services and creating a new digital, integrated process for planning, implementing and managing the entire process. The immediate priority was to create a centralised source of accurate, up-to-date information on all aspects of the grounds maintenance service and make it accessible to employees across multiple departments.
Getting it right for our customers is what matters most to us at Flagship – and ArcGIS is enabling us to do exactly that.
Morgan Manricks – IT Business Intelligence Manager, Flagship Group
The Solution
Having recently acquired Esri’s ArcGIS Enterprise solution from Esri UK, Flagship Group set about developing a customised grounds maintenance solution, based on ArcGIS Server. The organisation was able to very easily integrate ArcGIS with its existing Microsoft Windows 365 applications, Microsoft SQL Server and bespoke intranet platform to create a fully integrated and automated enterprise system.
The ArcGIS-based grounds maintenance solution was launched on the day that the supplier contracts terminated and, from the outset, it transformed the grounds maintenance process, providing complete transparency into all aspects of the service. “Now, we don’t just have a picture of a strip of grass that needs to be cut; we can click on the map to immediately see when it was last cut, when its next cut is due, what it costs to cut and which customers pay for it,” says Abi Tassie, GIS Developer at Flagship Group.
Up to 180 employees have instant access to the interactive grounds maintenance map while in the office and PDF map booklets (derived from ArcGIS) while in the field. Grounds maintenance operatives use the solution to see which areas are (and are not) owned by Flagship and when they need to attend each site. The Field Management Team uses the solution to plan visits, reduce drive times and increase productivity. The Finance Team accesses cost information via automated reports, embedded within the interactive map, to calculate the grounds maintenance charge per property. Meanwhile, call handlers and housing officers access the system to resolve queries at point-of-contact, for example, when lawns will be mown or what is included in service charges.
If we had not deployed ArcGIS before in-sourcing our grounds maintenance, I’d hate to think how much time and money we would have wasted.
Matt Brazier, Director of IT, Flagship Group
The Benefits
A tangible uplift in the customer experience
Since in-sourcing its grounds maintenance activities, Flagship has been able to provide better information to customers and provide a more effective service across its 22,500 properties. Indeed, since bringing the service in-house, Flagship now receive 50% fewer calls into its contact centre relating to failures in the grounds maintenance service, while at the same time it has been delighted to receive dozens of unprompted calls from happy customers, praising the improvements to the service. “Getting it right for our customers is what matters most to us at Flagship – and ArcGIS is enabling us to do exactly that,” says Morgan Manricks, IT Business Intelligence Manager at Flagship.
10% reduction in grounds maintenance costs
Flagship has projected an annual reduction of expenditure on grounds maintenance of at least 10% by bringing the service in-house. This cost saving not only endorses the organisation’s decision to implement such wide-ranging changes in its approach to grounds maintenance, but also gives it the opportunity to improve the quality of its service.
Significant time savings from process automation
In the development of the ArcGIS-based solution for grounds maintenance, Flagship Group either removed or automated 68% of individual steps creating a far more efficient and streamlined process. The service charges team, for instance, now saves many weeks of effort every year, as it can fairly allocate grounds maintenance costs to the right customers automatically. “Having great people, using great software with great data makes life a lot easier,” says Matt Brazier, Director of IT at Flagship Group. “If we had not deployed ArcGIS before in-sourcing our grounds maintenance, I’d hate to think how much time and money we would have wasted.”
A platform for business innovation
Such has been the success of Flagship’s in-house grounds maintenance service that the business is now considering tendering for other contracts for grounds maintenance work from other organisations in its region. Tassie says, “Our automated approach based on ArcGIS allows us to do more things in the time we have available. It therefore allows us to consider innovative new business ventures that otherwise wouldn’t have been possible.”

Aster Group
One straightforward upgrade from an older Esri web solution to Esri’s Portal for ArcGIS has delivered benefits right across our entire business.
After using Esri geographic information system (GIS) solutions for over eight years, landlord and developer Aster Group decided to migrate to Esri’s Portal for ArcGIS. This upgrade has transformed the efficiency of employees across multiple departments, leading to significant improvements in customer service, supplier management and decision making.
Customers receive faster, well-informed responses to their enquiries
Employees work more efficiently and are supported on key strategic projects
Senior managers have clearer insight into information related to fire safety
The Challenge
The not-for-dividend business Aster Group is driven by the desire to ensure everyone has a home. Over the next seven years, the organisation aims to develop 10,000 new homes for sale and shared ownership, and will reinvest the profits into developing more homes for rent. It already owns and maintains over 28,000 homes across the South and South West of England and delivers services for 75,000 customers.
For over eight years, Aster Group had used Esri’s ArcGIS platform to collate, visualise and share information about all of the organisation’s homes and assets via interactive maps. This GIS had become invaluable to the business, but following a series of acquisitions and other organisational changes, Aster Group had ended up with four separate web maps, each containing different data sets. This fragmented approach sometimes made it hard for employees to find the information that they needed and prevented them from working with optimal efficiency.
ArcGIS has been vitally important to our business for many years, but now it plays an even more critical role by providing employees with easier access to the information they need to deliver quality customer services, support key strategic projects and make informed business decisions.
Roger Taylor, Assistant Director (Property Investment), Aster Group
The Solution
When Esri launched Portal for ArcGIS, Aster Group realised that if it migrated to this new solution, it could create a single, interactive map to support employees across all business teams. Moreover, the organisation discovered that it could accomplish this systems enhancement with no additional expenditure on software, as the cost of the upgrade to Portal for ArcGIS was included in its annual ArcGIS maintenance package.
Recognising the importance of GIS to the business, Aster Group decided to engage consultants from Esri UK for three days, to guide the migration to Portal for ArcGIS and pass on their expertise to the in-house GIS team. “The consultancy from Esri UK was really worthwhile,” says Luke Angwin, GIS Administrator at Aster Group. “We certainly wouldn’t be where we are today without that knowledge transfer.”
The upgrade to Portal for ArcGIS enabled Aster Group to replace its four legacy asset maps with a single, enterprise-wide system, containing a far more extensive range of data sets – up to 50 layers of information in total from internal and external sources. At the same time, the upgrade enabled Aster Group to deliver improved capabilities for users, such as simplified printing, more professional report generation and the ability to mark-up areas and boundaries on maps.
As everything is contained in one map, customer service is more straightforward now. Employees don’t have to have historical knowledge of our properties to know where to look to find answers to questions.
Luke Angwin, GIS Administrator, Aster Group
The Benefits
From what appears, on the surface, to be a relatively simple upgrade from one Esri solution to another, Aster Group has achieved some remarkable business improvements. As Roger Taylor, Assistant Director (Property Investment) at Aster Group says, “ArcGIS has been vitally important to our business for many years, but now it plays an even more critical role by providing employees with easier access to the information they need to deliver quality customer services, support key strategic projects and make informed business decisions.”
More responsive customer service
Customer service agents can now respond far more quickly to customer enquiries, such as checking if the organisation is responsible for cutting a verge in front of a house. “As everything is contained in one map, customer service is more straightforward now,” Angwin says. “Employees don’t have to have historical knowledge of our properties to know where to look to find answers to questions.”
Improved employee efficiency
Throughout the business, teams can work more efficiently, as they can perform basic GIS tasks, such as producing and printing maps for themselves. The drainage team, for example, now uses Portal for ArcGIS to mark areas, such as car parks, calculate square meterage and produce accurate request for tender documents, with maps, to send to prospective suppliers. The team no longer has to request maps from the GIS team for this purpose, which saves time and significantly accelerates the tender process for new drainage contracts.
Stronger contractor and financial management
As all of the information displayed in Portal for ArcGIS is not only up-to-date and complete, but also easy to interpret, employees can access contract maps and customer charges more effectively. The grounds maintenance team can better monitor whether contractors are meeting their contractual obligations, as contract maps can be accessed via hyperlinks embedded directly in the maps for the first time. Equally, the garages team can more easily spot discrepancies in garages classified as basic or prime, and ensure that all customers are charged appropriately for the services they receive.
Clear understanding of health and safety responsibilities
Aster Group takes its health and safety responsibilities very seriously, and through its upgrade to Portal for ArcGIS, it has been able to improve the visibility of information that is pertinent to fire safety regulations. For instance, it can now distinguish between properties that are leaseholder and freeholder, at a glance, for the first time. This distinction was particularly critical in the light of the Grenfell fire disaster, as the organisation could see instantly where it potentially had a responsibility to carry out additional fire safety checks.

National Trust
By giving us both evidence and insight, ArcGIS is helping us to enrich the biodiversity of England, Wales and Northern Ireland
One of the largest landowners in the UK, the National Trust is now playing a vital role in helping to stem the decline in Britain’s biodiversity. It is using Esri’s ArcGIS platform to identify threatened habitats on its land, implement conservation schemes and monitor the success of wide-ranging initiatives to create thriving natural environments.
High-nature habitats around the country in National Trust care are protected, improved and enlarged
Bog mosses, which make peat, are beginning to recover in degraded bogs in the Peak District
Coastal habitats will be restored so that they are better able to accommodate rising sea-levels
The Challenge
A staggering 60% of species in the UK have decreased in number over the last 50 years, and many native plants, birds and animals are at serious risk of becoming endangered. With an estate of over 250,000 hectares in England, Wales and Northern Ireland, the National Trust wanted to play a greater role in protecting and nurturing biodiversity in the UK.
As part of a new strategy, called ‘Playing Our Part’, the organisation set out to implement new approaches to land management to help restore wildlife. However, it didn’t have a comprehensive database of the many habitat types in its historic properties, monuments, countryside and coastal areas, in one centralised location. “We were engaged in managing a number of particularly important wildlife sites, with a high nature value, but didn’t have a complete picture of the biodiversity across all our land and water, all around the country,” explains Huw Davies, Head of Conservation Information at the National Trust.
For the first time in its 120-year history, the National Trust now has a single, centralised source of information about habitats on its land, which it can use to plan, prioritise, implement and monitor wildlife conservation schemes
Huw Davies – Head of Conservation Information, the National Trust
The Solution
Using Esri’s ArcGIS Server solution, the National Trust pulled together habitats data from surveys undertaken at specific properties, and at regional-level, over the previous 30 years. “For the first time in its 120-year history, the National Trust now has a single, centralised source of information about habitats on its land, which it can use to plan, prioritise, implement and monitor wildlife conservation schemes,” Davies says.
GIS specialists at the National Trust analyse the data in the habitats database, using Esri’s ArcGIS Desktop solution, and identify the best opportunities to make habitats bigger, better and more joined up. The trust can identify opportunities for habitat enhancement and enlargement, working in partnership with other landowners beyond the trust’s boundaries.
Furthermore, National Trust is now beginning to use Esri’s Collector App for ArcGIS to verify, expand and enhance its centralised habitats database. Rangers working on the land can collect habitat and biodiversity data in the field on smartphones, to monitor the evolving condition of land, water quality and habitats. All data collected in the field is synchronised with ArcGIS Server, giving the National Trust what Davies describes as “the view from the ground” and constantly putting better information back into the trust’s central systems.
ArcGIS is a pivotal tool that is helping the National Trust to identify priority habitats and then intervene appropriately to enrich and extend the biodiversity of its land
Huw Davies – Head of Conservation Information, the National Trust
Benefits
Firm evidence for prioritising conservation schemes
The new centralised habitats database gives the National Trust a firm evidence base for identifying, planning and prioritising conservation schemes. “ArcGIS is a pivotal tool that is helping the National Trust to identify priority habitats and then intervene appropriately to enrich and extend the biodiversity of its land,” Davies says. “It helps us understand where the best opportunities for nature are, so we can focus our resources in the right locations and work with partners to achieve the most positive impact on the natural environment.”
Improved implementation and monitoring of projects
ArcGIS also plays a key role during the implementation of habitat restoration programmes and in monitoring the success of the trust’s interventions. For instance, in the large tracts of degraded Blanket Bog and Upland Heathlands in the Peak District, the National Trust is using ArcGIS at the desktop and in the field to locate and block damaging drainage channels and conduct vegetation surveys. This is a particularly significant project because the organisation is responsible for 28% of England’s entire priority habitats in the uplands, and the bog mosses that decompose to make the carbon sink that is peat, are beginning to recover as a direct result.
Greater understanding of long-term threats to biodiversity
By using ArcGIS to perform detailed habitats analysis, the National Trust is gaining a far greater understanding of factors like land-use and climate change that may pose a serious, long-term risk for threatened species. For instance, the National Trust has modelled the impact of higher sea levels on its 775 miles of coastline using ArcGIS. It is now applying the intelligence it has gained to identify high-nature coastal habitats that may become changed, understand the implications for species and assess opportunities for coastal habitats to move inland.
New ways to encourage support and communicate success
In the future, the National Trust plans to make use of Esri’s ArcGIS Online to create engaging Story Maps to help it educate the general public about the threats to biodiversity and the vital importance of its conservation activities. Davies says, “Should we need to set up an appeal to help fund a scheme to protect a particular habitat type or wildlife area, we will be able to use the power of ArcGIS Online and Story Maps to do that. We will also be able to create Story Maps to demonstrate the success of our current initiatives and publicise the great work that the National Trust is doing to improve the fate of the UK’s amazing nature.”