Blog Archives
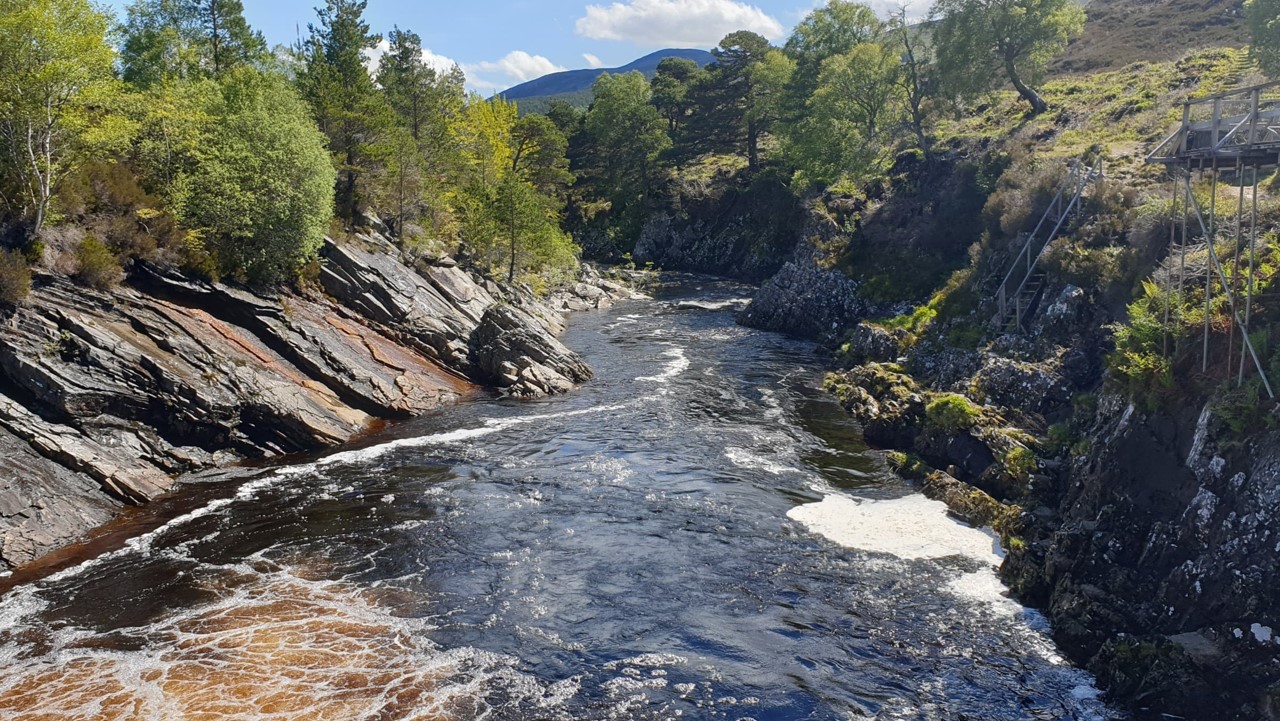
Scottish Fisheries
We are creating data and insights that didn’t exist before to help fisheries organisations work together to improve wild salmon habitats
Working with members and stakeholders, the Scottish Fisheries Coordination Centre has created the first ever national record of over 1,300 initiatives, planned across 44 fisheries districts, to improve conditions for endangered wild salmon populations. It uses ArcGIS Dashboards and ArcGIS StoryMaps to share information more dynamically, support collaboration and build up a clear understanding of the level of investment needed to make a positive impact on river habitats.
A single, centralised data set of ‘Priority Actions’ for salmon conservation was created by consolidating data in ArcGIS Pro
Detailed information on interventions planned, across the whole of Scotland, can be viewed and queried in ArcGIS Dashboards
44 static pdf fisheries management plans have been transformed into engaging apps with ArcGIS StoryMaps
The Challenge
Wild salmon populations have been in steady decline in the UK ever since 1952 and are now classified as endangered. One of the organisations that is committed to reversing this trend is the Scottish Fisheries Coordination Centre (SFCC). Part of Fisheries Management Scotland, it coordinates with a wide range of stakeholders, including rivers and fisheries trusts, district salmon fishery boards and the Scottish Government, to drive initiatives to protect salmon and other freshwater fish.
For many years, 27 organisations have been involved in producing fisheries management plans for the 44 fisheries districts in Scotland. Although these plans were produced to a standard template, they were stand-alone, static, pdf reports comprising up to 50 pages. Consequently, people working in the fisheries sector could neither gain a clear oversight of the range of initiatives needed to protect salmon populations across Scotland nor gauge the likely cost of implementing them.
“We now know the precise level of investment required to improve conditions for salmon populations, at local and national level, and can use this insight to help us attract finance from new investors.”
Sean Robertson, SFCC Manager
The Solution
SFCC already used Esri’s geographic information system (GIS) technology, ArcGIS, in many aspects of its work. With funding from Crown Estate Scotland and the Scottish Government, it embarked on a project to use ArcGIS to make the 44 fisheries management plans more dynamic and engaging, as well as create Scotland’s first ever centralised and comprehensive record of all of the intervention projects planned nationwide to help protect salmon populations.
Through workshops with key stakeholders, SFCC defined twenty categories of intervention that could be used, such as removing barriers in rivers, increasing tree planting or patrolling river segments. Then, using ArcGIS Pro, it collated information from all 44 fisheries areas and created a single nationwide dataset of all ‘priority actions’ that are in progress, planned or not possible due perhaps to access or legal restrictions.
To display this Priority Actions Data, SFCC created ArcGIS Dashboards that provide high-level overviews of the planned interventions, across the whole of Scotland. Using these dashboards, people working in the fisheries sector can see, at a glance, how many actions are needed, exactly where they are planned, how long they are due to take, what the status is and, critically, what the estimated costs are and whether they are financed.
In parallel, SFCC liaised with its member organisations and gained consensus for the traditional pdf fisheries management plans to be reimagined as story maps. It created a standard ArcGIS StoryMaps template and provided support to help members get started. Now, all 44 fisheries management plans are available as dynamic story maps, and they all draw on the same, centralised, authoritative Priority Actions Data. The story maps include information on everything from river catchment areas to fish population health statistics, and users can click on points within interactive maps to bring up boxes with more information.
“Whether our member organisations are communicating with local residents, volunteers, landowners or government agencies, the ArcGIS story maps enable them to really demonstrate the value that their planned interventions can bring to the freshwater environment.”
Sean Robertson, SFCC Manager
Benefits
First ever, nationwide view of planned interventions
Now, for the first time, SFCC, its members and stakeholders have a clear understanding of over 1,300 interventions planned nationwide to help improve conditions for wild salmon. “Previously, there was no way to gain an understanding of what was planned, at a national level, without trawling through 44 separate pdf reports,” says Sean Robertson, SFCC Manager. “Now, using ArcGIS Dashboards, we can see exactly where interventions are needed, across the whole of Scotland, what types of interventions these are and their likely cost.”
Improved ability to attract funding for new interventions
ArcGIS Dashboards clearly highlight £202 million in unfunded and partially funded projects ready for investment in the next five years, across Scotland. It is, therefore, now much easier for investors to find projects of the type they are interested in and in the locations where they want to invest. Private sector organisations can, for example, see where funding is needed for tree planting on riverbanks and invest to offset their carbon footprints. “We now know the precise level of investment required to improve conditions for salmon populations, at local and national levels, and can use this insight to help us attract finance from new investors,” Robertson says.
More adaptive and collaborative planning
The fisheries management plans created with the ArcGIS StoryMaps app builder are far more adaptive than pdf plans, so member organisations can update their management strategies easily, on demand, whenever an action has been completed or new ones arise. The story map format is also more effective at revealing opportunities for organisations to share resources, avoid duplication and work together on similar projects. “The ArcGIS story maps are stimulating greater collaboration and will, I believe, lead to better outcomes for Scotland’s salmon and river environments,” comments Robertson.
Clearer communication with stakeholders
The 44 fisheries management plans are now far more interactive and engaging, improving communication between rivers and fisheries trusts and their audiences. “Story maps really hold people’s attention and are much better than long text documents for showing people what interventions are needed and where,” Robertson explains. “Whether our member organisations are communicating with local residents, volunteers, landowners or government agencies, the ArcGIS story maps enable them to really demonstrate the value that their planned interventions can bring to the freshwater environment.”


HSE
Modernising a well-established GIS application and moving it to the cloud has led to significant productivity improvements
A mapping tool that had been in use by Great Britain’s Health and Safety Executive (HSE) for over 15 years had become so critical to users that the organisation was nervous about updating it. However, with support from Esri UK’s Professional Services team, HSE built a modern cloud-based version of the application, installed it with no business disruption and completely transformed the productivity of multiple teams.
HSE’s cloud-first strategy means that the organisation’s new mapping tool will never become out-of-date
The managed cloud solution met the UK Government’s strict data security requirements
The new mapping tool’s ease-of-use has contributed to a 100% increase in users throughout HSE
The Challenge
HSE has a statutory obligation to provide advice to planning authorities across Great Britain for proposed new developments close to major hazard industrial facilities, pipelines, explosives factories and other facilities that represent a possible safety hazard. To fulfil this role, the organisation defines distance-based Consultation Zones around specific sites and along pipeline routes, which vary in size depending on the assessed level of risk.
For more than fifteen years, HSE had been using a geographic information system (GIS) viewer, known internally as the Consultation Zone Mapper, to visualise these nationwide Consultation Zones. Built using Esri GIS technology, this solution had been state-of-the-art when it was first introduced. However, resource and technology limitations prevented HSE from developing it further and, consequently, this critical system had become out-of-date.
The Solution
Recognising that an upgrade was well overdue, the GIS team at HSE discussed the challenge with Esri UK’s Professional Services team. HSE already had an Enterprise License Agreement with Esri UK and was able to access several days’ consulting services and all the technology it needed for this project, at no additional cost to the organisation.
First, the Esri UK Professional Services team developed a proof-of-concept solution for HSE that precisely replicated the functionality in the existing system. HSE demonstrated the proof-of-concept with key users in its Land Use Planning Team and showed them just how much quicker and more efficient a new solution could be.
Whereas the existing Consultation Zone Mapper solution operated on hardware on HSE’s premises, the new solution was designed to be hosted in the cloud. Esri’s cloud service was thoroughly vetted by HSE’s IT department and met the government’s strict data security standards. ArcGIS Online is constantly being updated and enhanced by Esri UK, so HSE will not have the problem of depending on aging and out-of-date technology.
Having secured buy-in throughout the organisation, the GIS team refined and customised the proof-of-concept solution, configured it with live data and created secure access using HSE log-ins. Because it was a completely new system, rather than an upgrade to the existing system, HSE was able to keep the legacy software running in parallel. This helped to dispel employees’ nervousness about replacing the existing system and removed the risk of disruption to ongoing operations.
With positive feedback from early users, the GIS team rolled out the new Consultation Zone Mapper rapidly across the organisation and began to introduce additional features that had not been available in the previous version, such as the inclusion of aerial photography data.
Benefits
Enterprise-wide productivity improvements
The next-generation Consultation Zone Mapper is a more responsive, cloud-based solution that enables employees across HSE to work more productively. With the previous version, it used to take up to five minutes for data to load, due to the age of the on-premise hardware; now, however, the data is there instantly. In addition, the GIS team can now update data within a couple of hours, whereas it used to take a whole day.
80% time saving in planning team
In the Land Use Planning Team, planning queries that used to take up to thirty minutes can now be completed in around five. This 80% time saving means that the team can respond to enquiries from local authorities far more quickly, and HSE can perform its statutory role as a planning consultee significantly more efficiently. The Land Use Planning Team is also less dependent on the GIS team for advice, as it can run more queries itself within ArcGIS Online.
100% increase in application usage
Positive feedback on the new solution has led to the number of users increasing from around 50 to over 100. Several new groups of employees, including the risk assessment team and the explosives team, are now using the Consultation Zone Mapper to see their data spatially for the first time. HSE attributes this success to the ease-of-use of the new solution.
Value-adding new capabilities
Through this project, HSE has delivered a host of new features, which are adding value in many different ways. Users can, for example, edit features and annotate maps for reports for the first time, as well as access the solution from mobile devices, which wasn’t possible before. Pipeline inspectors can now use it to assess hazards in the field, removing the need to print paper maps, and senior managers can illustrate solutions in planning meetings to inform decision making.
Southern Housing
ArcGIS has always been an essential tool for efficient asset management. Now, we are discovering new ways to use ArcGIS to monitor and report on numerous regulatory KPIs and demonstrate how we are fulfilling our sustainability and biodiversity objectives.
GIS is a vital tool allowing any housing association to integrate its datasets and manage its assets through location. Southern Housing is taking this one step further and is pioneering the use of ArcGIS to monitor and report on multiple regulatory KPIs, gauge ESG performance and demonstrate how it is fulfilling its ambitious sustainability and biodiversity objectives.
With a single repository for data staff can better understand assets and quickly answer incoming queries
Homes needing energy performance improvements can be quickly identified supporting better EPC ratings
Biodiversity changes can be recorded supporting the regulatory BNG uplifts mandated for new housing developments
The Challenge
Southern Housing is one of the largest housing associations in the UK, owning and managing over 78,000 homes across London, the South East, the Isle of Wight and the Midlands.
Formed in 2022 from the merger between Optivo and Southern Housing Group, it is a not-for-profit organisation with charitable status. The company’s funders support its long-term investment in communities, with sustainability and environmental, social, and governance (ESG) considerations embedded in its culture and strategies.
Since the merger, significant progress has been made to analyse, amalgamate and harmonise asset data from each of the merging companies, supported by GIS. A significant challenge for the sector is the increasing demand from investors for sustainability information and the substantial amount of data required for ESG and KPI monitoring and reporting, which Southern Housing has made great progress towards.
The UK government has set a target for social housing providers to achieve a minimum Energy Performance Certificate (EPC) rating of C for rented ‘fuel poor’ properties by 2030. Therefore, up-to-date information, or ‘EPC snapshots’, is vital for the Sustainability Team to target improvement plans effectively and enhance energy efficiency in underperforming properties alongside other major investments.
Furthermore, the organisation is committed to ambitious standards of sustainability, having set out its long-term vision and science-based targets in its Environmental Sustainability Strategy and Biodiversity Pathway. This includes efforts to improve biodiversity values across its holdings, which requires monitoring and reporting.
“Not only do we need to better understand our assets and responsibilities, we have to regularly monitor and report on multiple regulatory KPIs, gauge our ESG performance and demonstrate how we are fulfilling our commitments in our Environmental Sustainability Strategy,” said Bethany Austin, Sustainability and Reporting Manager.
“ArcGIS is a powerful tool to help us measure the sustainability of our homes. We are not only fulfilling regulatory or investor reporting requirements but also demonstrating our clear commitment to improving our homes and communities for our residents.”
Kara Tomes Meek, Head of Sustainability, Southern Housing
The Solution
The Sustainability Team at Southern Housing has effectively utilised ArcGIS Pro and ArcGIS Online to develop dashboards that geographically collate, visualise, and report data. This GIS-led approach is particularly valuable following the merger of the two companies' assets, providing a centralised base for data integration. Despite this centralisation, assets can still be examined individually, which is essential for specific queries, such as those from local authorities and other key stakeholders focusing on particular areas.
Detailed insights are readily accessible thanks to Ordnance Survey (OS) AddressBase®, including the energy performance profile of homes. OS’s addressing product matches 29 million Royal Mail postal addresses to unique property reference numbers (UPRN), bringing a geographical dimension to matched records. As a Strategic Partner to OS, Esri UK supports the use of OS data in the ArcGIS System including ready-to-use offline data and connectors for OS APIs and tools so customers can process the data themselves.
For Southern Housing, for instance, using ArcGIS Pro and ArcGIS Online, users can identify geographic clusters of homes that are close to achieving Band C. They can also determine specific wall constructions, such as cavity walls, to target specific measures, such as cavity wall insulation, through retrofit programmes.
Flood risk management is another critical function. Properties can be classified as high, medium, or low risk based on the Environment Agency's flood risk maps. This enables proactive measures to mitigate flood risk to create resilient communities such as promoting the Environment Agency’s flood alerts to residents living in areas of flood risk areas.
In support of its sustainability objectives and biodiversity action plan, Southern Housing has mapped its greenspaces using the OS MasterMap Topography Layer which gives users access to the most detailed, current and comprehensive dataset of Great Britain. During the development of its Biodiversity Pathway, a natural asset audit was conducted to establish a baseline for natural asset improvement. Utilising the Living Atlas and the SHIFT methodology, the team estimated the total biomass across all housing assets to be 14,487 tonnes. Over 26,000 homes with private gardens further support biodiversity.
ArcGIS proves to be an ideal tool for measuring Biodiversity Net Gain (BNG), ensuring compliance with new regulations. By measuring biodiversity before and after the construction of new housing developments and comparing the two, Southern Housing will be able to demonstrate the required 10 percent BNG improvement.
These activities underpin Southern Housing’s key metric: ‘30 by 30 by 2030’. The organisation aims to protect and support 30 flora and fauna species (selected in different regions as indicators of thriving diversity) by delivering 30 habitat creation and enhancement projects annually until 2030. ArcGIS will continue to be instrumental in curating, managing, and presenting the data that supports these initiatives.
“GIS is vital to help us map, manage, record and report on our biodiversity action plans. Most importantly, it is demonstrating how we are delivering against our main metric of supporting 30 flora and fauna species by creating and enhancing 30 habitats by 2030.”
Kerry Briffitt, Biodiversity & Sustainability Projects Lead, Southern Housing
Benefits
Optimised asset management
With a single repository for asset data, staff can better understand assets and responsibilities and quickly answer incoming queries. This is of greater importance given the increased size of the organisation following the merger of Southern Housing Group and Optivo, with over 78,000 homes.
‘Our pioneering work with complex datasets and the use of ArcGIS enables us to understand the performance of our property portfolio in detail. This enables us to make informed strategic decisions that will deliver improvements to our residents and wider benefits’. Dritan Uka, Director of Strategic Asset Management, Southern Housing.
Delivering on EPC requirements
The use of ArcGIS to measure and map the energy performance of its homes enables the identification of areas for improvement and supports decision-making at both local and senior strategic levels. The Sustainability and Capital Investment Teams can respond accordingly to undertake necessary improvements to move properties from Band D or below to Band C.
Demonstrating Biodiversity Net Gain
Using GIS, Southern Housing will be able to measure and record biodiversity before and after new housing developments are built, facilitating the required regulatory reporting and supporting other internal and external stakeholder updates. They will be able to demonstrate and map metrics showing how a development site is left in a measurably better state than before the development began by mapping new wildlife habitats, plants, and insects. They’re aiming to use GIS to apply the same monitoring methodology to all habitat enhancements going forward.
Monitoring and reporting sustainability metrics
ArcGIS will be used to support reporting around the organisation’s science-based targets detailed in its Environmental Sustainability Strategy and Biodiversity Pathway. The organisation's goal of delivering ‘30 by 30 by 2030’ involves communicating these biodiversity management successes to multiple stakeholders, including the communities and housing developments where new initiatives are being implemented.

Greater London Authority
Web mapping services created with ArcGIS Enterprise allow us to make 3,500 datasets from 35 organisations available internally and publicly in a standardised and discoverable format.
The Greater London Authority has embedded Esri’s ArcGIS technology at the heart of a new end-to-end digital planning process for London. The use of ArcGIS web mapping services is improving access to planning information from 35 planning authorities and helping to accelerate the delivery of new homes throughout the capital.
3,500 data sets from 35 organisations standardised and consolidated with ArcGIS Pro
Web mapping services for 100+ internal and external maps and apps created with ArcGIS Enterprise
Hybrid data storage strategy facilitated using private cloud and ArcGIS Online
The Challenge
One of the Mayor of London’s top priorities is to build thousands of genuinely affordable homes to buy and rent. To support this goal and help developers build more homes more quickly, the Greater London Authority (GLA) wanted to make information about planning opportunities and constraints more easily accessible. It realised that a lot of useful planning information was locked away in documents, spreadsheets and disparate systems, not just within the GLA but also within thirty three London boroughs and two additional planning authorities. It therefore set out to bring together thousands of separate datasets, covering the whole of London, and make them readily available to search, view and download.
“ArcGIS has really helped us unlock the planning data, which shapes the future of London.”
Peter Kemp, Head of Change and Delivery, Planning, Greater London Authority
The Solution
In what was a highly collaborative project, GLA started by liaising with London’s 35 planning authorities to consolidate all available planning datasets and documents. It then used Esri’s ArcGIS Pro solution to standardise geometry, attributes and coordinates across the many different datasets assembled. “It was an enormous task,” recalls Paul Hodgson, Senior Manager, City Data, Greater London Authority. “Even the way that lines were drawn was different across different boroughs, but using ArcGIS Pro we were able to bring everything together in a common format.”
After amassing nearly 3,500 data layers, GLA used ArcGIS Enterprise to create a centralised data repository, with some of the data held on premise and the remainder held in ArcGIS Online, in a private cloud. GLA then created a series of ArcGIS web map services with ArcGIS Enterprise enabling it to serve up the datasets in a variety of ways and make them discoverable to different audiences. “A key part of the project is sharing the data with the wider world,” Hodgson says. “ArcGIS Enterprise gave us a route to doing this.”
One ArcGIS web map service powers a new web app, called the Planning DataMap, that makes it easy for developers to view information about planning constraints and opportunities on an interactive map. Users can search for information in the categories ‘Protection’, ‘Good Growth’ and ‘Context’, or look at local policy layers from each London planning authority under ‘Borough Layers’.
In addition to the Planning DataMap, there are around 100 internal and external web maps that stream data from ArcGIS Enterprise on everything from listed buildings and designated greenbelt zones to brownfield sites. External organisations can also go to the GLA website to stream the data that they are interested in directly from ArcGIS Enterprise into their own data systems, planning solutions or housing apps.
ArcGIS Enterprise is now an integral part of GLA’s digital planning strategy. It integrates with other third-party systems and is helping GLA to create a complete end-to-end digital process, from evaluating sites and managing planning permissions to monitoring the progress of strategic plans. According to Hodgson, “ArcGIS interacts very well with other systems, using recognised standards.”
“ArcGIS interacts very well with other systems, using recognised standards.”
Paul Hodgson, Senior Manager, City Data, Greater London Authority
Benefits
Improved access to open data for everyone
Developers, landowners and local authorities can now see all available information about planning opportunities and constraints, in any London borough, all in one place, for the first time. In the first four months of 2024 alone, ArcGIS served up data over 8 million times, demonstrating just how vital a role ArcGIS is fulfilling in the planning process for the capital. Peter Kemp, Head of Change and Delivery, Planning, at GLA, says, “ArcGIS has really helped us unlock the planning data, which shapes the future of London.”
Faster delivery of new homes in London
The GLA anticipates that the improved availability of London planning data will help to accelerate the house building process, as it will contribute to time savings in the planning process. Established developers can identify opportunities and put together schemes more quickly. Equally, it will be easier now for new entrants to the market and proptech innovators to find the information they need to start their first development projects.
More successful planning applications for developers
With the wealth of data served up by ArcGIS Enterprise, developers have a clearer understanding of planning constraints that cross boroughs. They can, therefore, now put together well-informed planning applications that are less likely to be turned down, as constraints have been taken into account properly. For instance, it is now far easier to understand protected views, such as the vista of St. Paul’s Cathedral, and see where height restrictions on new buildings apply across a wide area.
Greater collaboration between boroughs
The use of ArcGIS helps to improve transparency and supports greater collaboration between London boroughs. In particular, planning teams within London boroughs can more easily take into account the plans of other neighbouring boroughs. They can avoid duplication (such as planning similar health facilities in close proximity) and identify development opportunities that cut across borough boundaries.
Improved decision making within the GLA
Within the GLA itself, it is now possible for teams across all departments to consider planning information when making decisions. For example, a team responsible for improving highstreets has recently used data from ArcGIS to understand how planned new homes might increase footfall in shopping areas. “The great thing about having ArcGIS web services is that you can easily draw planning data into other projects,” Hodgson says. “It makes other projects a lot more doable.”

Amphibian & Reptile Conservation
Our volunteers are vital to our mission. We need data collected from surveys all over the country, and it must be secure. ArcGIS Hub Premium has delivered this and so much more, helping us generate the insights required to support the conservation of endangered species.
Leading national wildlife charity Amphibian & Reptile Conservation (ARC) relies on its army of volunteers to survey endangered species in the field, to support its research into and monitoring of a range of wildlife from frogs to lizards. ArcGIS Hub Premium gives the charity a powerful engagement and collaboration platform and, with highly intuitive digital data collection tools, is helping ARC to drive new insights from data collected and influence future wildlife legislation.
Different stakeholders have separate working environments alleviating data security concerns
Thousands of field surveys are now being undertaken digitally
Improved monitoring and conservation management is proactively helping species in danger
The Challenge
Many conservation organisations are dependent on data collected by the general public to help them to monitor and protect wildlife. One such charity is Amphibian & Reptile Conservation (ARC), a nationwide charitable trust dedicated to the conservation of the UK’s native amphibians, reptiles and their habitats. Responsible for managing over eighty nature reserves, the organisation engages and collaborates with a comprehensive community of volunteer and professional citizen scientists, schools, landowners, data partners and other stakeholders who collect geospatial data in the field.
Approximately one third of UK native amphibians and reptiles are currently under threat of extinction. In order to understand and monitor these threatened species, ARC has developed the National Amphibian and Reptile Monitoring Programme, comprising different surveys and projects designed to generate, analyse and understand data on these species. At any one time, ARC runs multiple surveys in the field, all which support species status assessments.
Collecting data can be incredibly time intensive; it takes extensive human effort and time in the field. Data quality must be consistent and needs to be easily shared among a wide variety of user groups and assimilated into succinct, easy to generate reports. Careful attention to data protection and data security is also vital; external volunteers cannot have access to internally held data and only specific user groups can be given access to certain records.
The bar was set high. ARC needed a customisable community engagement software platform that would enhance its capacity to engage, train and support its varied cohort of surveyors in the field. Furthermore, its capabilities had to include streamlined reporting and the secure sharing of data across its broad church of stakeholders. To find out more visit https://monitoring.arc-trust.org/.
“The ARC Survey Hub, built using ArcGIS Hub Premium, has transformed engagement with our many different stakeholders and data collection has become much simpler, and more efficient, for our brilliant volunteers.”
Dr Robert Ward, Senior GIS & Data Officer, Amphibian & Reptile Conservation
The Solution
ARC leveraged Esri ArcGIS Hub Premium to solve these challenges and built the ‘ARC Survey Hub’ which is now transforming the way in which it engages and collaborates with its staff and stakeholders.
ARC Survey Hub is a series of ArcGIS Hub based sites, each set up to allow different user groups the secure access they need to submit data, access resources and view information. ARC’s community of volunteers use community user accounts and logins to access different ArcGIS Hub sites. Dependent on the projects they are involved in, volunteers can submit features relevant to those initiatives.
For example a volunteer participating in the National Amphibian Survey can record their survey sites, the ponds they are planning to survey and their wildlife sightings as a result of those surveys. Within project areas they can view their submissions and, in some cases, enjoy access to restricted data not shared with the general public.
Members of the public have access to ARC’s public content and can learn about its different survey programmes, as well as submit features such as wildlife sightings through a public web form. Results can be seen on a public dashboard and public users can interact with the findings.
Landowners are provided with access to a separate area where they can submit their own features such as an area they have identified to survey. They map it and ARC makes it available to the relevant pool of volunteers as an option to survey. Data surveyed and submitted can be downloaded separately by landowners, for use with their own land management and conservation purposes.
Field data collection for all surveyors has been transformed with the introduction of ArcGIS Survey123 and ArcGIS Field Maps. Paper-based data collection is being replaced with these digital solutions which volunteers can use even when offline. The ARC team can quickly spin up customised surveys with easy-to-fill answer fields, allowing surveyors to embed audio and images and have access to guidance on lone working and health and safety policies.
Findings are now reported and presented to stakeholders and volunteers in simple, easy-to-understand formats through Dashboards, StoryMaps and Experiences.
“Keeping data secure with the right access protocols is vital for any charity. The ARC Survey Hub is a game-changer, and we thank Esri for all its help making this possible, helping us to protect species at risk and save the habitats on which they depend.”
Jim Foster, Conservation Director, Amphibian & Reptile Conservation
Benefits
Optimised data security
ArcGIS Hub Premium capabilities enable ARC to set up separate working environments for different stakeholders, alleviating any data security concerns. Volunteers from the general public only have sight of specific, gated data while other stakeholders, such as landowners, have their own working areas through which they submit data, and have access to further reports.
Increase in digital surveys undertaken
The ease of use field apps including Survey123 has made surveying more straightforward, easier and quicker for volunteers. Thousands of surveys are now being undertaken in Survey123 giving ARC’s surveyor community a greater sense of ownership of their data. 90 percent of respondents to a recent survey, rated the overall quality of resources provided to them by the ARC Survey Hub as good, very good or excellent.
Better conservation
Species status is now more efficiently monitored and, where ARC sees perhaps biases in the data or gaps in recording, it can reassess its survey and sampling design. Overall this delivers insights that will support better conservation programmes.
Improved protection of high-risk species
Data collected contributes towards species status assessments which highlight the location of threatened species, and habitats that are changing. This enhanced detail of reporting is better informing policy making, wildlife legislation and land management, and supporting reintroduction programmes of those species in danger.

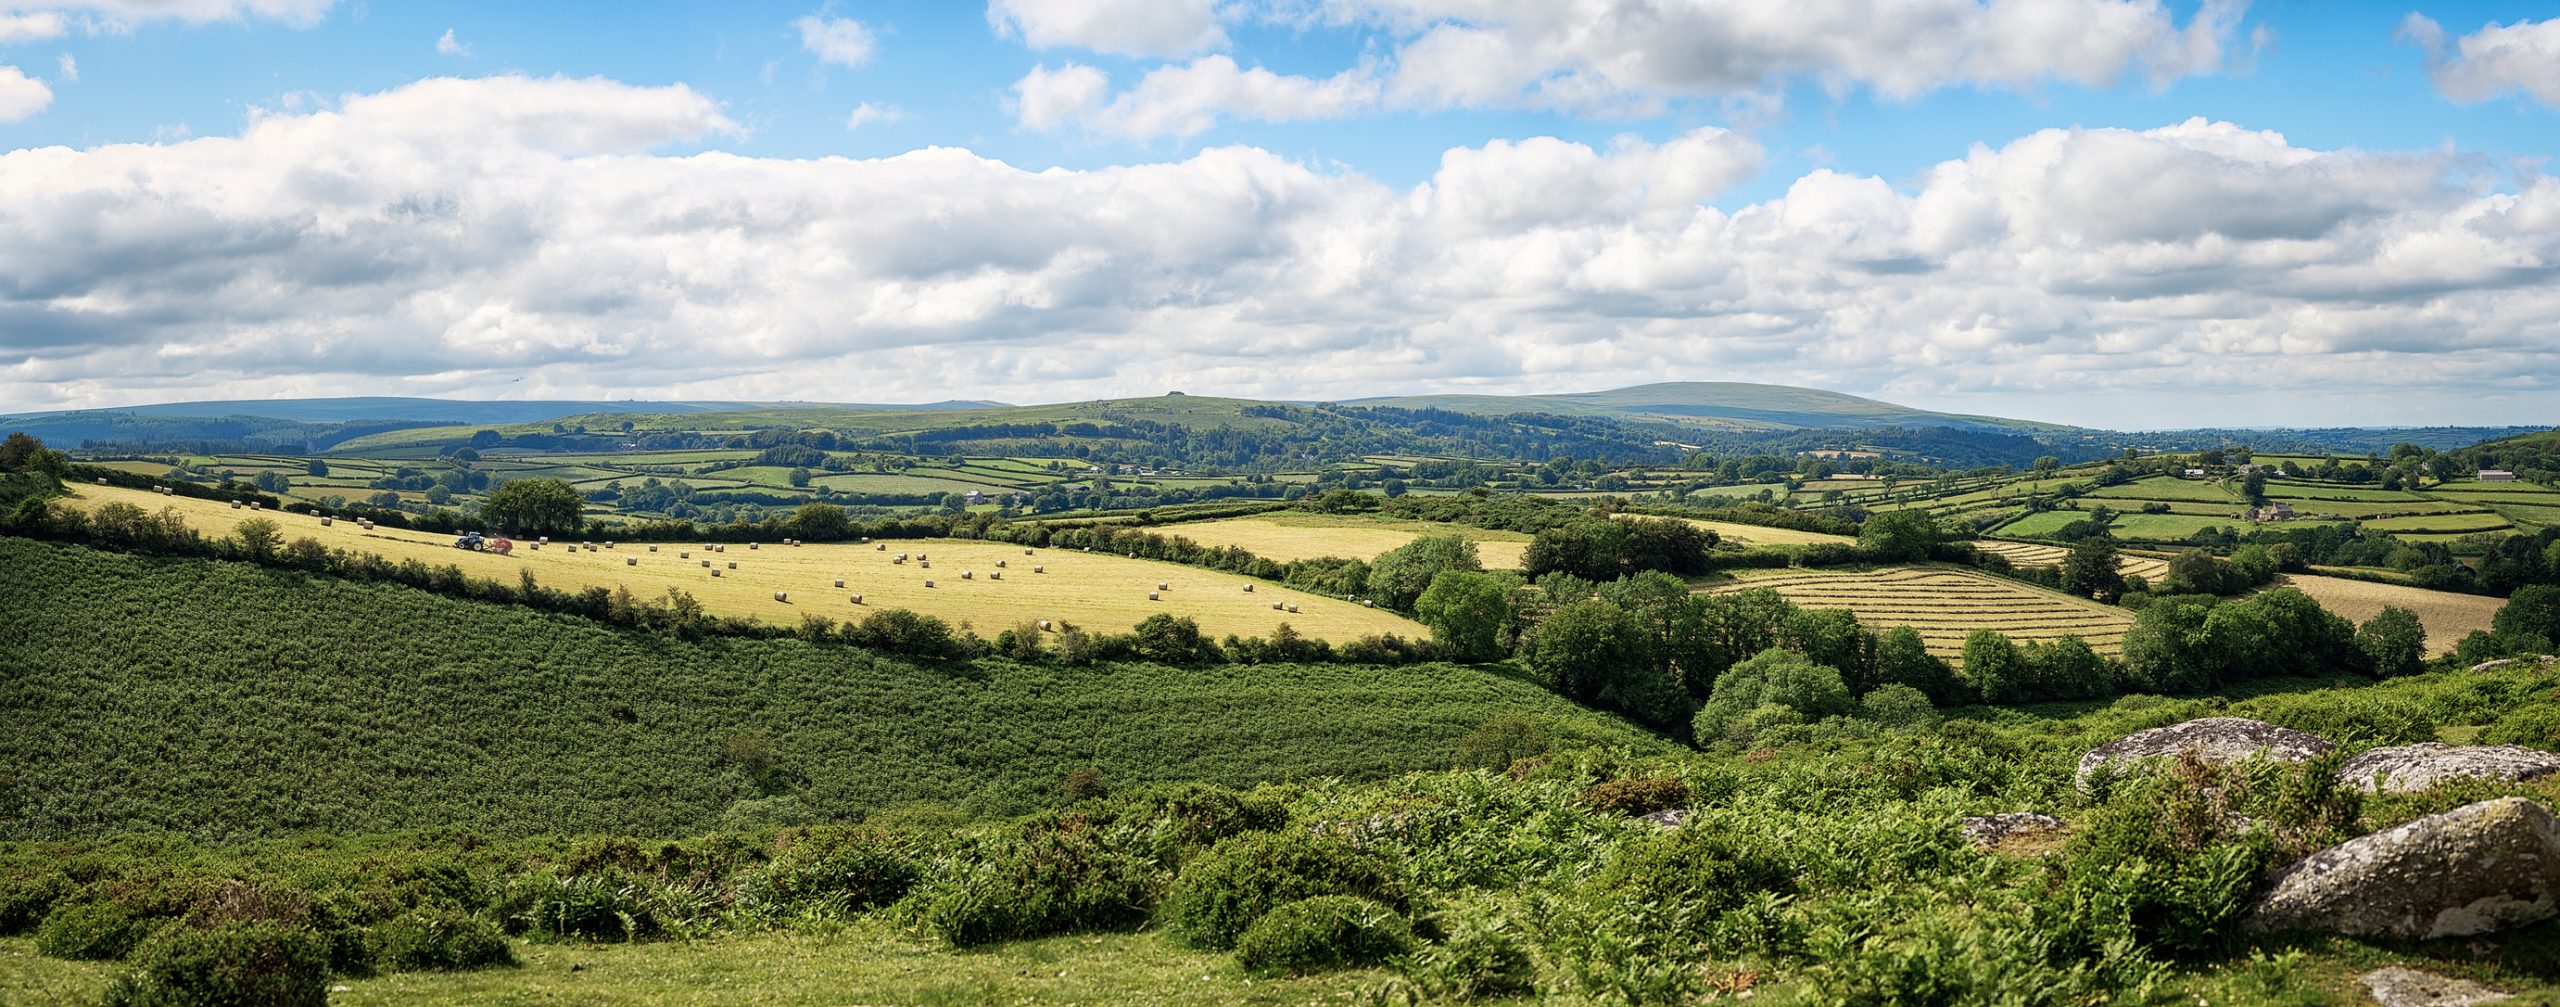
Cornwall Council
A series of ArcGIS Field Maps apps, built in-house, are helping us to manage and expand our trees and forestry more cost effectively.
Cornwall Council has transformed its tree management processes with flexible, easy-to-build ArcGIS apps. Whether it is monitoring the spread of ash dieback disease, watering young saplings or planning locations for new trees in its Forest for Cornwall initiative, the local authority can now operate more cost-effectively and make better decisions to maintain and expand Cornish tree-planting.
25 tree surveyors used an ArcGIS Field Maps app to monitor the condition of 745 ash trees for ash dieback disease
Two council teams and one prime contractor use ArcGIS Field Maps apps to maintain 1,200+ young trees
Forestry teams use digital tree records in ArcGIS Online to inform planting schemes for 200+ new trees annually
The Challenge
From native trees such as English oaks and Scots pine to non-native exotic trees including sweet gums, trees of all species play an important role for Cornwall, helping to mitigate the impacts of climate change and improving residents’ wellbeing. Cornwall Council manages thousands of mature trees on its land, while also proactively planting and nurturing hundreds of new trees every year, as part of its carbon-absorbing Forest for Cornwall programme, to enrich and expand tree canopy across the region.
Like other landowners in the UK, the council needed to respond to the rapidly spreading ash dieback disease and assess the condition of ash trees. At the same time, it needed a more effective way to find and assess potential locations for new trees and then manage the maintenance and watering of young saplings for at least the first three years after planting.
“Without ArcGIS, we would not have been able to undertake the work requirement for ash dieback inspections, something which is vital for our tree risk compliance.”
Councillor Martyn Alvey, portfolio holder for environment and climate change at Cornwall Council
The Solution
Cornwall Council had been using Esri’s ArcGIS technology for more than two decades and the in-house geographic information systems (GIS) team had the skills and software in-house to transform the council’s tree management processes.
The GIS team started by using ArcGIS Field Maps to build a mobile solution for inspecting ash trees while in leaf when signs of disease are most evident. Around 25 tree surveyors used this app in the field to locate trees requiring assessment and to record photos and information about canopy condition. All the data collected in the field was instantly uploaded to the council’s on-premise ArcGIS Enterprise system and used to update an in-house tree management application.
Next, the GIS team developed a broader tree management solution for use by the council’s Forestry Service and separate Forest for Cornwall project team. Spreadsheets of potential planting locations and the locations of young, recently planted trees were transferred to ArcGIS Online, creating a resident-friendly, real-time and editable map of planting opportunities across Cornwall. A series of mobile apps were then built with ArcGIS Field Maps allowing around 13 people within the Forestry Service and Forest for Cornwall teams, and their prime contractor Cormac, to assess planting locations in the field, capture data on tree planting and record tree watering visits.
The flexibility of the ArcGIS system enabled the GIS team to configure the tree management apps slightly differently for the Forestry Service and the Forest for Cornwall initiative, to reflect each team’s specific requirements and preferences and to minimise complexity. “Council officers can access the maps and data appropriate to their own role, which keeps the apps focused and simple to use,” explains Councillor Martin Worth, portfolio holder for customers at Cornwall Council. “Having been a managing consultant of emerging technology for a UK mobile network back in the early 2000s, it is great to see now how uses for GIS mobile systems have developed and that Cornwall Council is playing a leading role.”
“Because the ArcGIS solutions we created are not heavily coded and are essentially commercial off-the-shelf products, we can be very flexible and use agile development to deliver exactly what is needed.”
Councillor Martin Worth, portfolio holder for customers at Cornwall Council
Benefits
Cost effective management of ash dieback disease
ArcGIS has played a pivotal role in helping Cornwall Council to manage more than 745 ash trees and carry out in-leaf inspections of trees near public spaces where falling dead branches could have posed a risk to public health. “Without ArcGIS, we would not have been able to undertake the work requirement for ash dieback inspections, something which is vital for our tree risk compliance,” says Councillor Martyn Alvey, portfolio holder for environment and climate change at Cornwall Council.
More efficient maintenance of young trees
Through the use of ArcGIS, Cornwall Council has improved the efficiency of its maintenance services for over 1,200 young trees, cared for by the Forestry Service and Forest for Cornwall teams. The ArcGIS apps reinforce an efficient workflow and enable tasks to be shared more evenly throughout teams, reducing the workload on individual officers. The council also has an auditable digital record of its tree planting and early life maintenance, which enables it to improve its reporting to grant providers.
Improved planning for canopy extension
Cornwall Council will use ArcGIS to inform the planting of up to 200 trees a year by the Forestry Service, plus an estimated 400 further trees under the Forest for Cornwall programme in 2024-26. It now has a better understanding of which trees have been planted, in which locations and, over time, will be able to see which species grow best in the Cornish climate. Councillor Alvey says: “We can ensure we are improving biodiversity and helping Cornwall reach its goal to become carbon neutral, by planting the right species in the right place. We can also ensure trees of the same species are well spaced out, so if another disease like ash dieback hits, its spread can be slowed.”
Flexibility to meet user requirements
As new demands come in from the Forestry Service and Forest for Cornwall teams, the council’s GIS team is able to respond quickly, adapting or extending the functionality in the ArcGIS apps. Councillor Worth says: “The requirements keep growing and changing. Because the ArcGIS solutions we created are not heavily coded and are essentially commercial off-the-shelf products, we can be very flexible and use agile development to deliver exactly what is needed.”
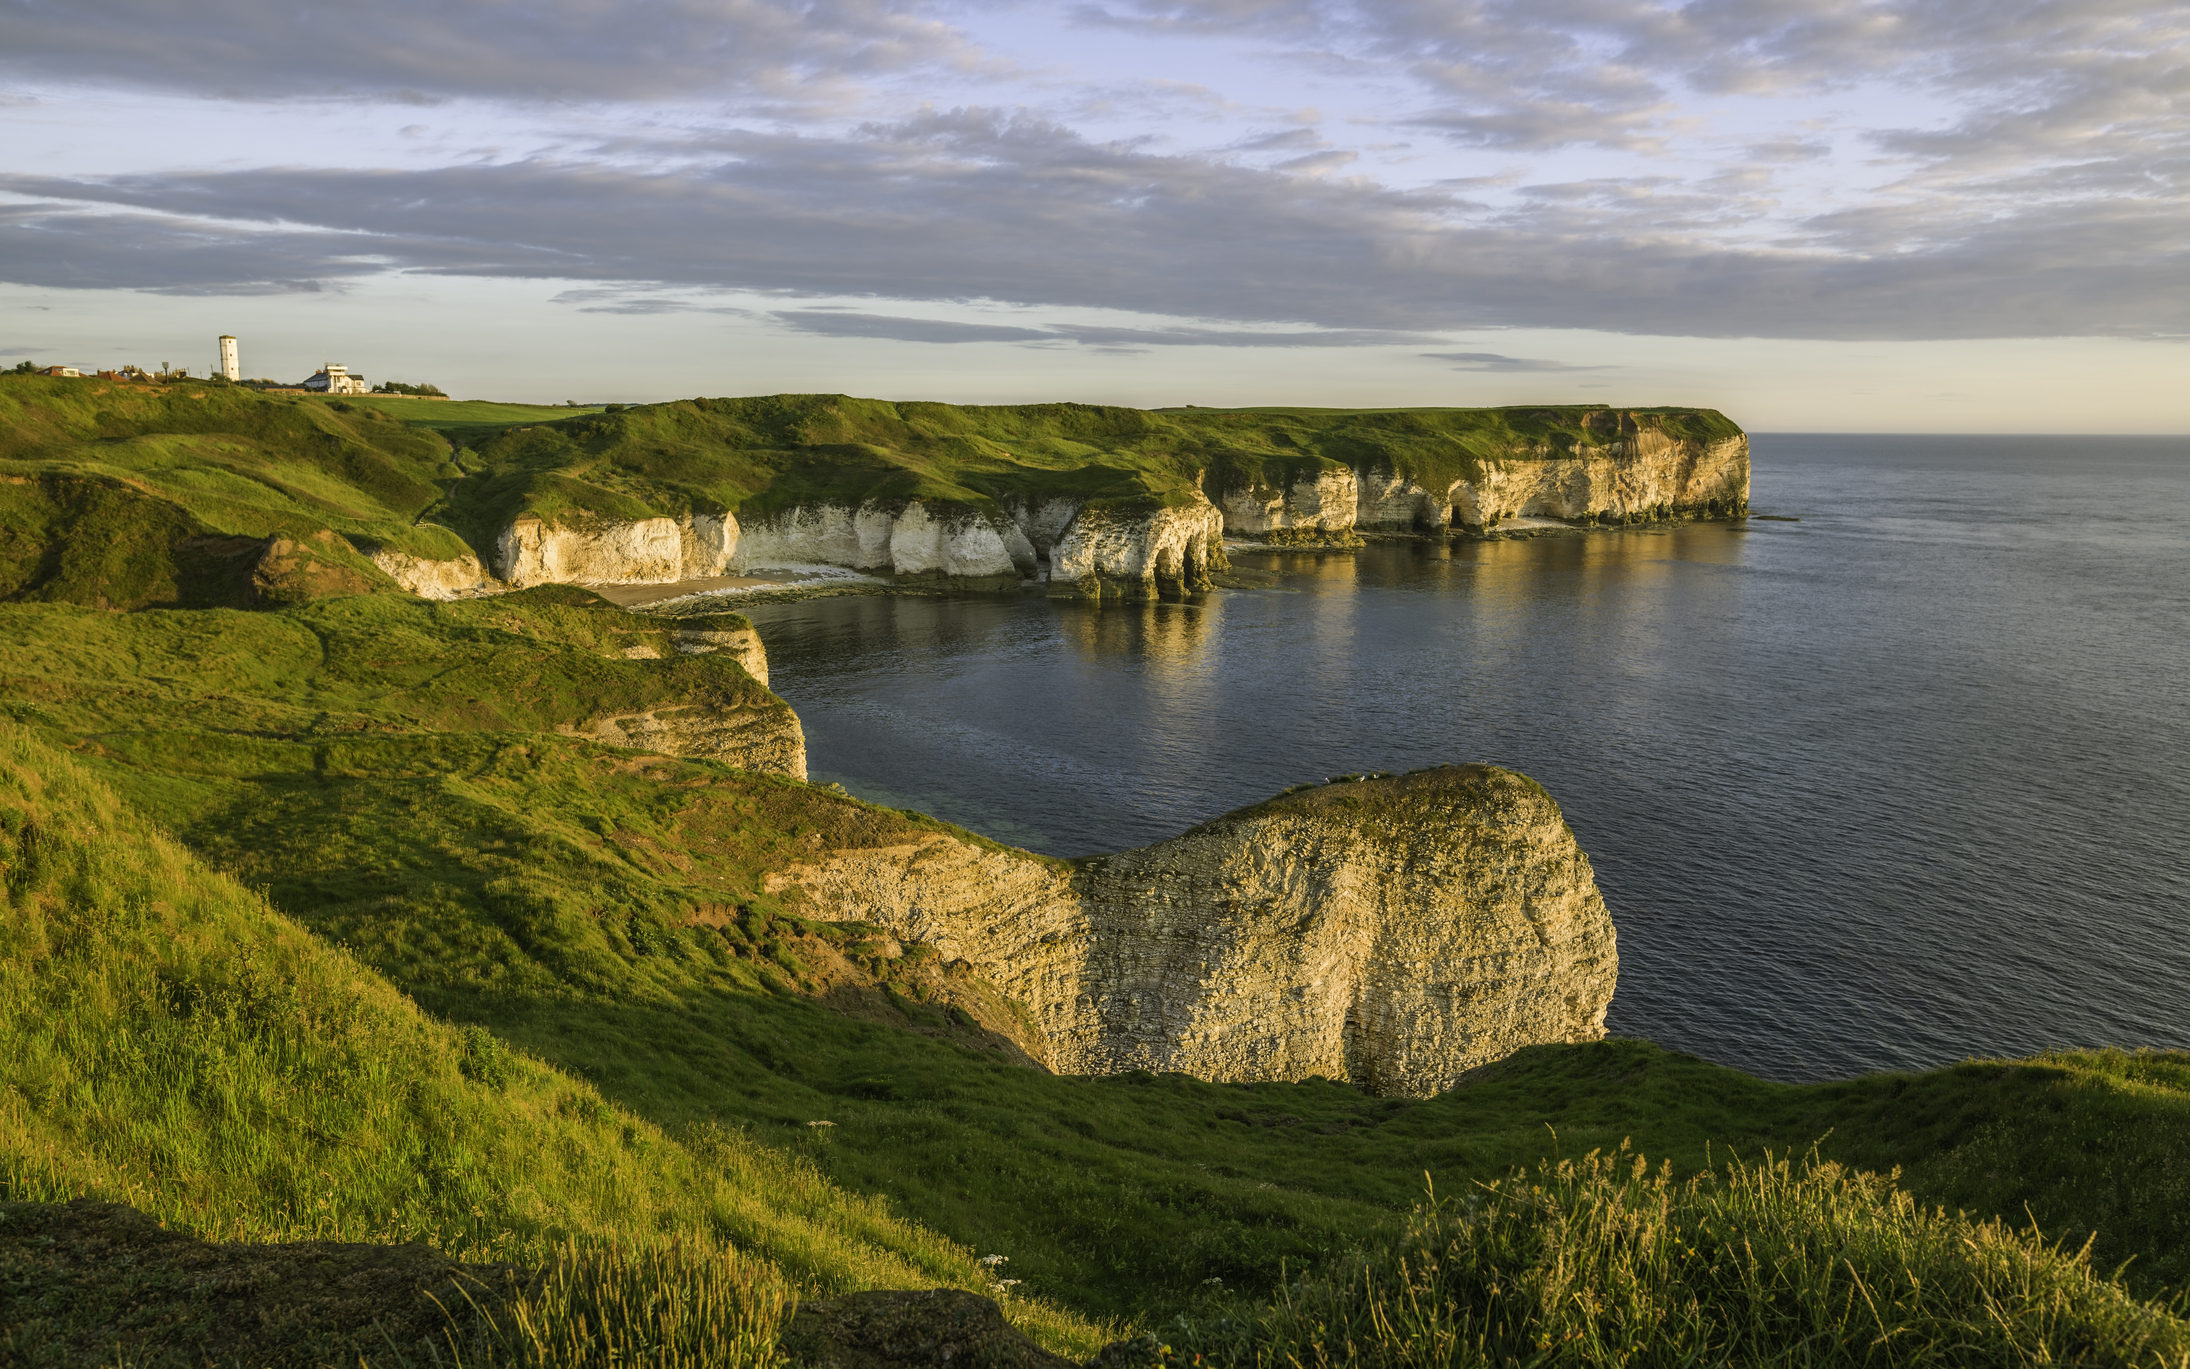
East Riding of Yorkshire Council
With careful planning and support from Esri UK, we successfully migrated 100 users from ArcMap to ArcGIS Pro and reduced our annual GIS costs.
East Riding of Yorkshire Council has successfully transitioned 100 users from Esri’s ArcMap to ArcGIS Pro. This strategic migration project delivered improved GIS capabilities for fifteen separate teams and provided a catalyst for innovative new council services, while also generating significant annual cost savings.
Council-wide adoption of ArcGIS Pro provides catalyst for improved GIS workflows across the council
Improved management of ArcGIS licences across service areas reduces annual costs by 10%
Well-planned, strategic migration project is supported by Esri UK’s Professional Services group
The Challenge
Over many years, the use of geographic information system (GIS) products had grown extensively and organically within East Riding of Yorkshire Council. The organisation held 130 licenses for Esri’s ArcMap solution and had 15 teams of users, in departments including social care, highways management, education and building control. However, these employees used a myriad of different ArcMap product versions and relied on separate data sets, which made it almost impossible for them to share information and collaborate effectively.
To address this challenge, the council took the strategic decision to migrate all its users to ArcGIS Pro, Esri’s next generation desktop GIS application, which expands the functionality of ArcMap and works seamlessly with the wider ArcGIS system via web services. “With a large and diverse user base, we knew that the migration would need careful planning, but we felt we could use it as a launch pad for significantly improving the value that we gained from GIS,” says Stephen Carter, Principal ICT Officer at East Riding of Yorkshire Council.
“Once service areas started to see what other departments were doing, there was a lot of really positive collaboration and innovation throughout the council.”
Stephen Carter, Principal ICT Officer, East Riding of Yorkshire Council
The Solution
The central ICT team started by conducting an audit of who used ArcMap and what they used it for. This process alone proved incredibly valuable, as it revealed that the council was oversubscribed with licenses and didn’t always have the most appropriate licenses for users, based on their actual usage.
Next, the ICT team established a forum of Professional Users from departments throughout the council, to help it gain buy-in and input from all service areas. Consultants from Esri UK’s Professional Services group supported the ICT team’s planning at this stage, attending forum meetings to give demonstrations of ArcGIS Pro features and providing advice on the most appropriate licence types.
Before commencing the migration, the ICT team standardised all users on the same version of ArcMap and upgraded the council’s server infrastructure for supporting ArcGIS Enterprise on premise. It then pushed out pilot versions of ArcGIS Pro to the forum of Professional Users, giving them time to trial the new solution and become comfortable with it. Following all this thorough preparation, ArcGIS Pro was rolled out in phases, on a team by team basis, over a period of three to six months.
Not content to stop here, the ICT team swiftly moved on to evaluate and deploy other new products in the ArcGIS system. It implemented a new corporate ArcGIS Portal and expanded the use of ArcGIS Online to increase the value of the council’s new common GIS platform and promote better data sharing. These developments put even more capabilities into the hands of users, reducing their reliance on the central ICT team for data management and map creation.
“ArcGIS Pro has opened up a world of new opportunities, and we are making the most of them.”
Stephen Carter, Principal ICT Officer, East Riding of Yorkshire Council
Benefits
Cost savings from more appropriate licensing
As part of the process of planning the migration, East Riding of Yorkshire Council reduced its ArcGIS licenses from 130 to 100, while still ensuring that everyone who needs GIS has access to it. With a better understanding of GIS usage, the council was also able to take advantage of more cost-effective Creator and Mobile Worker licences, where appropriate. “Saving money wasn’t the primary objective of this project,” explains Carter, “But we have in fact reduced our spend by around 10% per annum, while improving the range of GIS capabilities available to service teams.”
A catalyst for innovation throughout the council
The migration to ArcGIS Pro energised GIS usage within service teams and proved to be the catalyst for a range of new apps and services. The Highways team moved ahead especially quickly, creating a series of new ArcGIS dashboards and web apps for site and depot assessments and environmental impact reports. “Once service areas started to see what other departments were doing, there was a lot of really positive collaboration and innovation throughout the council,” observes Carter. “The feedback from teams about ArcGIS Pro has been very positive, at all levels, and having everyone on the same product version is a major step forwards.”
Time savings in central IT team
Staff throughout the council are now empowered to produce the maps, dashboards and survey applications that they need themselves. Consequently, a substantial amount of time has been freed up in the central ICT team that can be invested in other strategic projects. “ArcGIS Pro gives teams the ability to produce bespoke GIS applications and deploy them very quickly themselves,” Carter explains. “This means service managers can be much more responsive to new situations like outbreaks of avian flu.”
Greater integration of GIS in council services
Since the migration to ArcGIS Pro, several service areas within East Riding of Yorkshire Council have begun to integrate GIS capabilities successfully into a wider range of back-office and public-facing applications. For example, GIS is now fully integrated into an online app that allows citizens to report the locations of faulty streetlights more accurately. According to Carter, “The migration to ArcGIS Pro was a starting block for greater integration of GIS with other council applications, internal and external portals. ArcGIS Pro has opened up a world of new opportunities, and we are making the most of them.”

Cadent
We are successfully detecting, locating and reducing methane emissions with a solution built with ArcGIS Online.
Driven by its mission to reduce its environmental impact, Cadent has introduced a new approach to detecting methane leaks from underground gas pipelines. Powered by ArcGIS Online, the solution enables Cadent to initiate more targeted, proactive repairs and achieve significant reductions in greenhouse gas emissions.
With its analytical capabilities, ArcGIS Online provides insight into the locations and quantities of methane leaks
An interactive ArcGIS Dashboard identifies and highlights significant leak indication, enabling repairs to be carried out more proactively
Managers use an ArcGIS Dashboard to monitor the progress of survey vehicles, carry out quick analyses and share information visually
The Challenge
The UK’s largest gas distribution operator, Cadent has a clearly stated commitment to protecting the planet. In its Environmental Action Plan, it specifies thirty actions that it is taking to decarbonise its business operations, reduce its environmental impact and facilitate a low-carbon future. Within this plan, one of the company’s key priorities is to reduce the quantity of methane that leaks from old and damaged pipes. It estimates that over a million tonnes of carbon dioxide equivalent emissions leaked from its gas pipes in 2022/23, and it aims to reduce this leakage by more than 30% by 2030.
As Cadent has responsibility for over 131,000 km of pipes, however, finding the source of emissions is an enormous challenge. To help it achieve its ambitious target, it needed to find an accurate way to locate and measure emissions throughout its network and then respond proactively to reduce them.
“In the first twelve months, we proactively detected and fixed more than 200 leaks responsible for methane emissions and, in one particular location, we reduced emissions by 90%.”
John Batterson, Digital Transformation Manager, Cadent
The Solution
Cadent partnered with Picarro, a supplier of enhanced optical spectroscopy technology, and fitted survey vehicles with scientific environmental monitoring instruments. These instruments were fine-tuned to detect the exact combination of methane and ethane emitted from gas pipes, as opposed to other sources of methane like farming.
Taking one region at a time, the survey vehicles drive roads along the gas network, collecting emissions data within a 200 metre radius of their routes, as well as GPS coordinates and data on wind speed and direction. This data is then transferred seamlessly from Picarro to Cadent’s ArcGIS Online solution, where it is presented visually, overlaid onto digital maps of the gas network. Consequently, staff at Cadent can, for the first time, now see focus areas with high levels of emissions.
To share its new insight, Cadent has created an ArcGIS Dashboard that clearly shows detected emissions by region. This dashboard also shows regions inspected, so managers can see where survey vehicles have been and easily monitor progress throughout the gas distribution area during the course of each year. Using the dashboard, it is also possible to carry out quick data analyses, answer queries and share information visually throughout the business.
Every day, when new data is received, analysts at Cadent review the ArcGIS Dashboard, see where emissions are above a certain threshold, pinpoint the likely source and raise a maintenance request. A work task is created and a repair is initiated to proactively lower emissions in that region. In the future, Cadent plans to extend its ArcGIS-based emissions detection system and integrate it with its SAP work management system to completely streamline and automate this workflow in real time.
“Now, using the insight from ArcGIS about emissions, we can make better-informed decisions about which mains we replace first.”
John Batterson, Digital Transformation Manager, Cadent
Benefits
Accurate insight into where leakage occurs
Previously, Cadent could only forecast where emissions might be escaping, by modelling data from a small sample of historic leaks. Now, however, it knows exactly where emissions are occurring – and precisely how significant these leakages are. Furthermore, data from ArcGIS Online is being used in conjunction with artificial intelligence to calibrate a new predictive model for leakage across the entire network. “Our new approach will massively improve the accuracy of emissions reporting,” says John Batterson, Digital Transformation Manager at Cadent.
Up to 90% reduction in methane emissions
Critically, this new ArcGIS-based emissions detection system allows Cadent to precisely target locations of high emissions. “Using ArcGIS, we are shifting our company from being reactive-only to being more proactive,” explains Batterson. “Then we can find a leak ourselves and repair it, before a member of the public smells it and reports it. In the first twelve months, we proactively detected and fixed more than 200 leaks responsible for methane emissions and, in one particular location, we reduced emissions by 90%.”
40% faster abatement of emissions from old pipes
All gas distribution network operators have a statutory obligation to replace old mains and higher-risk iron pipes. Now, however, Cadent can prioritise which pipes it replaces first, based on more accurate information about emissions. “We replace around 1,600 km of mains every year,” says Batterson. “Now, using the insight from ArcGIS about emissions, we can make better-informed decisions about which mains we replace first. In this way, we think we can increase the abatement of emissions by 40%.
Better asset management in readiness for green gas
By making more proactive repairs, in the right locations, Cadent is improving the condition of its pipeline assets, which will, in turn, help to prepare the network to deliver hydrogen in the future as part of the UK’s decarbonisation strategy. “Being able to demonstrate that we have a really good understanding of our network and where emissions occur – and being able to respond to them quickly – is a good thing,” says Batterson. “It demonstrates our management capability and gives confidence to our regulators and stakeholders that we are managing our network assets in a better way to be green gas ready when the time comes.”

RWE
We are accelerating the delivery of solar energy with an automated site searching model, feasibility analysis tools and project-specific web and mobile apps, all built with ArcGIS.
A global leader in renewable energy, RWE has completely automated the complex site selection process in the UK using Esri’s ArcGIS system. It has also significantly increased the efficiency of feasibility studies and project development processes to improve the success of planning applications and accelerate the delivery of new solar energy projects.
Automated site selection model , built with ArcGIS, saves up to 10 hours per search
ArcGIS-led feasibility assessments contribute to 98% success rate with planning applications
Project-specific ArcGIS web apps and mobile tools share 200 layers of data with 40+ employees
The Challenge
There is an urgent need for more solar energy to help the UK achieve its net zero target. However, it can take many years to find the right sites for solar energy installations, conduct feasibility studies, secure planning permissions and plan what are highly complex construction projects. RWE aimed to use geographic information system (GIS) technology to improve the efficiency of all these integrated planning processes, to help it deliver new solar energy projects more quickly.
“ArcGIS provides a secure and stable system for loading, manipulating and analysing planning constraints to help determine threats to developments.”
Ben Foster, Senior Analyst, RWE
The Solution
The company selected Esri’s ArcGIS and set about using solutions from this GIS system to completely transform key processes for solar energy development in the UK, from identifying sites to constructing and operating them.
In the initial phase, RWE now employs a bespoke site searching model, built with ArcGIS, that automatically qualifies and highlights viable land parcels for solar energy, located within a designated distance of available grid capacity. This model takes into account a wide range of potential planning constraints and landscape features, including agricultural land classification, archaeology, other nearby energy sites, ecology, flood risk, land cover, terrain and visibility.
Next RWE uses ArcGIS for running automated feasibility assessments and looking at sites in a lot more detail. By conducting geospatial analysis with ArcGIS, the company can identify high, medium and low risks to the planning process at each potential location. All available information is brought together on interactive maps, enabling sites to be thoroughly analysed and evaluated before site visits take place. “ArcGIS provides a secure and stable system for loading, manipulating and analysing planning constraints to help determine threats to developments,” comments Ben Foster, Senior Analyst at RWE.
When solar projects become active, RWE uses ArcGIS Web AppBuilder to quickly create project-specific web apps that are used by over forty employees across the business. These apps make it very easy for everyone to view up to 200 layers of project data, all in one place, and better visualise sites in 2D and 3D. RWE also uses ArcGIS Field Maps to create mobile tools for project teams that enable them to view, capture and edit data whilst in the field, and integrate additional content (such as pictures and videos) directly into the web app for everyone to see.
Additionally, the company has trialled the use of ArcGIS Hub and ArcGIS StoryMaps, on selected projects, to improve the quality of public websites and consultations. These interactive tools helped RWE to share information with the public in a more engaging and accessible way, and the company received positive feedback.
“With our project-specific ArcGIS web and mobile apps, our teams can collaborate and share data far more easily.”
Ben Foster, Senior Analyst, RWE
Benefits
Faster identification of potential sites
RWE has significantly reduced the amount of time required to identify suitable land for large-scale solar projects from 5-10 hours to 5-10 minutes. Staff do not have to spend a huge amount of time visiting multiple websites, comparing different data sets or making unnecessary site visits or speculative calls to landowners as all this background work is done for them. “Site selection used to be a long-winded process that was very costly on companies’ resources,” explains Foster. “Our integrated ArcGIS tools enable insightful, planning-led decision-making.”
More successful planning applications
Using ArcGIS, RWE can now conduct faster feasibility studies and focus more readily on sites with the fewest potential planning constraints that are more likely to achieve planning permission. As a result, the company is achieving exceptionally high levels of success and reducing the time wasted on unproceedable projects. “Our approach has helped RWE to secure planning permission for over 98% of the projects it has worked on,” says Foster. “ArcGIS has been an essential tool in streamlining land identification, optimising feasibility studies and enhancing collaboration, helping the team to achieve such a high success rate.”
Highly efficient project delivery
The ArcGIS web apps and mobile tools created for project teams have transformed collaboration and data sharing within the business, enabling RWE to plan new solar energy installations more efficiently. Data collected in the field is instantly available to the whole project team, and time is not lost looking for information. Foster observes, “With our project-specific ArcGIS web and mobile apps, our teams can collaborate and share data far more easily. ArcGIS makes the whole process much more efficient.”
Well-received public consultations
In initial pilots, RWE found that the use of ArcGIS StoryMaps really enhanced the public consultation process, by making information available to people in a format that they could easily query and understand. Initial surveys conducted after public consultations clearly showed that the StoryMap had been well received. Now RWE is considering using ArcGIS StoryMaps on future projects, as well as embedding ArcGIS mapping into public websites, to help people understand the impacts of proposed projects and appreciate additional benefits, such as biodiversity net gain.
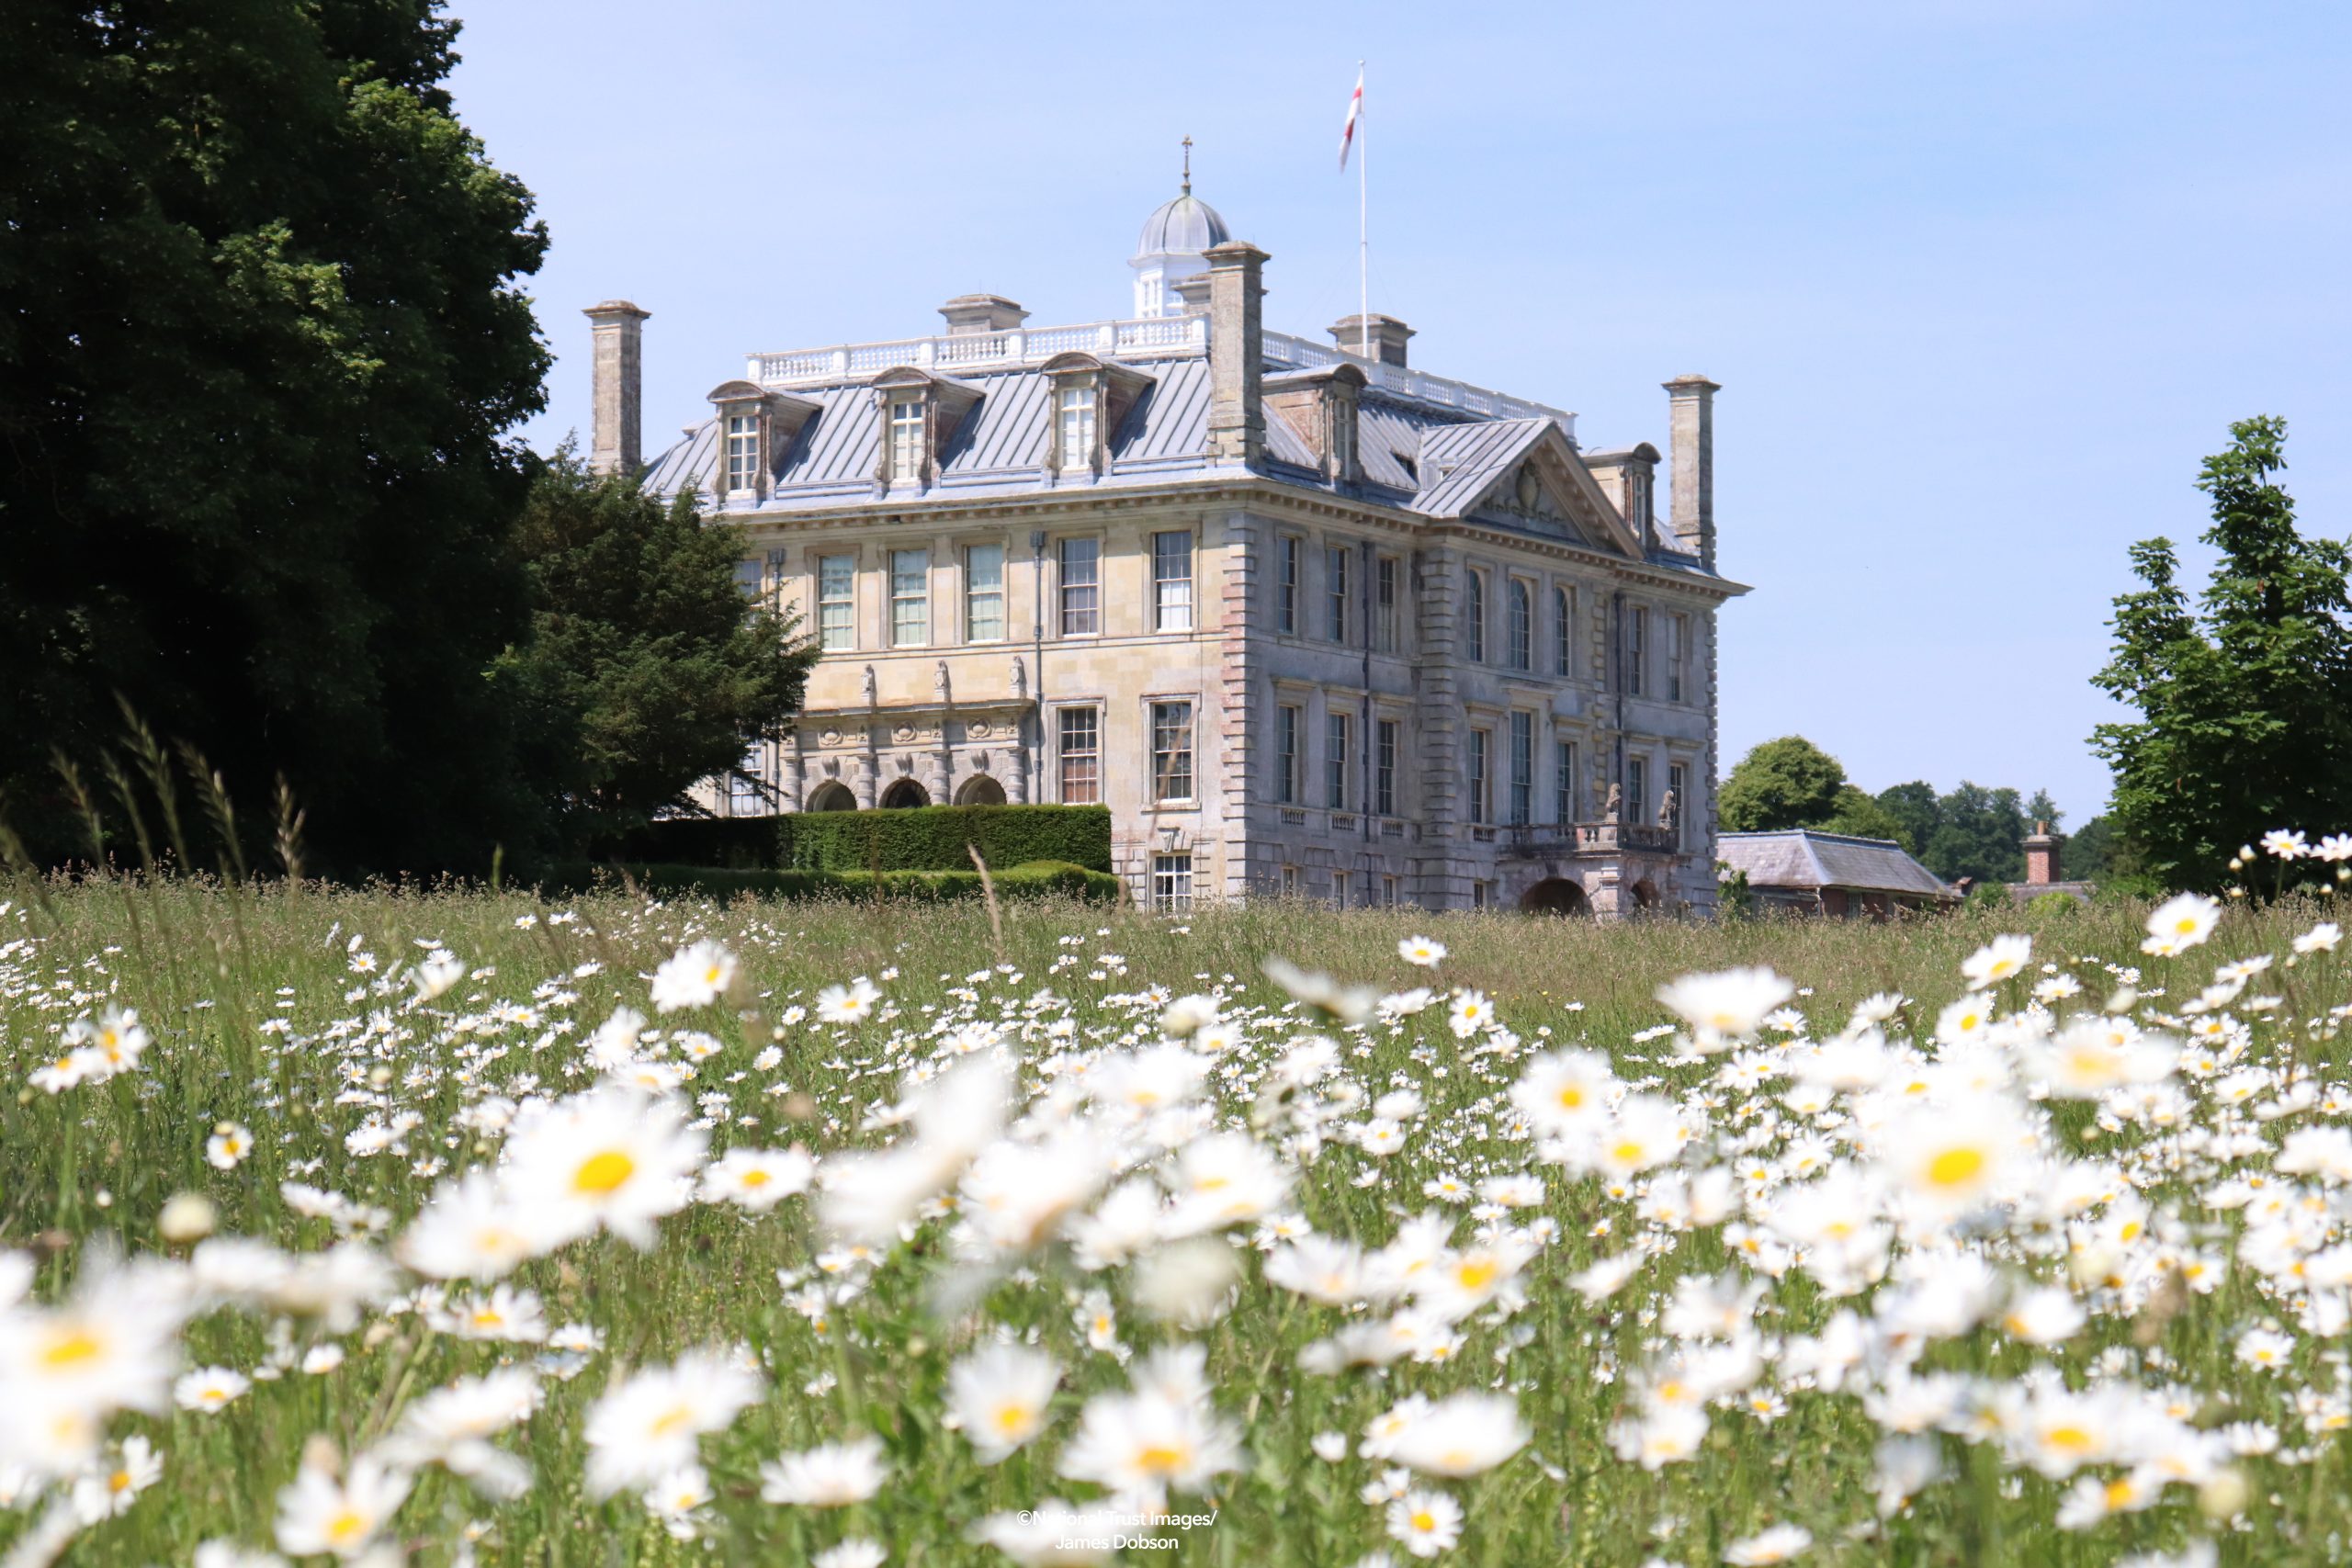
National Trust
After a decade of ArcGIS use, we can confidently say that GIS is enabling us to achieve our strategic goals, take action for climate change and make special places accessible to everyone, for ever.
For more than a decade, the National Trust has been using Esri’s ArcGIS system enterprise-wide to help it care for precious historic properties, ancient monuments and natural environments. Used by employees, partners and volunteers, dozens of ArcGIS mobile apps, web-based solutions, dashboards and other tools are helping the Trust to address the challenges of climate change and make special places accessible to everyone, for ever.
ArcGIS Online provides a single, enterprise-wide platform for meeting all the National Trust’s GIS needs
2,150 employees, as well as partners and volunteers, use a wide range of ArcGIS mobile apps, dashboards and web-based solutions
Esri UK supports the Trust with Professional Services, Data Services and an Extended Support Agreement
The Challenge
When the National Trust first started using geographic information system (GIS) technology, it had a piecemeal approach, with different teams using a variety of desktop GIS packages. Then, in 2014, the Trust took the decision to adopt Esri’s ArcGIS technology enterprise-wide to reduce the number of desktop licenses, improve data management and develop web-based GIS solutions. It was, at this time, poised to launch an ambitious ten year strategy for 2015-2025, and aimed to optimise the use of GIS to help it achieve key priorities, including ‘making everyone welcome’ and ‘taking action on climate change’.
“The analytical capabilities we gained were a real game changer”
Huw Davies, Head of Data, National Trust
The Solution
The centralised deployment of Esri’s ArcGIS system opened up lots of new opportunities for the National Trust. “Having a full suite of tools for the first time enabled the National Trust to expand GIS into a wider number of projects,” explains Mark Roth, Senior GIS Data Manager at the National Trust. “The fact it is easier for us to store and share data and develop enterprise solutions has also been hugely beneficial.”
Over more than ten years, the Trust has continually advanced its use of ArcGIS, developing a suite of mobile ArcGIS apps for rangers, ArcGIS Dashboards for monitoring organisational KPIs, crowd-sourcing data capture solutions for volunteers, ArcGIS StoryMaps to engage with the general public and more besides. The organisation has made particular use of ArcGIS Pro for data analysis, using it especially to research inequitable access to green spaces and plan new initiatives to improve sustainability. According to the Trust’s Head of Data, Huw Davies, “The analytical capabilities we gained were a real game changer.”
Today, the Trust is using ArcGIS in conjunction with artificial intelligence tools and remote sensing devices to capture more data, more consistently and gain insight into critical issues such as hedgerow loss, climate change and wildfire risks. “We can now make aerial imagery and remote sensing data available across the organisation in a consistent way,” highlights Keith Challis, Remote Sensing Coordinator at the National Trust. “This means we can optimise the use of remote sensing to monitor change on a huge scale.”
Throughout its journey with ArcGIS, the National Trust has benefited from expert support through Esri UK’s Customer Advantage Programme and an Enhanced Support Agreement. “There are lots of ways of doing similar things with GIS technology, and it has been beneficial to have experts on hand who can guide us,” reflects Ian Dawes, GIS Product Manager at the National Trust.
“Having a full suite of tools for the first time enabled the National Trust to expand GIS into a wider number of projects.”
Mark Roth, Senior GIS Data Manager, National Trust
Benefits
ArcGIS has played a pivotal role in helping the National Trust to deliver on the key ambitions set out in its 2015-2025 strategy. Notable benefits include:
Greater preparedness for climate change
The National Trust has used ArcGIS to create a ground-breaking Hazard Map that shows local teams what climate change actually means for their properties and land and helps them to start planning realistic, purposeful mitigations. In addition, the Trust is currently piloting a wildfire detection system that uses ArcGIS Dashboards and remote sensors to alert operational teams when risk levels increase so they can respond more quickly to protect properties and land.
Focused initiatives to improve nature
By conducting advanced geospatial analysis with ArcGIS Pro, the Trust has been able to ascertain where, on its land, it can affect the biggest improvements to the state of nature. In its Riverlands project, for example, it is now focusing its resources in locations where it can make a real improvement to wildlife habitats. It is working to reconnect streams on Exmoor, improving conditions for eels, otters, bats and a pair of recently reintroduced beavers.
Clear insight to enhance visitor experiences
The Trust is increasingly using mobile ArcGIS apps and GPS data to gather information about what people enjoy doing, and it uses this insight to improve the visitor experience. For example, at Flatford in Suffolk, visitors were given GPS devices, and the data collected was analysed in ArcGIS Pro to better understand where people walk, what the most common routes are and where visitors spend most time. Outputs were used as part of the Experience Design process to help develop robust cases for future investments.
More equitable access to beautiful places
In line with its key priority ‘for everyone, for ever’, the Trust has undertaken ArcGIS-based studies to better understand the proximity of properties and green spaces to people living in urban areas and, in particular, areas of deprivation. This research has underpinned initiatives such as the distribution of free single-use passes to encourage people from urban and deprived areas to visit their nearest National Trust property.
Improved collaboration with partners
By facilitating better data sharing and improved data analysis, ArcGIS is supporting key partnership projects including a ‘green corridors’ initiative with Sustrans that aims to improve sustainable access to special places like historic homes in and near towns. “Data is often the language of partnerships, so having a platform for sharing data and analysis of data with partners is exceptionally helpful,” Davies explains.