Blog Archives

Jacobs
We are helping to shape public transport in Scotland for the next 20 years, by using ArcGIS to analyse, visualise and share data about the accessibility of current and proposed transport networks.
The technical consulting firm Jacobs has built a tool using ArcGIS that analyses the accessibility of public transport in Scotland and displays data in highly visual and interactive web maps and dashboards. Delivering enlightening evidence about public transport needs, the tool is now being used to help Transport Scotland make crucial investment decisions for the future.
Analysis of 2 million locations, 53,000 transport stops and 7,000 key destinations is conducted with ArcGIS Pro
Accurate, nationwide data is displayed visually in interactive, easy-to-use web maps, created with ArcGIS Online
Users can easily view and query data on actual and proposed transportation systems using ArcGIS Dashboards
The Challenge
Transport Scotland had an important, yet complex, question to answer. How should the public transport network in Scotland be developed over the next twenty years to make it accessible to more people, encourage more sustainable travel choices and support the Scottish economy? It launched a Strategic Transport Project Review and appointed Jacobs to help it gather the data and insight it needed to enable ministers to make evidence-based decisions about future investments in public transport services.
The challenge for Jacobs was enormous. Existing public transportation modelling tools had considerable limitations, and public transport behaviour could not be reported or analysed at national, regional and local levels. Jacobs therefore set out to create a new tool for analysing, modelling and displaying transportation data that could be used easily by many teams for different purposes during the Strategic Transport Project Review and other projects in the future.
“The spatial components of the tool were imperative to assist in analysing the public transport accessibility across Scotland.”
Kyle Chesney, Principal Transport Planner, Jacobs
The Solution
A specialist geographic information system (GIS) team at Jacobs built the new solution using Esri’s ArcGIS software and ArcGIS web apps in combination with other technologies. Called the National Public Transport Accessibility Tool (NaPTAT), it considers over 2 million potential journey origin points (from a 200m x 200m grid), takes into account the frequency of public transport services from over 53,000 public transport stops and calculates journey times to over 7,000 key destinations relating to employment, education, healthcare, retail and food stores.
Jacobs used the Network Analyst capabilities of ArcGIS Pro to calculate the distance and walking or cycling time between each point of journey origin and the nearest public transport stops, within a threshold distance. It then used the Network Analyst outputs and Python scripting to calculate specific accessibility scores based on the number of public transport stops nearby, the distance away and the frequency of services at these locations. “ArcGIS Pro was one of the most important solutions we used, as it helped identify public transport in the vicinity of each point of origin, as well as the destinations that can be directly accessed by walking or cycling from any of the origin points,” explains Jaime Rodriguez Gozalo, Principal GIS Consultant at Jacobs.
Next, Jacobs used ArcGIS Online to build a web app that enables people to visualise the transportation data on an interactive map of Scotland alongside relevant third party data, such as the Scottish Index of Multiple Deprivation. Users can zoom into the map, turn different layers of data on and off and interrogate the data to gain insight.
As a further extension to NaPTAT, Jacobs also created a series of interactive ArcGIS Dashboards, enabling users to not only view the data but also customise it for their own study. One dashboard displays the current performance of public transport in Scotland, while another shows comparisons between the current status (baseline results) and modelled improvement scenarios.
“We were not only able to create one single, detailed database of results, but we were able to really go to town using Esri’s online suite of applications to display this in the best way possible for all the teams involved in the project.”
Leigh Wilson, GIS Analyst, Jacobs
Benefits
Improved understanding of public transport accessibility
ArcGIS Pro and Network Analyst provide the core analysis capabilities of the NaPTAT solution, revealing just how accessible public transport services are, at each location and for discrete groups, such as people travelling to employment in urban areas, as compared to rural jobs. Recognising the key role played by ArcGIS in NaPTAT, Kyle Chesney, Principal Transport Planner at Jacobs, says, “The spatial components of the tool were imperative to assist in analysing the public transport accessibility across Scotland.”
Clear visualisations of complex, nationwide data
ArcGIS Online is another core component of the NaPTAT solution, as it has enabled Jacobs to display the results of its nationwide transportation analysis in a highly visual way, on interactive maps and dashboards. Consequently, it is much easier for users to identify previously hidden patterns and accessibility issues. “We were not only able to create one single, detailed database of results, but we were able to really go to town using Esri’s online suite of applications to display this in the best way possible for all the teams involved in the project,” says Leigh Wilson, GIS Analyst, Jacobs.
A flexible, easy-to-use analysis tool
Using ArcGIS Online, Jacobs has been able to build a tool that is incredibly easy for people from a wide variety of teams to use, without having to reach out to the GIS team for support. The ArcGIS Dashboards for example, give users just the information they need, in a format that they can easily interact with to find the answers to their questions. “The data, information and conclusions can all be interrogated, filtered and used by anyone,” Wilson says. “You really don’t need to know how to use GIS to analyse these results or make any sort of calculations.”
Tangible evidence to inform future transport investments
Most importantly, the NaPTAT solution has met the needs of Transport Scotland and is now being used to gather evidence to inform new public investments. For example, users can clearly see on the ArcGIS Dashboard that proposed changes to the transportation network in the Edinburgh and South East region will enable over 25,000 more people to access a hospital in under 30 minutes, in what will be a major improvement to the public transport network.


Vodafone
We have created a digital twin using ArcGIS that is helping us to maintain a high quality of service for customers, reduce carbon emissions and operate more efficiently.
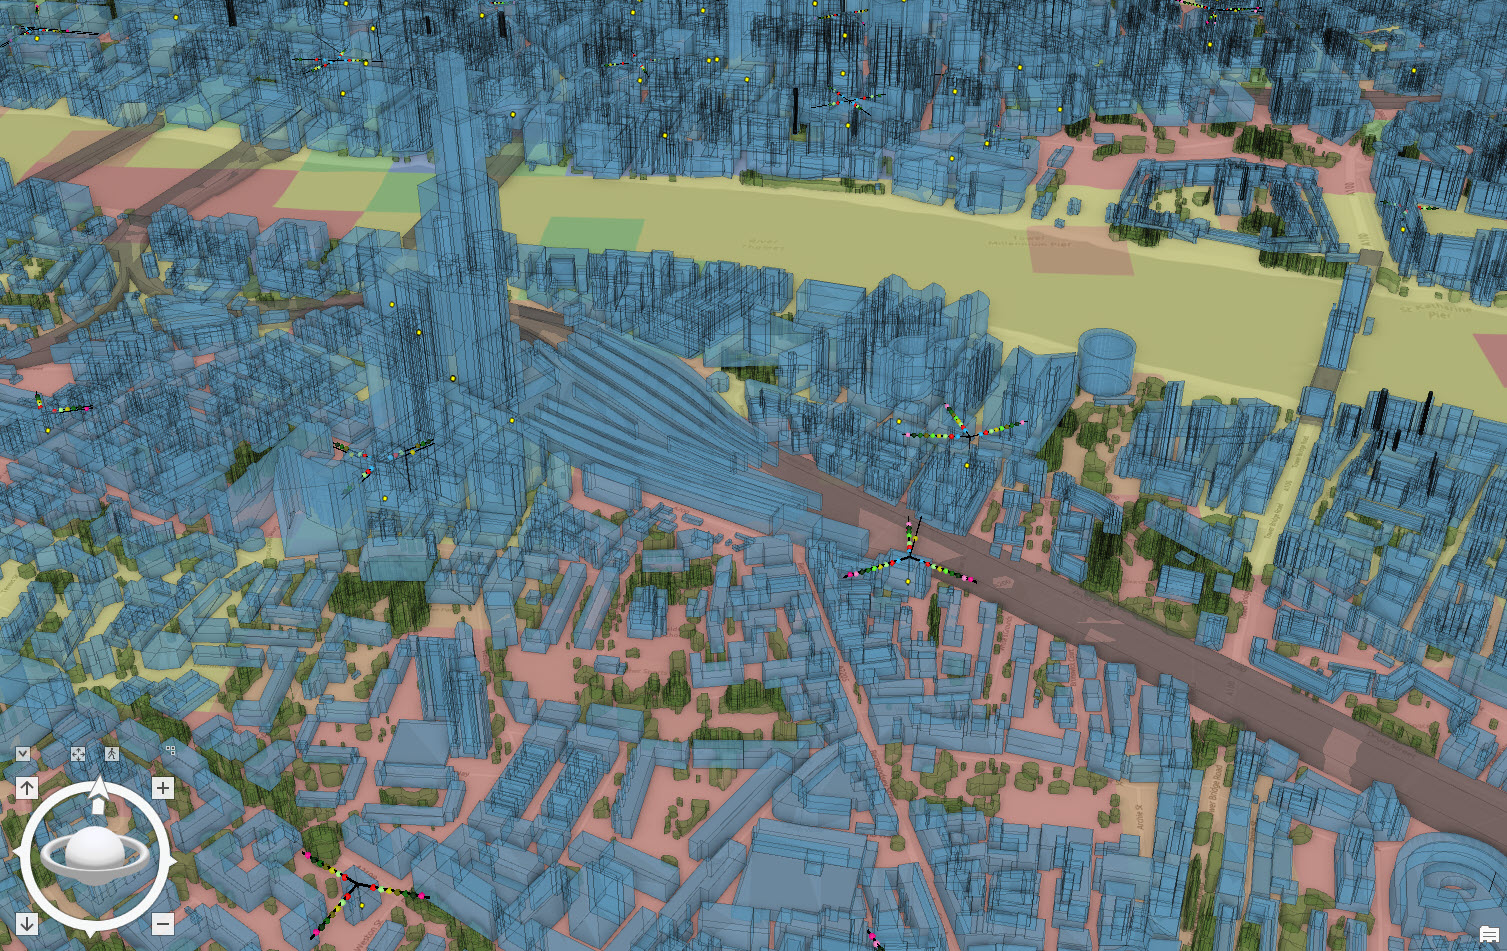
The leading communications company Vodafone is taking steps to maintain mobile signal strength across the UK, using a digital twin built on ArcGIS Enterprise. With a 3D model of its network, assets and the environment, the company can keep society connected, while operating more efficiently and reducing carbon emissions.
Digital twin provides a first-ever 360 degree view of Vodafone’s communications network and how it operates
Over 40 million environmental features and nearly 500,000 network features are mapped in 3D using ArcGIS Enterprise
Engineers can assess the impacts of tree growth or new buildings on signal strength and network performance, from their desktops
The Challenge
With 300 million mobile customers worldwide, Vodafone’s aims are to keep people, businesses and communities connected and help build a digital future for everyone. The company is at the forefront of the 5G revolution in the UK, but high frequency mobile services like 5G require a clear line of sight to operate effectively. If a new building is constructed, an existing building is extended or tree growth occurs, this line of sight can be obstructed, resulting in a degradation in mobile signal strength. Consequently, Vodafone needs to proactively monitor new buildings and tree sizes and plan proactive network enhancements to mitigate the impacts of this ‘clutter’ and maintain a high quality of service for customers.
“Our customers are really important to us here at Vodafone and we believe, with the help of this new digital twin, we can continue to deliver fantastic service to our millions of customers.”
Boris Pitchforth, Lead Architect, Vodafone
The Solution
Vodafone had begun to invest in 3D modelling and explore potential uses for a digital twin – a virtual, 3D representation of the mobile network and the surrounding environment. Rebecca King, former Geographic Information System (GIS) Lead at Vodafone says, “When I first started doing GIS, digital twin was not a possibility, but the technologies have developed so much that we can make digital twin a reality now.”
Soon, the organisation realised that a digital twin could prove invaluable in helping it to identify clutter. “It occurred to our team, what if we could create a digital twin for connectivity across the UK,” explains Boris Pitchforth, Lead Architect at Vodafone. “It would surely make our system more robust if we could scrutinise the topography of the environment and assess the impacts of tree growth or new construction developments on signal strength and network performance.”
Energised by this vision, Vodafone used ArcGIS Enterprise to model its UK assets and the wider environment in 3D and added relevant data sets to create and enrich a digital twin. Described by Boris Pitchforth as a “really immersive experience,” the project enabled Vodafone to gain a 360 degree view of its communications network in the UK and how it operates. “Using ArcGIS Enterprise and cloud infrastructure capabilities, we have been able to create something special,” he says.
“When I first started doing GIS, digital twin was not a possibility, but the technologies have developed so much that we can make digital twin a reality now.”
Rebecca King, former GIS Lead, Vodafone
Benefits
Unprecedented understanding of mobile network
The digital twin created with ArcGIS Enterprise gives Vodafone a detailed view of its UK mobile network and the wider environment for the first time. Employees can see, in one place, on a single map, over 40 million environmental features, such as trees, hills and buildings, and nearly 500,000 network features like mobile phone masts. “Our ArcGIS digital twin is giving us an unprecedented understanding of our entire UK network,” says Johenny King Puente, Network Specialist at Vodafone. “With this level of detail we can make decisions faster and with more accuracy.”
Fantastic service for millions of customers
Most significantly, the digital twin makes it easier for Vodafone to identify changes in the environment and identify clutter that might be causing a degradation in service. As a result, the company’s engineers can implement mitigations more quickly to deliver a more consistent service to customers. “Our customers are really important to us here at Vodafone and we believe, with the help of this new digital twin, we can continue to deliver fantastic service to our millions of customers,” Boris Pitchforth says.
Improved operational efficiency
Through the ongoing use of the digital twin, Vodafone expects to be able to make significant and sustained operational efficiencies. For example, engineers now have detailed information available at their fingertips, all in one place, and spend less time looking for the data they need. The 3D models also give engineers a good understanding of the wider environment and locations of clutter, from their desks or using mobile devices, enabling them to make well-informed decisions more quickly and accelerate business processes.
Lower carbon emissions
Like most organisations, Vodafone is working hard to reduce the environmental impacts of its operations and it believes that its digital twin will help it achieve its ambitious target for carbon emissions. Already the digital twin is helping by reducing the number of field trips and site visits that engineers need to make. “We have pledged to eliminate carbon emissions from our operations by 2027,” Boris Pitchforth says. “With operational developments and innovations like digital twins, we can achieve this.”
Historic England
We are helping people to discover and explore the rich archaeology of England by making our images and the mapping derived from them, accessible via ArcGIS
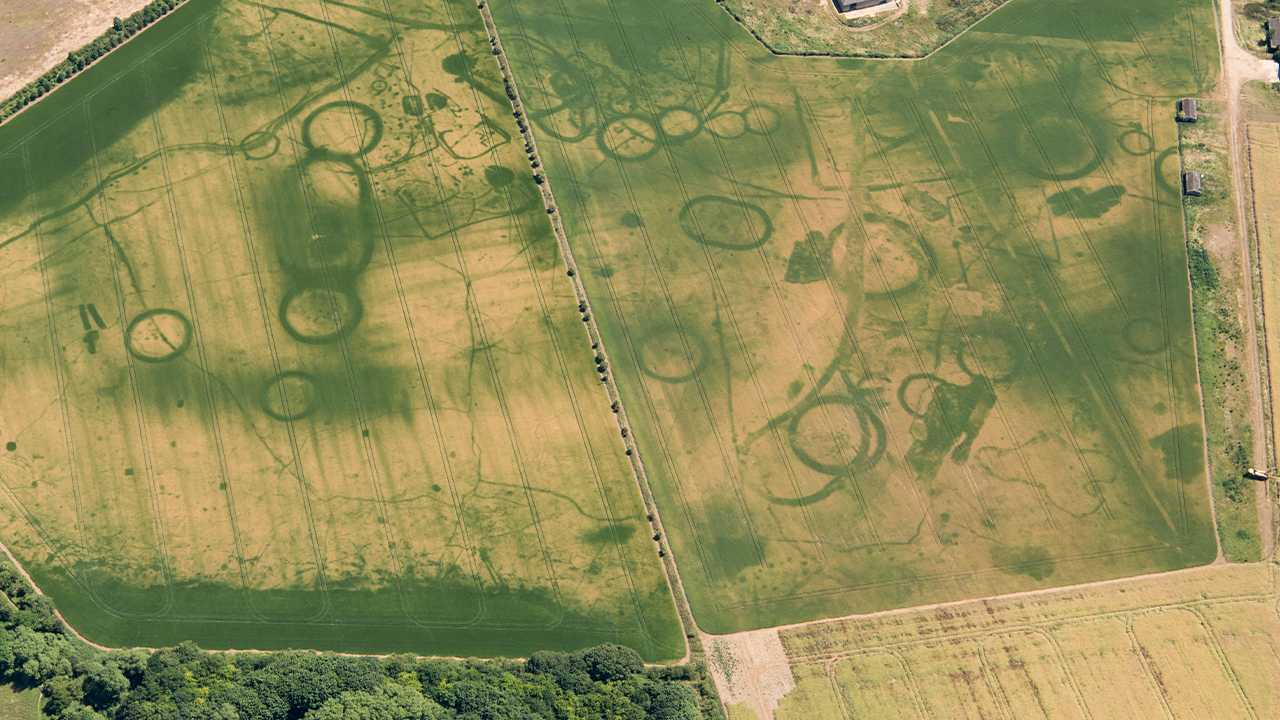
Historic England is the custodian of millions of precious archive resources ranging from the very first balloon flights to the latest photography of England’s highstreets and every photographic image, map and illustration you can imagine. The organisation has now embarked on a journey to digitise, standardise and share its archaeological data and images using ArcGIS, to help more people discover and explore England’s rich archaeology.
Data from tens of thousands of historic images have been digitised, analysed, cleaned and standardised using ArcGIS Pro
Over 30 years’ of aerial mapping and interpretation and more than 450,000 specialist photographs can be accessed via apps created with ArcGIS Web AppBuilder
New apps can be built quickly to support specific projects, making archaeological imagery, maps and data easy to find and understand
The Challenge
For over thirty years, Historic England, its predecessor organisations and other heritage bodies funded by it have been identifying, mapping and recording England’s archaeological sites using aerial photographs and, more recently, airborne laser scanning (lidar). In addition, Historic England has amassed over 6 million oblique and vertical photographs recording England’s changing landscape over the past century.
Recognising the huge value of these resources, Historic England wanted to find a way to share its vast archive of archaeological mapping data and images in a way that would be accessible to everyone. First, however, it had to overcome the formidable challenges posed by digitising, standardising and consolidating resources that were in a myriad of different digital and paper-based formats.
“The combination of the desktop and web-based ArcGIS software made a real difference; we could not have got to where we are without using them.”
Simon Crutchley, Remote Sensing Development Manager, Archaeological Investigation, Historic England
The Solution
A long-time user of products from Esri’s ArcGIS suite of geographic information system (GIS) solutions, Historic England began by using ArcGIS Pro on the desktop to clean up its historic data. ArcGIS Pro was particularly effective at processing old computer-aided design (CAD) files, eliminating errors and inconsistencies to create a standardised output. “Using desktop GIS software gave us a way of quality controlling our data in a way that was impossible in a CAD environment,” says Simon Crutchley, Remote Sensing Development Manager at Historic England.
Next, the organisation explored ways to visualise and share its data and maps. It began by creating an ArcGIS StoryMap with ArcGIS Online to enable people to explore Historic England’s aerial imagery of Capability Brown gardens. The StoryMap highlighted all sites associated with the renowned landscape designer across England and allowed people to click on individual locations to access more information. “The Capability Brown StoryMap became a proof-of-concept for how we might use ArcGIS to provide all our digital maps and imagery to a wider public,” Crutchley says.
The organisation went on to create the ground-breaking Aerial Archaeology Mapping Explorer app (AAME). Built using ArcGIS Web AppBuilder, this solution provides easy access to all the mapping and interpretation work carried out by Historic England’s Aerial Survey team, in one place, to a standardised level, for the first time. It includes a query tool and allows users to zoom into specific archaeological features, such as camps along Hadrian’s wall. Clicking on these features brings up details about the type of camp, its age and how it appears today with hyperlinks to more historical information.
To complement AAME, Historic England subsequently created another app with ArcGIS Web AppBuilder, called the Aerial Photo Explorer app (APEX), for sharing original photographs. Currently, around 400,000 specialist oblique photographs and 50,000 vertical photographs of archaeological sites are available via APEX, in full resolution. The organisation aims to steadily share more of it 6 million images using APEX and future solutions built with ArcGIS Experience Builder.
“People are interested in England’s historic places if they can find information easily in an accessible form, and that’s what we’ve been able to deliver in the Archaeological Mapping Explorer.”
Simon Crutchley, Remote Sensing Development Manager, Archaeological Investigation, Historic England
Benefits
Improved public access to specialist resources
Anyone interested in local history can now use AAME to gain easy access to over thirty years of mapping and interpretation carried out by Historic England and other organisations grant-aided by it. People can also explore over 450,000 images using APEX to find out more about historic sites. “The combination of the desktop and web-based ArcGIS software made a real difference; we could not have got to where we are without using them,” Crutchley says.
Tailored apps for specific projects
Using ArcGIS, Historic England can quickly build tailored apps that make data and imagery relating to specific projects available in an accessible and meaningful format. For example, Historic England used ArcGIS Web AppBuilder to create a dedicated interactive map of Cannock Chase in Staffordshire, one of the best-preserved First World War sites in England. The map enabled Historic England to share lidar imagery and other data with a large number of local volunteers who were involved in a project to assess the remains of camps where 500,000 men trained before heading to the front line.
Deeper understanding of archaeological sites
Together, AAME, APEX and Historic England’s project-specific mapping apps are helping people to better understand archaeological sites, by making a wide range of resources more accessible to more people than ever before. “A collection of photographs on its own doesn’t constitute knowledge,” Crutchley explains. “It is only by bringing together imagery, mapping and reports and presenting it all geospatially on an interactive digital map, that we can help people gain a deeper understanding of the archaeology of England.”
A positive response from the public
The public response to Historic England’s ArcGIS apps has been incredibly positive. When, for example, AAME was launched, the story received 33,560 news page views and generated 37 pieces of media, making it Historic England’s best ever website news story to date. Then, in the first three months alone, it received over 137,000 views. “The success of the launch showed us that people were interested – not just in the historic environment, but in maps specifically,” Crutchley says. “People are interested in England’s historic places if they can find information easily in an accessible form, and that’s what we’ve been able to deliver in the Archaeological Mapping Explorer.”

Transport for West Midlands
ArcGIS Hub provided an invaluable platform for sharing data with partners in the lead-up to the 2022 Commonwealth Games in Birmingham
During planning for one of the largest sporting events ever staged in the UK, Transport for West Midlands used ArcGIS Hub to work collaboratively with partners. New operational information became available on an almost daily basis, and ArcGIS Hub gave over 50 partners instant access to the most up-to-date versions of 62 data sets, on demand, ensuring all decisions were made based on a single version of the truth.
ArcGIS Hub enabled public and private sector organisations to share the same, up-to-date and accurate data securely
Non-GIS users could view data, maps and charts online, directly from the ArcGIS Hub, with little or no training
GIS users could download datasets, in any format, into their in-house systems, and integrate it with their own data
The Challenge
As the transport arm of the West Midlands Combined Authority, Transport for West Midlands was – from the outset – heavily involved in planning for the 2022 Commonwealth Games in Birmingham. This high-profiled, international competition was the largest multi-sport event ever to take place in the West Midlands and was due to attract over a million spectators from outside the region, as well as world-leading sportspeople, trainers, media and visiting dignitaries.
Early in the planning process, Transport for West Midlands discovered that three of its partner organisations were using slightly different versions of the Games Route Network, a map showing all the priority routes that athletes would be taking from their accommodation to various venues around the city. The Games Route Network was, however, just one of over fifty maps showing operational data relating to the event, and there were about thirty initial stakeholders. Transport for West Midlands was concerned that if all of the partners had different versions of all the maps, people in these organisations could inadvertently make decisions based on obsolete information.
“The amount of organisations that signed up to use the ArcGIS Hub showed just how valuable it was.”
Liz Brannan, Mapping Analyst, Transport for West Midlands
The Solution
Transport for West Midlands is a long-standing user of Esri geographic information system (GIS) technology so it immediately explored Esri’s ArcGIS suite for a solution to this challenge. It discovered ArcGIS Hub and quickly set about using this easy-to-configure, cloud-based collaboration platform to enable it to share up-to-date data securely with all of the organisations involved in the planning of the 2022 Commonwealth Games.
In the lead-up to the event, Transport for West Midlands shared 62 different data sets via ArcGIS Hub on everything from sporting venues and marathon routes to the locations of emergency facilities and public transport diversions. Partners could, for example, log in to view or download the most accurate map of the Games Route Network, as well as maps showing traffic management plans around key venues. Eventually, over 50 organisations signed up to use ArcGIS Hub, including local authorities, utilities, transportation companies, logistics providers and emergency services.
Partners found the ArcGIS Hub very simple and straightforward to use. Any organisations that did not have in-house GIS expertise could access and view data, documents, apps and maps from within the hub. Meanwhile, other organisations could download the data they needed, in the format of their choice, directly into their internal GIS systems, and more than 7,500 downloads were made in total. An application programming interface (API) embedded in the hub automatically sent out alerts to partners when revised versions of datasets became available to ensure they were always using current data.
“ArcGIS Hub broke the barrier between GIS users and those who don’t work with GIS every day, enabling all of our partners to access quality data on demand.”
Liz Brannan, Mapping Analyst, Transport for West Midlands
Benefits
Better collaboration, with one version of the truth
Using ArcGIS Hub, Transport for West Midlands was able to provide a single source of data that all partners in the region could use to make sure that their planning was based on the most up-to-date information. This undoubtedly improved collaboration between the dozens of public and private-sector organisations involved in coordinating what was a large-scale and complex, international event. “During planning for the Commonwealth Games, things changed frequently,” recalls Liz Brannan, Mapping Analyst at Transport for West Midlands. “Despite the fast-evolving situation, ArcGIS Hub ensured everyone was working from the same version of the truth, all the time.”
Effective planning for a major event
By making information about the 2022 Commonwealth Games more easily accessible, the ArcGIS Hub supported the planning processes of around 50 organisations. Utilities companies used data from ArcGIS Hub to plan emergency works to avoid unnecessary traffic disruption in the build-up to the games, while courier companies used ArcGIS Hub to notify customers in advance of potential delays in areas where cycling time-trials and running events were due to take place on local roads. “The number of organisations that signed up to use the ArcGIS Hub showed just how valuable it was,” Brannan says. “ArcGIS Hub allowed everyone to view the same data, at the same time, and make their plans without duplicating effort.”
Reliable information to support emergency services
Critically, ArcGIS Hub provided reliable information that could be depended upon by emergency services, including the ambulance service, fire service and police in the West Midlands. As a result, these organisations could plan ahead and put measures in place to help them respond effectively to incidents when they needed to. They could see in advance, for example, which roads were going to be closed for marathon events, identify the locations of check points and find alternative routes to avoid areas that might be crowded with spectators walking to or from venues.
Inclusive approach to sharing data
The ArcGIS Hub proved particularly successful in making data accessible to GIS experts and non-GIS users alike. It was used by large organisations including the water utility and the University of Birmingham, as well as small local charities. “Our ArcGIS Hub for the Commonwealth Games enabled us to bring partners of all kinds and all sizes together to share the best quality data,” explains Brannan. “ArcGIS Hub broke the barrier between GIS users and those who don’t work with GIS every day, enabling all of our partners to access quality data on demand.”

National Highways
Consolidating our geospatial data and creating a single spatial portal with ArcGIS Enterprise has enhanced the value we gain from our geospatial data assets.
After realising the true value of its geospatial data assets, National Highways put geospatial data right at the heart of its business, creating a single, centralised spatial portal with the ArcGIS system. Now, geospatial data is used more extensively than ever before and employees have the real-time insight, accurate network models and innovative tools to work efficiently right across the organisation.
4,000 people now use geospatial data routinely, accessing it via a centralised spatial portal created with the ArcGIS system
Six slightly differing road network models have been combined and enhanced with Sweet for ArcGIS, creating a single version of the truth
Operational staff can view real-time data on traffic, weather and road incidents using an operational system developed with ArcGIS Velocity
The Challenge
Through a ground-breaking asset evaluation initiative, National Highways valued its data at £60 billion and discovered that geospatial data was the most used and most critical data asset of all. This realisation quickly elevated the conversation about geospatial data to a senior level within the organisation, and National Highways began to consider how it could use geospatial data more effectively. Some of its key data sets relating to the national road network were inconsistent, and its use of a myriad of different systems for storing, editing and viewing geospatial data was hampering innovation.
“Around 4,000 people now use National Highways’ geospatial data. This clearly shows how, in just two years, our ArcGIS system has become front and centre in how we work.”
Jon Drea, Head of Data Science, National Highways
The Solution
With its new appreciation for the value of geospatial data, National Highways took the strategic decision to centralise its geospatial data and services, creating a single ‘Spatial Portal’ for the whole organisation. It selected Esri UK’s Managed Cloud Service and began to use solutions from Esri’s ArcGIS system, including Esri’s ArcGIS Enterprise and ArcGIS Online, to replace its many existing, disparate departmental geographic information system (GIS) applications.
As a critical part of this transition, National Highways used Esri’s Sweet for ArcGIS app to help it consolidate road network data from several legacy systems and create one comprehensive digital model of the national road network. The organisation took advantage of the built-in quality checking capabilities of Sweet to create a single, accurate source of the truth that could be depended upon by all employees, across the business.
With support from Esri UK’s Professional Services group, National Highways then used the ArcGIS system to build a wide range of apps, data models and other GIS services to enable employees to make better use of geospatial data as a part of their day-to-day roles. Chief amongst these solutions is a new operational system that helps 400 operational staff at National Highways to manage disruption to the road network. This pivotal solution uses ArcGIS Velocity to display multiple feeds of real-time data, from weather forecasts from the Met Office and the live locations of gritting lorries to crowd-sourced traffic data from WAZE and up-to-the-minute reports of road incidents.
National Highways has also used ArcGIS Hub and ArcGIS Survey123 to help it engage the public in a consultation called ‘Route Strategies’, about the future of the national road network. Individuals could explore the road network online and click on sections of road to comment on them. This use of ArcGIS Hub and ArcGIS Survey123 proved very effective within the consultation period.
“ArcGIS Enterprise is helping us to maximise the value that we gain from our geospatial data, by enabling us to use it in really different use cases, from analysing live traffic flow to engaging with stakeholders and strategic planning.”
Jon Drea, Head of Data Science, National Highways
Benefits
Enterprise-wide efficiency gains
Now, for the first time, all employees at National Highways have the same, accurate digital view of the road network, whether they work in planning, ecology, major projects or operations. Furthermore, this road network data is accessible to more people and is easier to use in a wider variety of projects, all of which improves efficiency throughout the business. “Around 4,000 people now use National Highways’ geospatial data,” says Jon Drea, Head of Data Science at National Highways. “This clearly shows how, in just two years, our ArcGIS system has become front and centre in how we work.”
Increased value from geospatial data assets
While National Highways already valued its geospatial data highly, the organisation is now undoubtedly gaining increased value from its geospatial data assets by using the ArcGIS System to develop new solutions such as the operational system and the public consultation hub. “ArcGIS is helping us to maximise the value that we gain from our geospatial data, by enabling us to use it in really different use cases, from analysing live traffic flow to engaging with stakeholders and strategic planning,” Drea says.
More information about road traffic incidents
Of the many new solutions that National Highways has introduced since migrating to the ArcGIS system, the operational capability has delivered significant benefits. It provides an accurate digital representation of the entire national network of trunk roads, together with real-time data on traffic, weather and road closures, equipping staff with more information about road traffic incidents. “We can continue to react to incidents in near real-time with more information available, which helps us to provide a better experience for road users,” explains Drea.
Reduced total cost of GIS ownership
Driven by the dual goals to ‘reuse and consolidate’, National Highways has, over a two-year period, replaced more than a dozen standalone GIS applications with ArcGIS Enterprise, reducing total GIS costs by more than 10% to date. More legacy systems are due to be retired in the near future and the upcoming replacement of a geospatial system for viewing survey data is expected to deliver an annual cost saving of £250,000 alone.
Rapid delivery of decision-support tools
One of the key advantages of National Highways’ consolidated approach to GIS is that the organisation can now use its central ArcGIS Enterprise system to spin up new apps, data models and decision-support tools very quickly, on demand. Providing an example, Drea recalls: “When Britain left the EU, we built a solution to model scenarios for traffic disruption around ports. We published a dashboard to show the impacts of the potential congestion, really quickly, which supported decision making and helped us understand traffic flow.”
East Lothian Council
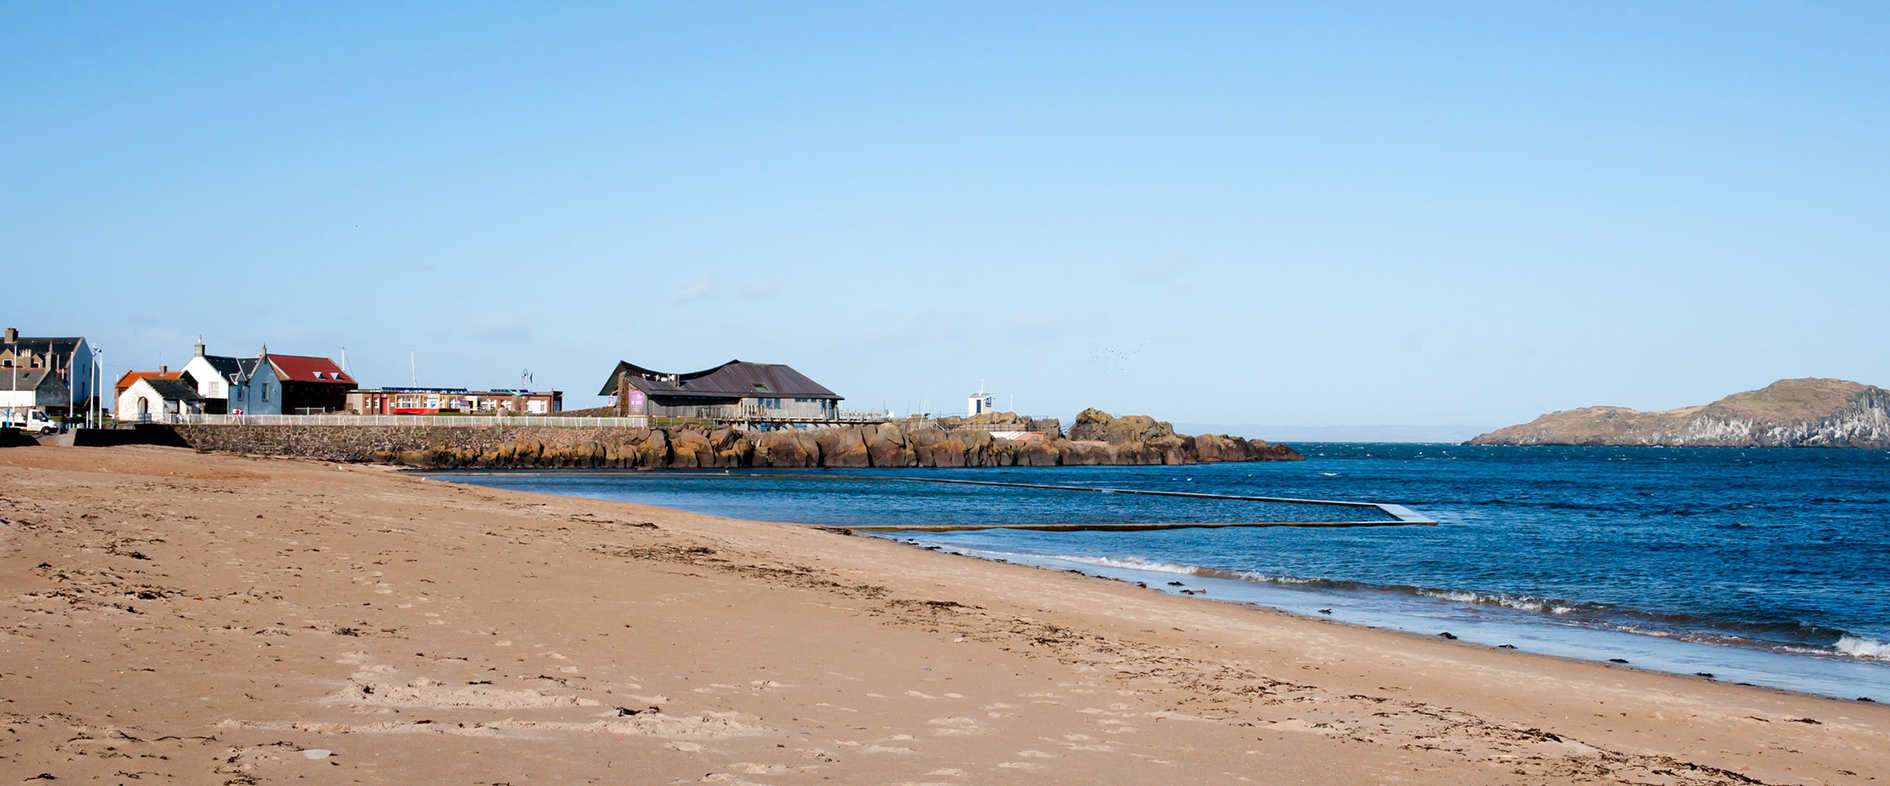
Through a highly successful collaboration with EDINA at the University of Edinburgh we are now using ArcGIS and real-time data to support responsible tourism.
A new mobile app, developed at the University of Edinburgh for East Lothian Council, enables members of the public to see which beaches are busiest in East Lothian and find local amenities. Combining ArcGIS with the Internet of Things, this innovative solution is reducing congestion at popular coastal hotspots and helping to encourage more responsible tourism.
Visitors use a mobile app, developed with ArcGIS AppStudio, to find up-to-the-minute information
Council employees monitor the busyness of car parks in real-time using an ArcGIS Dashboard
Rangers view live data in the field and can update car park status information manually using ArcGIS Survey123
The Challenge
In popular tourist destinations, a careful balance has to be found between meeting the needs of visitors, supporting the local economy and protecting the natural environment. Finding this balance is a particular challenge along the coast of East Lothian. 77% of people who visit the county go to the beach, but most visitors tended to head for the same, well-known coastal car parks, which often led to traffic congestion, frustration for drivers and unsustainable pressure on the environment in these tourist hotspots.
East Lothian Council wanted to increase the movement of visitors around the area and encourage visitors to go to less popular, but equally beautiful beaches just a little further along the coast. At the same time, it wanted to make visitors more aware of local businesses not far from beaches, to support growth in the local economy.
“The Visit East Lothian app directs people away from busy beaches to quieter ones and helps them to enjoy more of the region’s coastline and local amenities.”
Claire Dutton, Tourism Officer, East Lothian Council
The Solution
An innovative solution to this challenge was developed for East Lothian Council by EDINA, a directorate within the Information Services Group at The University of Edinburgh, with government funding through the Edinburgh and South East Scotland City Region Deal.
EDINA worked with the university’s Internet of Things Data Technology Group, which set up sensors at ten car parks across the region. EDINA then built a mobile app using ArcGIS AppStudio to display live data from the sensors and show the number of cars entering and leaving car parks. Called ‘Visit East Lothian’, the Android and iPhone app displays a list of beach car parks and uses the remotely sensed data to show, for each, whether the car parks are full, very busy, busy or quiet. Users can scroll through the different beaches for more information and see nearby businesses, such as cafes, museums and accommodation.
“Visit East Lothian combines live information on traffic movements with geospatial data on the nearest local amenities,” explains Anne Robertson, Head of Services at EDINA. “This project is a great example of data driven innovation in the public sector and demonstrates the real value that can be derived from combining geospatial technology with the Internet of Things.”
Alongside the Visit East Lothian app, EDINA built an ArcGIS Survey123 app, enabling rangers to adjust car park occupancy rates manually, if necessary. EDINA also created an ArcGIS Dashboard for council staff that provides more detailed, live information about the concentration of visitors along the coast. “The ArcGIS Dashboard shows the council what the situation is, right now,” clarifies Guy McGarva, Geospatial Consultancy Services Manager at EDINA. “Council employees can see the precise number of available spaces across all car parks and monitor real-time trends in car park utilisation, from their desktops, for the first time.”
“This project is a great example of data driven innovation in the public sector and demonstrates the real value that can be derived from combining geospatial technology with the Internet of Things.”
Anne Robertson, Head of Services, EDINA, The University of Edinburgh
Benefits
An improved visitor experience
The Visit East Lothian app improves the visitor experience by showing people which beach car parks are busy and helping them discover other nearby beaches that are less crowded. Promoted through various media, the app was very well received and downloaded 2,350 times in the first four months alone. “The visitor experience is crucial for the tourism industry; if people don’t have a good time, they won’t come back,” says Claire Dutton, Tourism Officer at East Lothian Council. “The Visit East Lothian app directs people away from busy beaches to quieter ones and helps them to enjoy more of the region’s coastline and local amenities.”
Proactive management of congestion
The ArcGIS Dashboard gives the council live information which it can use to better manage visitor numbers at specific locations and anticipate where issues may arise. Rangers can see the car parks that are filling up quickly, foresee traffic congestion, open overflow car parks and take other measures to reduce the adverse impacts of tourism traffic on local residents. Traffic officers can also use the app to ensure they focus their time on patrolling the busiest car parks. “We can be much more proactive now and intervene to help prevent and alleviate overcrowding issues at popular beach car parks,” Dutton says.
Reduced pressure on the natural environment
East Lothian Council is a strong advocate of responsible tourism and supports a variety of initiatives that encourage people to respect and protect the coast and countryside of East Lothian. By helping to distribute visitors more evenly along the coastline, the Visit East Lothian app will help to reduce issues such as overflowing bins and parking on verges, which can harm wildlife and damage fragile habitats. In the future, the council could put messaging on the app to direct people away from specific locations at certain times of the year, such as during bird nesting times.
A welcome boost to the local economy
The Visit East Lothian app supports the local economy by promoting East Lothian’s tourism businesses. Users of the app can search near their current location or near a specific car park to find information about local cafes, restaurants, museums, shops and other businesses. “Tourism is vital to the economy of East Lothian and employs 10% of the local workforce,” explains Dutton. “The Visit East Lothian app raises awareness of local businesses and therefore helps to encourage visitors to enjoy more of the many amenities East Lothian has to offer.”

WTW
ArcGIS deepens our understanding of the global risks that our clients face today, that arise unexpectedly tomorrow and that are likely for the future.
The multinational risk management and insurance brokering organisation WTW uses Esri’s ArcGIS suite to deepen its understanding of global risks, including unpredictable, immediate risks from tropical storms or earthquakes and future risks from climate change. It shares its risk intelligence with clients to help them make better informed operational decisions and react quickly to events to minimise business disruption.
Data scientists use ArcGIS Pro to model hazards and vulnerabilities around the world in different climate scenarios.
ArcGIS map services allow WTW to immediately identify when clients have assets in the projected path of a storm or in the vicinity of an earthquake.
The corporate risk brokering division uses a model develop with ArcGIS to analyse complex global supply chains and better assess a wider range of business risks.
The Challenge
In the insurance and reinsurance industry, understanding exposure to risk is critical. Insurers need to know where clients’ assets may be, whether these are physical assets on the ground or other less tangible assets that are fundamental for global supply chains. From a simple address, they need to be able to separate the multi-storey buildings and high-value distribution centres from low priority offices and car parks. Then, they need to identify if and when these assets might be exposed to a diverse range of risks, from climate change and storm damage to social unrest and war.
“The diversity of the ArcGIS product suite means that it can be used in different ways, by different levels of users, from expert GIS analysts and climate scientists to insurance brokers with no GIS experience.”
Sharon Palmer, Director of Risk Analytics, Platforms and Technology, WTW
The Solution
Operating in 140 countries, WTW uses Esri’s geographic information system (GIS) suite, ArcGIS, to help it not only assess risks at each of its clients’ locations, but also constantly monitor changes in risk levels in real-time. Different teams and business units within WTW’s 45,000-person workforce use a range of Esri desktop and web-based solutions as part of their day-to-day roles.
WTW hosts its geospatial data in ArcGIS Enterprise, which hosts a number of internal and external applications, as well as risk models for clients. Specialist users within the analyst community use ArcGIS Pro for desktop analysis, while other employees use a simple ArcGIS portal application to view and share maps and analysis or use ArcGIS for Microsoft BI to import maps into reports. “The diversity of the ArcGIS product suite means that it can be used in different ways, by different levels of users, from expert GIS analysts and climate scientists to insurance brokers with no GIS experience,” says Sharon Palmer, Director of Risk Analytics, Platforms and Technology at WTW.
One key tool that has been developed using ArcGIS is Global Peril Diagnostics (GPD), which consolidates and analyses risk data from a variety of sources. It includes a module for analysing complex global supply chains and another for monitoring live events, such as the approach of a tropical storm. GPD uses ArcGIS map services to identify when clients have assets in the projected path of a storm or in the vicinity of an earthquake and sends them an automated alert. Used by the corporate risk brokering division of the business, GPD plays a vital role in helping WTW to understand and screen risks around the world.
Climate change is now recognised as a significant future risk, and WTW uses ArcGIS to provide clients with specialist advice in this area. ArcGIS Pro is used in the delivery of the firm’s Climate Quantified™ service, as it allows data scientists to model hazards and vulnerabilities and quantify physical and transition risks around the world in different climate scenarios. WTW has also developed a model called Climate Diagnostic, using ArcGIS, that is used by employees and clients to visualise actual and predicted changes in climate hazards, such as extreme wind, sea level rises and heat stress.
“ArcGIS enables us to take abstract data about climate and turn it into tangible information about risk that is specific to our clients.
Sharon Palmer, Director of Risk Analytics, Platforms and Technology, WTW
Benefits
Deep understanding of static and transitory risks
ArcGIS is a key tool that gives WTW a deep understanding of risk. Increasingly, WTW is now using ArcGIS to extend its analysis beyond business assets to entire supply chains, with sophisticated supply chain risk models. The organisation can, for example, now model how a flood at a factory that supplies a significant component could disrupt the client’s manufacturing processes, as well as explore transportation risks, whether by sea, road, air or rail. “ArcGIS is helping us to extend our capabilities from static risks to transitory risks,” Palmer says.
Live intelligence about potentially disruptive events
Pivotal new tools, developed with ArcGIS, give WTW the ability to see not just the path of a storm, but where clients’ assets are in relation to that storm, which clients will be most impacted and, more specifically, which clients will be affected with greatest severity. “ArcGIS gives us geospatial analytics on the fly!” Palmer explains. “When events like earthquakes and storms occur, we can notify clients quickly and help them implement mitigations locally to limit damage and business disruption.”
Value adding risk management services for clients
The versatility of ArcGIS gives WTW the capability to develop and deliver new client services. It can, for example, create client-specific analytical models to help clients understand specific risks at their global locations. Clients can then use this information to make decisions about where to open new offices and which facilities to expand based on a better understanding of risks at these locations. In the future, WTW plans to develop more ArcGIS-enabled apps that will allow clients to self-serve information about their risk profiles around the world.
Tangible information about climate change
ArcGIS is proving particularly invaluable in helping WTW and its clients to better understand emerging and changing risks relating to climate change. The Climate Diagnostic tool makes it easier for people to visualise changes over time, at specific locations, and comprehend how climate-related hazards could impact specific operations, properties and asset portfolios in the future. As Palmer says, “ArcGIS enables us to take abstract data about climate and turn it into tangible information about risk that is specific to our clients. It’s a huge help in a changing world.”
Forth Rivers Trust
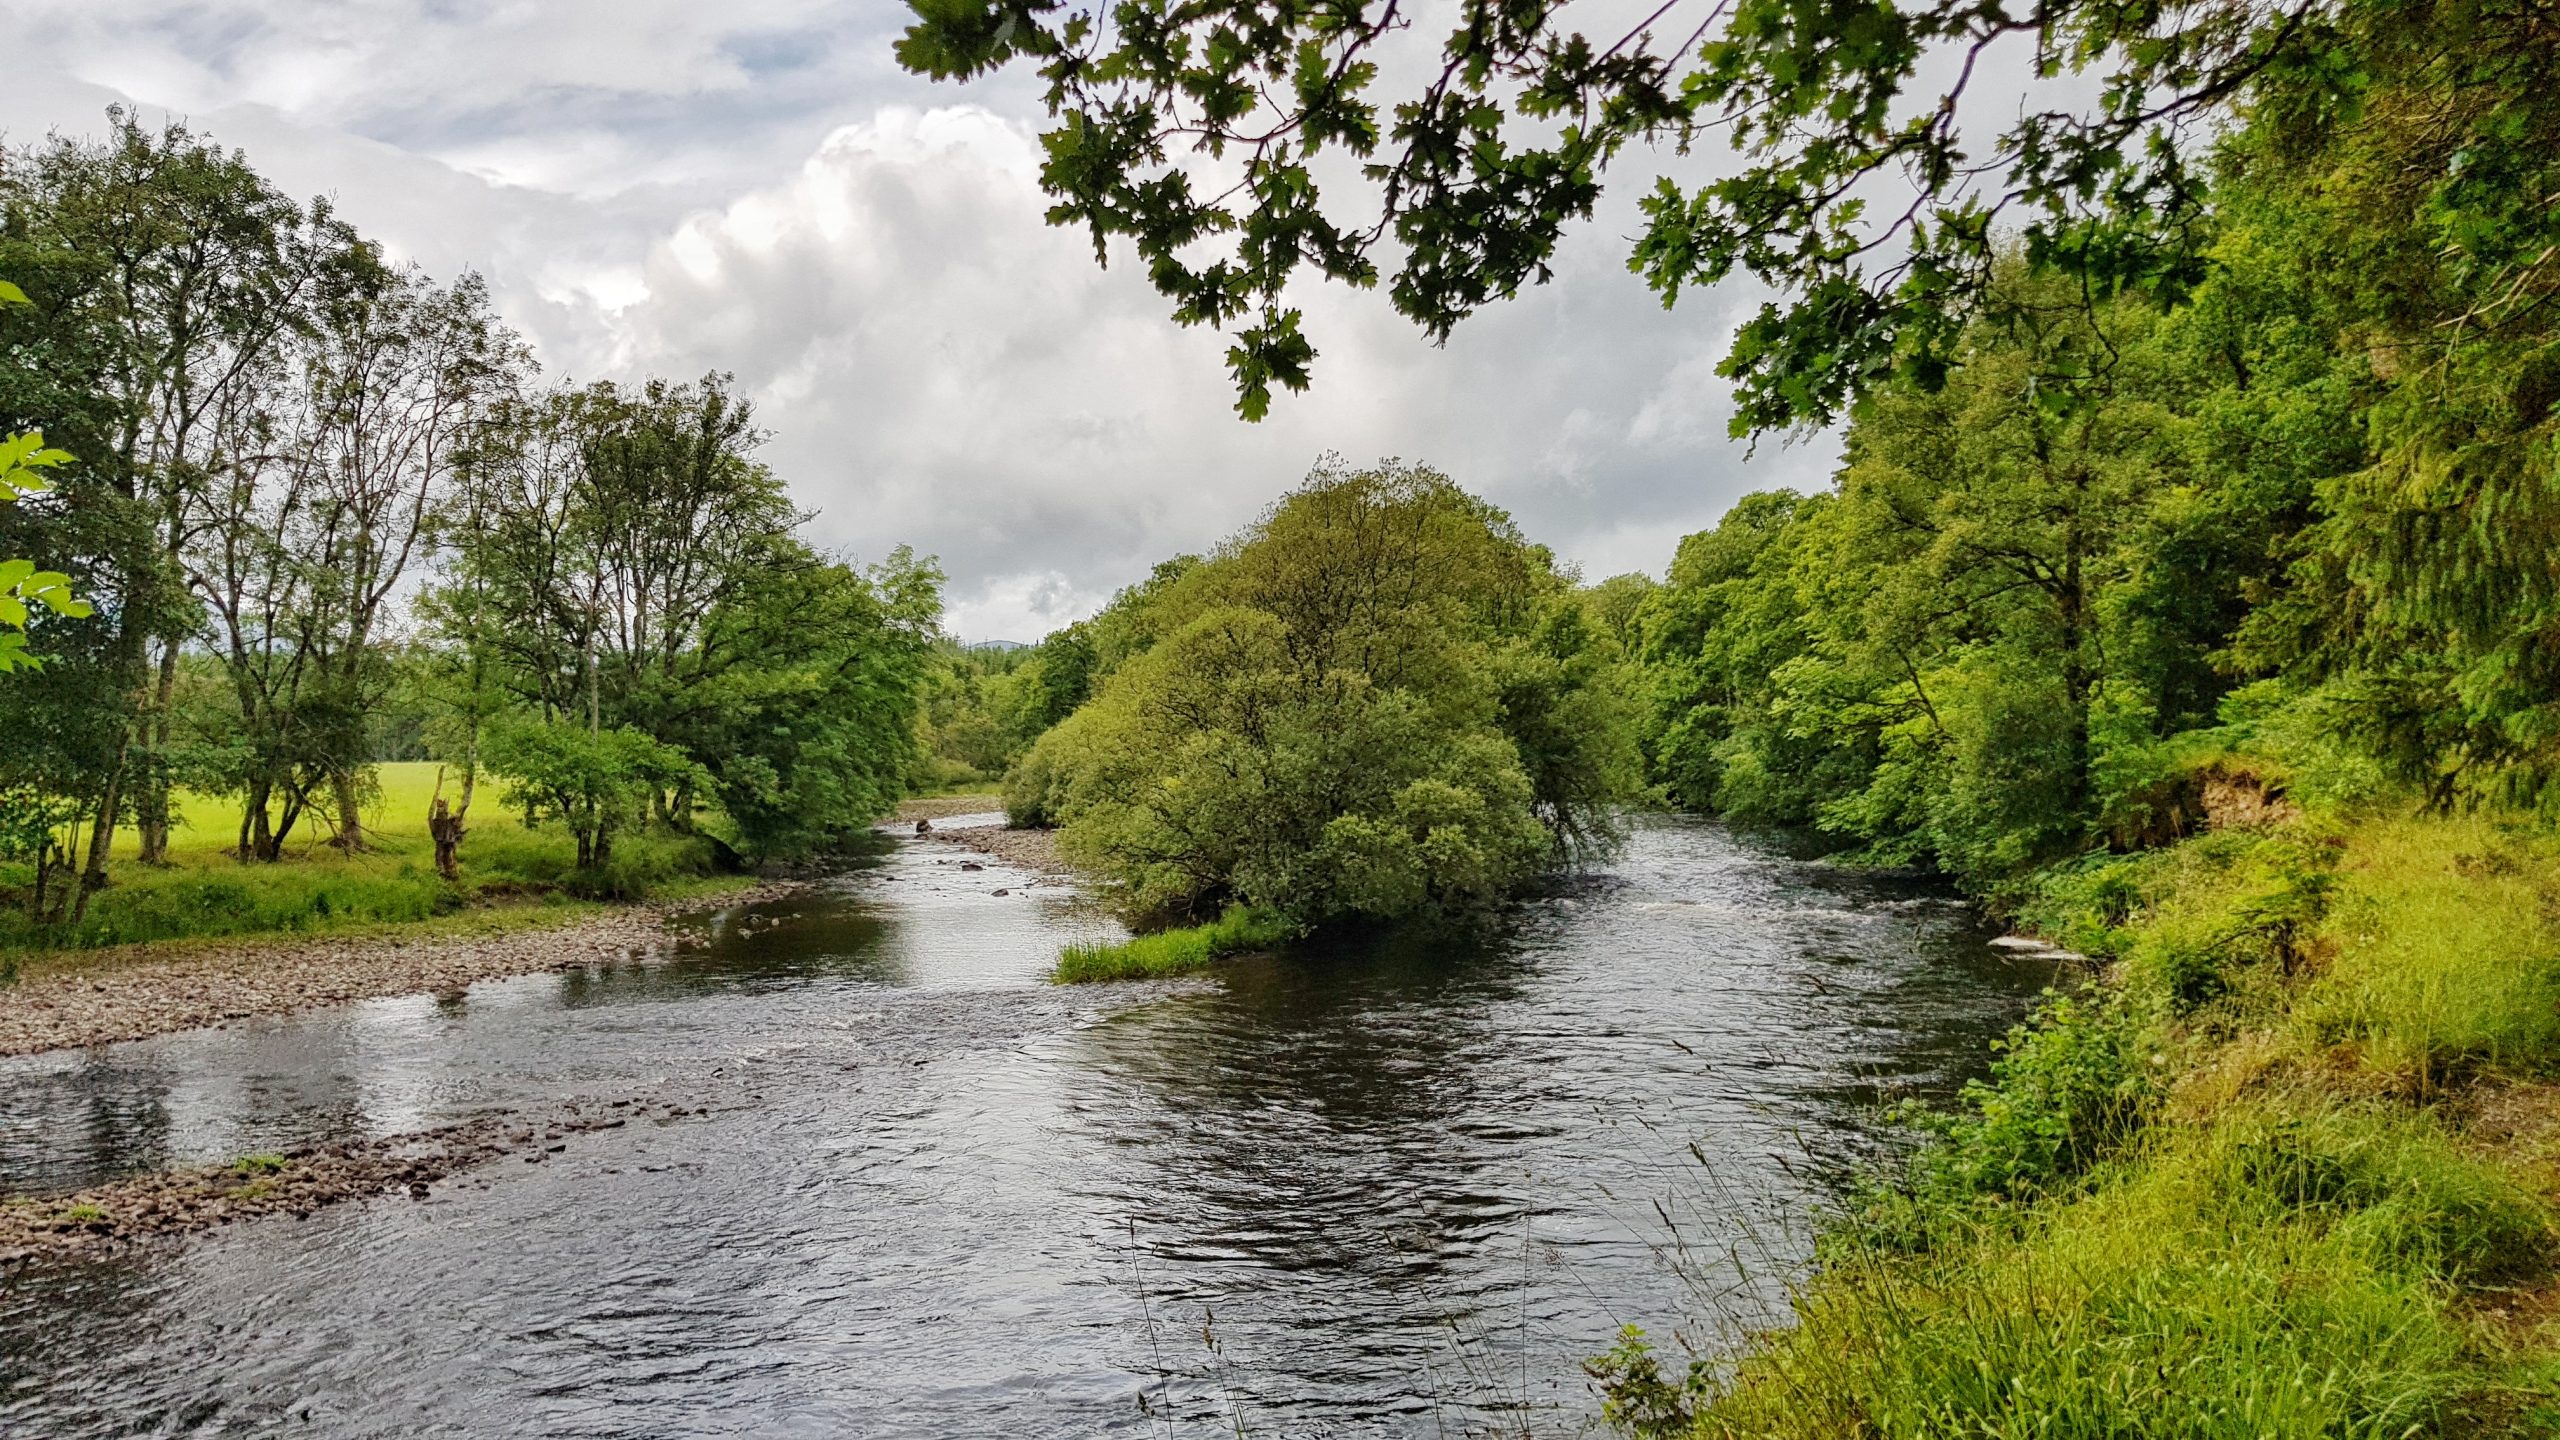
We have transformed the way that we gather evidence and share information to raise awareness of the pressures on ecologically-important river catchments in Scotland.
A rivers trust in Scotland has improved the way that it engages with members of the public, stakeholders and partners to raise awareness of the pressures on some of Scotland’s most diverse and vibrant river catchments. Using ArcGIS StoryMaps and mobile data capture solutions, it can now evidence the urgent need for conservation schemes and better articulate the success of its intervention projects.
Five-year river catchment management plans have been replaced by interactive, living ArcGIS StoryMaps
Up-to-date data is viewed, queried, edited and collected in the field by all trust employees using ArcGIS Field Maps
New habitat maps are created digitally in the field with an Esri SWEET app, simplifying complex phase one habitat surveys
The Challenge
Covering a vast area of over 4,500 km2, the Forth district includes all rivers, streams and burns that flow into the Firth of Forth Estuary in Scotland. The area is a haven for diverse wildlife species and a popular destination for recreation, but its future is threatened by pollution, past and future development and climate change. The Forth Rivers Trust wanted to make people more aware of the pressures on these river catchments and secure funding for new projects to improve river environments, but feared that its reports were not reaching a sufficiently wide audience.
At the same time, the Forth Rivers Trust wanted to improve the quality of the data that it relied on for evidencing the need for conservation projects and monitoring the success of its interventions. Much of its data was collected laboriously using pen and paper, and a great deal of time was subsequently required to digitise it. Precise location references could not be recorded, and the trust’s employees had no way of viewing or editing data in the field.
“ArcGIS StoryMaps enable us to engage with more people, raise awareness of the pressures on river catchments and highlight opportunities for improvement.”
Michiel Voermans, Data and GIS Officer, Forth Rivers Trust
The Solution
Forth Rivers Trust initially decided to leverage Esri’s ArcGIS Online platform to transform its five-year river management plans from static pdf documents into highly visual, interactive digital narratives. The first of these pioneering new plans covered the Forth and Teith river catchments and used an ArcGIS StoryMap template to make detailed information about the pressures on these key river environments more engaging for partners, stakeholders, grant-givers and the general public.
As part of the process of creating the StoryMap, Forth Rivers Trust had to digitise a large amount of historic data, as well as clean, edit, merge and standardise all of the organisation’s existing datasets. This data preparation was time-consuming, but paved the way for the trust to gain even more value from its data assets. “Once we had put all our data into ArcGIS Online for the StoryMap, we were only a few small steps away from making it possible for our staff to amend, edit, query and collect data in the field,” says Michiel Voermans, Data and GIS Officer at Forth Rivers Trust.
Consequently, soon after the launch of the StoryMap, Forth Rivers Trust created a mobile solution with ArcGIS Field Maps that allows conservationists, ecologists and other staff members to view, collect and edit data in the field. The Field Maps app is very easy and intuitive for anyone to use on mobile phones, enabling the trust to capture accurate information and locations on issues including invasive species, sewerage outflows and river barriers.
Following the success of ArcGIS Field Maps, Forth Rivers Trust also began to use an Esri SWEET app to help it conduct complex phase one habitat surveys. Easy to use for non-GIS experts, this Esri-deigned solution allows ecologists to capture detailed information, pictures and locations and map everything they see digitally on tablets, while in the field.
“ArcGIS has enabled us to take a huge leap forwards in the way that we monitor river catchments and plan new management schemes to protect and regenerate these vibrant and diverse environments.”
Michiel Voermans, Data and GIS Officer, Forth Rivers Trust
Benefits
Raised public awareness of river pressures
By converting its river management plans into ArcGIS StoryMaps, Forth Rivers Trust is able to reach a wider audience and improve public understanding of the diverse challenges for river catchment areas. “Our Forth and Teith Catchment Management Plan StoryMap received 2,400 views in the first year, whereas a pdf plan would not have reached 10% of this number, even in five years,” says Voermans. “ArcGIS StoryMaps enable us to engage with more people, raise awareness of the pressures on river catchments and highlight opportunities for improvement.”
Living – not static – management plans
With its new StoryMap approach, Forth Rivers Trust has been able to turn its static, pdf river management plans into living documents that can be updated regularly as new information becomes available. The organisation can, for example, share up-to-date information on the status of projects, such as removing man-made barriers to fish migration. It no longer has to produce new plans every five years, as unlike the pdf plans, the StoryMap plans don’t get out-of-date. “ArcGIS has enabled us to take a huge leap forwards in the way that we monitor river catchments and plan new management schemes to protect and regenerate these vibrant and diverse environments,” Voermans says.
Up to 50% time savings on habitat surveys
As the organisation no longer has to digitise data collected on paper in the field, it is saving a tremendous amount of time. “Digitising habitat data and hand-drawn maps in the office can take as much time as conducting the survey in the field,” Voermans explains. “Our use of Esri mobile data capture solutions is, therefore, leading to a time saving of up to 50%.”
Better data for grant applications
ArcGIS Field Maps and the Esri SWEET app enable Forth Rivers Trust to capture more accurate, location-specific data and gain clear evidence to support bids for funding for new river restoration schemes. The data improvements also help the organisation to more precisely monitor the success of its interventions and continually strengthen the case for improving river environments for wildlife, communities and visitors alike. “Our role is to give a voice to the rivers,” says Voermans, “and ArcGIS helps us to do this.”

OSNI
Virtual training courses from Esri UK & Ireland are helping us to keep our skills up-to-date and deliver specialist geospatial services for government stakeholders and the general public.
The Ordnance Survey of Northern Ireland, part of Land and Property Services, is renowned for its expertise in mapping and geospatial analysis. It invests annually in ArcGIS training from Esri UK & Ireland to help it ensure that its specialists have the advanced, up-to-date skills they need to advise government departments.
OSNI has switched from traditional classroom style training to virtual for its ArcGIS training needs
Virtual courses provide the same quality training as classroom-based courses, without the additional cost of travel
Virtual courses organised specifically for OSNI enable more people, from multiple business areas, to be trained cost effectively
The Challenge
Within the Ordnance Survey of Northern Ireland (OSNI), there is a group of highly skilled geographic information system (GIS) experts known as the Northern Ireland Mapping Agreement (NIMA) Support Team. These specialists provide geospatial advice and services for a wide range of stakeholders in government departments and other public sector bodies.
Since its inception in 2009, the NIMA Support Team has used Esri’s ArcGIS suite of solutions to help customers and stakeholders find answers to complex questions on topics ranging from changes in the natural environment to public health concerns and the delivery of government services for citizens. The data and mapping products generated by the team with ArcGIS are used to evidence, support and inform government policies, so it is imperative for the team to be able to optimise their use of the latest technologies and apply the most advanced geospatial techniques and analyses.
“Esri UK & Ireland’s virtual courses provide the same high-quality learning, from certified trainers, without the expense of travel.”
Rico Santiago, Deputy Head of Business Development, Ordnance Survey Northern Ireland
The Solution
OSNI leverages a variety of ArcGIS training courses from Esri UK & Ireland annually. New and existing members of the NIMA Support Team take part in at least three courses per year, which helps the organisation to ensure that everyone’s skills are at the same level. Recent courses provided by Esri UK & Ireland for OSNI include ‘Getting started with Lidar’, ‘Creating and Editing Data with ArcGIS Pro,’ ‘Creating Web Applications using Web AppBuilder for ArcGIS’ and ‘Sharing GIS Content using ArcGIS.’
Previously, OSNI selected classroom-style courses that took place in Belfast, Aylesbury or Dublin or at its own premises. However, to maintain its training programme during the COVID-19 pandemic, the organisation started to take advantage of Esri UK & Ireland’s virtual courses. Its experience with this new training format was so positive that the organisation now consistently leverages Esri UK & Ireland’s catalogue of virtual courses.
Employees who are taking part in virtual ArcGIS training courses do not have to have ArcGIS software installed on their local devices, as all of the technology needed for the course is delivered via web-based applications. The trainer can see everyone’s screens and intervene to provide one-on-one support to anyone who needs it during exercises. “I like the technology that Esri UK & Ireland has employed for its virtual courses,” says Rico Santiago, Deputy Head of Business Development, Ordnance Survey of Northern Ireland. “Esri UK and Ireland's virtual platform facilitates effective learning from the comfort of our own homes.”
The Learning Services group at Esri UK & Ireland offers a variety of one, two and three-day virtual courses, suitable for newcomers to GIS and experienced users. As well as open courses, which can be attended by anyone, it can deliver dedicated courses, exclusively for employees from one company. All virtual courses can accommodate up to twelve participants, and OSNI generally books dedicated courses, just for OSNI employees, to enable it to train large numbers of people at the same time and focus on OSNI-specific use cases throughout the course.
“Esri UK & Ireland’s learning services keep our ArcGIS skills up-to-date and enable us to continue to live up to and exceed our reputation as the geospatial and mapping specialists within the public sector in Northern Ireland.”
Rico Santiago, Deputy Head of Business Development, Ordnance Survey Northern Ireland
Benefits
Convenient and cost-effective virtual training
OSNI has discovered that virtual training is significantly more convenient and cost-effective than traditional classroom style courses and just as effective. “Esri UK & Ireland’s virtual courses provide the same high-quality learning, from certified trainers, without the expense of travel,” Santiago says. “While I sometimes miss the face-to-face interaction of a traditional in-person course, the virtual platform is able to facilitate real-time feedback and engagement with classmates and trainers and does so while delivering value for money. I feel the pros of remote training outweigh the cons.”
Training available to more employees
By booking dedicated virtual courses for up to twelve of its employees at a time, OSNI benefits from cost efficiencies and can make training available to more people, beyond the twenty-seven members of the NIMA Support Team. In 2021, for example, the virtual training programme was extended to ten additional people from other OSNI teams, and thirty seven employees benefited from ArcGIS learning services in total.
Up-to-date skills for delivering specialist services
Providing regular training for members of the NIMA Support Team helps OSNI to uphold the reputation of this specialist group. “Customers and stakeholders come to us for expert GIS services and support,” Santiago explains. “Esri UK & Ireland’s learning services keep our ArcGIS skills up-to-date and enable us to continue to live up to and exceed our reputation as the geospatial and mapping specialists within the public sector in Northern Ireland.”
Confidence in work for government stakeholders
The regular ArcGIS training that OSNI employees receive enables them to support their government stakeholders with confidence. In recent projects, expert GIS users have worked with the Department of Health and The Executive Office to support the COVID-19 response in Northern Ireland. They have also supported a variety of schemes with the Department of Infrastructure, using the latest ArcGIS functionality to address complex issues like flood risk and management, and help deliver departmental objectives. Santiago comments that “Regular training ensures we understand the technologies we are using and gives us added confidence in our work.”
RSA
For more than 20 years, we have used ArcGIS to help us gain a deeper understanding of risks in locations around the globe.
The international insurer RSA has been using Esri’s ArcGIS technology for over 20 years to help it better understand global perils risk and manage its exposure. Integrated with other core systems, ArcGIS enables RSA’s employees to make better-informed business decisions, as well as respond quickly and effectively to major incidents.
Instant access to the risk intelligence needed for understanding perils at specific locations and pricing risks.
Rapid development of apps that highlight major events, historical losses or spatial patterns and help the business plan for the future.
Proactive identification of customers affected by floods and other crises so RSA can help by responding quickly.
The Challenge
Complex factors like extreme climatic change create new risks, in new locations, all the time. The challenge for insurance companies is to thoroughly understand these risks and make well informed decisions about how best to manage exposure to current and emerging perils within a given geographic area. When emergencies like floods, wildfires and explosions occur, insurers also need to be able to quickly ascertain which customers have been most affected, so that they can offer rapid support.
RSA was one of the first insurers to exploit the power of geographic information system (GIS) technology, using it initially to gain a more detailed understanding of flood risk. Now a wholly-owned subsidiary of Intact Financial Corporation, RSA has been extending and advancing its use of ArcGIS for more than 20 years.
“ArcGIS is firmly embedded in everything we do. It enables us to work efficiently and gives everyone the same instant view of global risk, irrespective of where they are.”
Katie Ward, Head of GeoRisk, RSA
The Solution
At the heart of RSA’s business today is an enterprise GIS platform, built using Esri’s ArcGIS technology and maintained by Esri UK. ArcGIS delivers instant access to the risk intelligence that RSA requires to understand which risks exist at a property and whether it has capacity to underwrite new business in this specific area. “ArcGIS is right at the front end of what we do,” says Katie Ward, Head of GeoRisk at RSA.
The Esri GIS platform has been integrated with RSA’s core business systems for underwriting and pricing, so up to 2,000 employees in RSA’s underwriting and pricing teams regularly use GIS and mapping tools as a part of their daily jobs. Considered to be a pivotal business tool, ArcGIS delivers geocoding and risk analysis services for everything from validating addresses to scoring perils and delivering customer quotes for new policies.
RSA also makes extensive use of ArcGIS Pro, through an Enterprise Licence Agreement with Esri UK. The team of expert GIS users at RSA employs sophisticated spatial analysis techniques to create hazard models and reports that provide insights into new and changing risk profiles. The use of GIS has replaced spreadsheets, enabling employees to examine trends and patterns visually.
Most recently, RSA has begun to make greater use of ArcGIS Online to create quick applications, on demand, that replace static maps and enable people to gain a deeper insight into a wide range of issues by interacting directly with the data. For example, the GeoRisk team has created an ArcGIS app to show claims hot spots across the UK in relation to the locations of its loss adjusters. Using this information, the business can make sure its loss adjusting staff are based in the right places to provide the best possible claims support for their customers.
“ArcGIS enables us to react quickly and proactively in emergency situations to help our customers, before they have even logged a claim.”
Katie Ward, Head of GeoRisk, RSA
Benefits
Deeper understanding of risks
Through its use of ArcGIS, RSA has been able to take advantage of the growing availability of open data to derive a greater understanding of peril risk and thereby allow underwriters to make better business decisions. Having a clear understanding of the business that is already covered allows underwriters to determine whether there is capacity to write more business, ensuring that RSA remains within its risk appetite.
Policies priced fairly based on actual risks
By using the platform, RSA can identify the exact property being insured, and the rate charged for a specific peril can more accurately reflect the risk that is being covered. For instance, a person living on top of a hill would now pay a lower premium for flood cover than someone living closer to the river. “Our use of ArcGIS and risk modelling helps us to understand peril more accurately, at specific locations, and then offer cover at a fair and competitive price,” Ward explains.
Fast, effective customer service
If a flood, wildfire or other unexpected incident occurs, RSA can use ArcGIS to immediately see which of its customers are affected. “Following a recent explosion in Birmingham, we were able to quickly identify nearby customers and contact them to make sure they were alright,” Ward recalls. “ArcGIS enables us to react quickly and proactively in emergency situations to help our customers, before they have even logged a claim.”
Well-informed business strategy
Following events such as a major flood, RSA’s GeoRisk team uses ArcGIS to prepare presentations for senior managers, analysing what occurred and the implications for the business. These reports provide clarity in complex situations and are used to help inform changes in business strategy. For instance, ArcGIS helps managers to understand if RSA is underwriting the right levels of risk in the right locations.
Efficient working across multiple countries
The recent migration to ArcGIS Pro, Esri’s latest desktop software, is saving time as the GIS team can now more easily automate processes, streamline data processing tasks and make them more repeatable. In addition, the integration of ArcGIS with other systems saves time for RSA employees, as they no longer have to access risk maps separately, whether they are working in the UK, Ireland or Canada. “ArcGIS is firmly embedded in everything we do,” Ward says. “It enables us to work efficiently and gives everyone the same instant view of global risk, irrespective of where they are.”