Working in an organisation full of real heroes who risk their lives on the sea to save others, Matthew Wright is understandably modest about his achievements. He has, however, played a key role in helping the RNLI to maintain its vital, life-saving services during the COVID-19 pandemic, through his use of GIS.
When the pandemic first emerged and lifeboat crew members started to self-isolate, the RNLI realised that an escalation in the pandemic might impact its ability to respond to an emergency. The charity has over 8,500 operational volunteers around the UK and Ireland who are on call 24/7. It was concerned that if several people became ill or had to self-isolate in one community, at the same time, lifeboat stations might not have sufficient number of trained crew to launch a lifeboat.
As GIS Advisor to the charity, Wright used Esri’s ArcGIS platform to build an interactive dashboard, using out-of-the-box tools, showing the readiness of crews at 238 lifeboat stations in the UK and Ireland. A red dot indicates that the lifeboat station has been sufficiently affected by COVID-19 that it would not be able to deploy in an emergency; an amber dot indicates that the regional manager is concerned; and a green dot illustrates that there are currently no issues and the lifeboat is able to operate as normal. The dashboard also shows a daily count of the number of crew members who have reported COVID-19 symptoms or who are required to self-isolate due to potential exposure to the virus.
Every day at 4:30pm, the map is refreshed with up-to-date data, in time to be used by senior managers in the daily COBRA-style senior leadership meetings. The ArcGIS dashboard makes it very easy for this central team to monitor changes in the charity’s operational readiness and make effective decisions based on an accurate understanding of the availability of crew. With this insight, the RNLI is better able to deploy the right crew, from the right lifeboat station, to respond to an emergency situation as effectively and quickly as possible, to help save lives.
At one point in time, the RNLI COVID-19 Status dashboard revealed that there were over 250 crew members in self-isolation and 15 crew members with COVID-19 symptoms. Despite these figures, the dashboard reassured senior managers, as it continued to illustrate visually, throughout the pandemic, that there were no significant gaps in coverage around the coast. Even when individual lifeboat stations had to suspend their activities due to crew shortages, the ArcGIS dashboard always showed there were other lifeboat stations nearby that were ready for action.
While the number of people going to the beach and engaging in leisure activities like sailing and kayaking reduced significantly during the lockdown, there was still a very real need for the RNLI to be able to fulfil its vital service. In the six week period from March 23rd, the day that the lockdown commenced in the UK, to May 4th 2020, the RNLI needed to launch its lifeboats 314 times and rescued or aided 236 people. Critically, the charity believes that at least seven people are alive today, who would have lost their lives at sea during this six-week period, if it hadn’t been for the swift and courageous actions of volunteer RNLI lifeboat crews.
One evening, the RNLI rescued two teenagers, who had not only broken the lockdown restrictions by going out, but had gone to sea in a boat with a broken rudder and no sail and then lost their paddle overboard. Other call-outs involved locating windsurfers and kayakers who had been blown offshore by strong winds and rescuing walkers cut off by the tide. The RNLI also assisted a cargo ship that had run aground and assisted several amateur and professional fishermen, when their fishing boats and trawlers got into difficulties. Having the COVID-19 Status dashboard helped to give the RNLI the confidence that it had the trained crews available to respond to these and other emergencies.
Remarkably, Wright delivered the RNLI COVID-19 Status dashboard within just 72 hours, with two colleagues working on different aspects of the solution. Russell Hocken, Data Analytics Manager, devised a new approach to gathering COVID-19 data from 48 regional managers, enabling updates to be easily uploaded to the ArcGIS Dashboard; and Lucy Dickinson, Data Scientist, developed a PDF report that could be generated automatically each day, using the same data, to show trends. “We all drew on our own areas of expertise,” says Wright. “I was able to use my skills and experience with GIS to present our COVID-19 data in a visual format that enables senior managers to instantly understand the status at 238 lifeboat stations and the readiness of crews at each location.”
While Wright has built up his GIS skills over many years, in roles at the RNLI and previously at English Heritage, he began his working life in a very different field – often a muddy one. “I trained initially as an archaeologist,” he reveals. “After 7 years though, I decided to swap my trowel for a keyboard and spend more time in a warm, comfortable office! ”
Since joining RNLI, Wright has played an instrumental role in creating the charity’s Life-Saving Service Status dashboard, another GIS solution built using ArcGIS Online Web App Builder. Whereas the COVID-19 Status dashboard displays the readiness of crews, this more advanced dashboard shows the operational status of boats, including whether they have launched, whether they are undergoing maintenance or whether they are ready to respond to an emergency. Since it was introduced, the Life-Saving Service Status dashboard has become one of the main information tools used by senior managers to monitor the operational status of the lifeboat fleet. Wright anticipates that, in time, aspects of the COVID-19 Status dashboard will be subsumed into the core Life-Saving Service Status dashboard. He will then further enhance the system to provide a comprehensive, live and critical information tool for the charity, helping it to achieve its mission of saving more lives at sea.
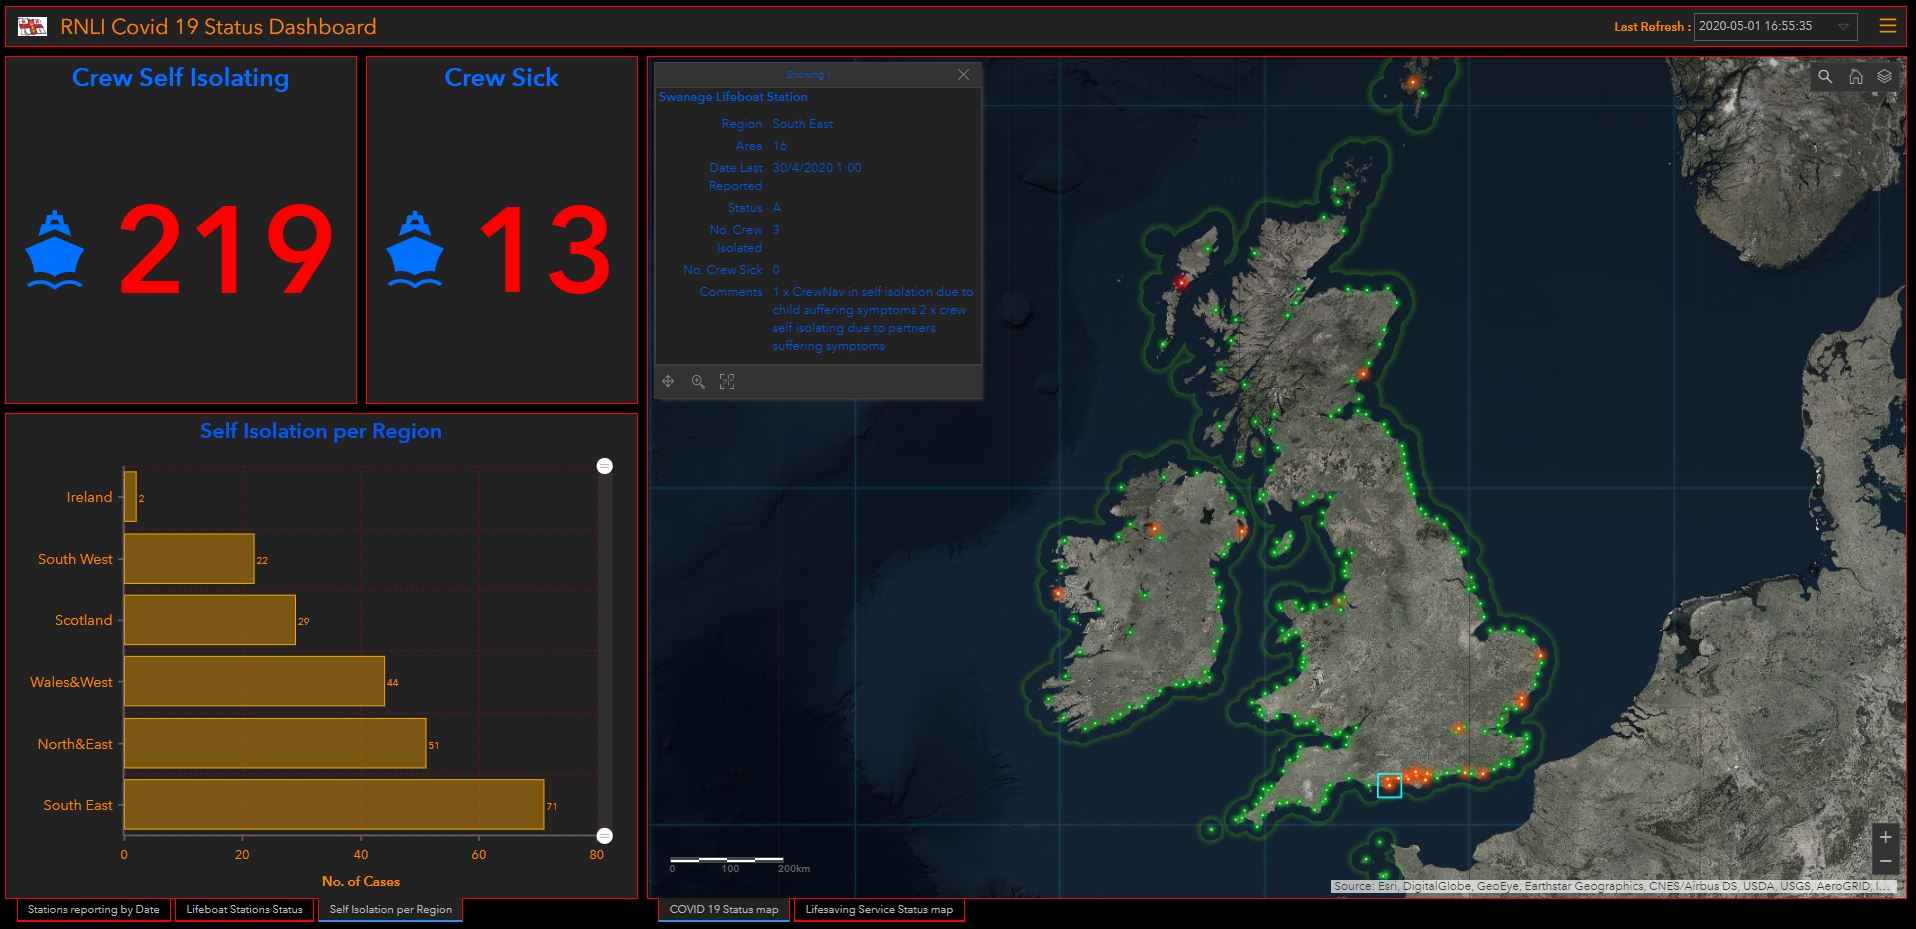
The RNLI COVID-19 Status dashboard provides a clear overview of the availability of RNLI lifeboat crews around the UK and Ireland during the pandemic
 Matthew Wright - RNLI