Transforming the measurement of biodiversity net gain
With clear and ambitious plans to not just restore but improve biodiversity across its sites, SSE Renewables has developed a pioneering new way to measure biodiversity net gain (BNG). Using Esri’s ArcGIS technology, staff can now calculate the positive impact of rewilding schemes in seconds, while still in the field, and view BNG performance metrics on visual dashboards.
BNG values can be calculated and recalculated on demand, by staff working on mobile devices in the field as well as in the office
Progress towards BNG targets can be viewed in real-time on interactive dashboards, supporting improved BNG reporting
Developed to calculate BNG using Scottish habitats classifications, the solution can be easily adapted for other regions
The Challenge
SSE Renewables has a strong and uncompromising commitment to improving the quality of the natural environment. The organisation is a leading developer, builder and operator of renewable electricity generation assets. It is actively expanding and constructing new wind, hydro, solar and battery storage facilities and aims to do so whilst simultaneously enriching the biodiversity of its sites.
Demonstrating its leadership in this field, SSE Renewables published a structured methodology for calculating biodiversity improvements in Scotland where most of its projects are located. It pledged to embed its strong BNG ambitions in decision-making at every stage of all new project developments, but needed an effective way to apply its new methodology, calculate BNG scores quickly and make accurate information available to decision makers.
“ArcGIS helps everyone to understand what biodiversity exists and how we can have a positive impact on it.”
Chris Alley, Lead GIS Analyst, SSE Renewables
The Solution
SSE Renewables had been using Esri’s geographic information system (GIS) technology for more than five years and had already built a corporate GIS system in the cloud using ArcGIS Online and ArcGIS Hub. Known internally as the SSE Renewables GeoHub, this platform delivered a host of tailored apps for more than 700 users.
To address the challenge of calculating BNG, the organisation initially used its GeoHub to collate and analyse habitats data and output the figures needed to calculate BNG values manually. It then created a dashboard in ArcGIS Online that displayed the BNG values before and after improvements. This was a partial solution to the challenge, but it didn’t go far enough, as the process still included time-consuming manual steps, and BNG values could not be calculated on the fly. “We had achieved our end goal, but needed to find a way of getting there that was faster and more efficient at scale,” explains Chris Alley, Lead GIS Analyst at SSE Renewables.
A flash of inspiration occurred when Alley attended an Esri UK conference a few months later and saw a demonstration of one of Esri’s new products, Sweet for ArcGIS. He realised that he could use Sweet for ArcGIS in combination with ArcGIS Survey123 and ArcGIS Dashboards to create a complete field-to-dashboard workflow and make BNG values available instantly.
Alley built an initial proof of concept in-house and then called upon one of Esri UK’s consultants to help him refine, expand and test the solution rigorously. “Having a consultant from Esri UK available to support this development project was extremely valuable,” he says. “He really understood how to make best use of the in-depth functionality available in Sweet for ArcGIS and make our BNG solution robust.”
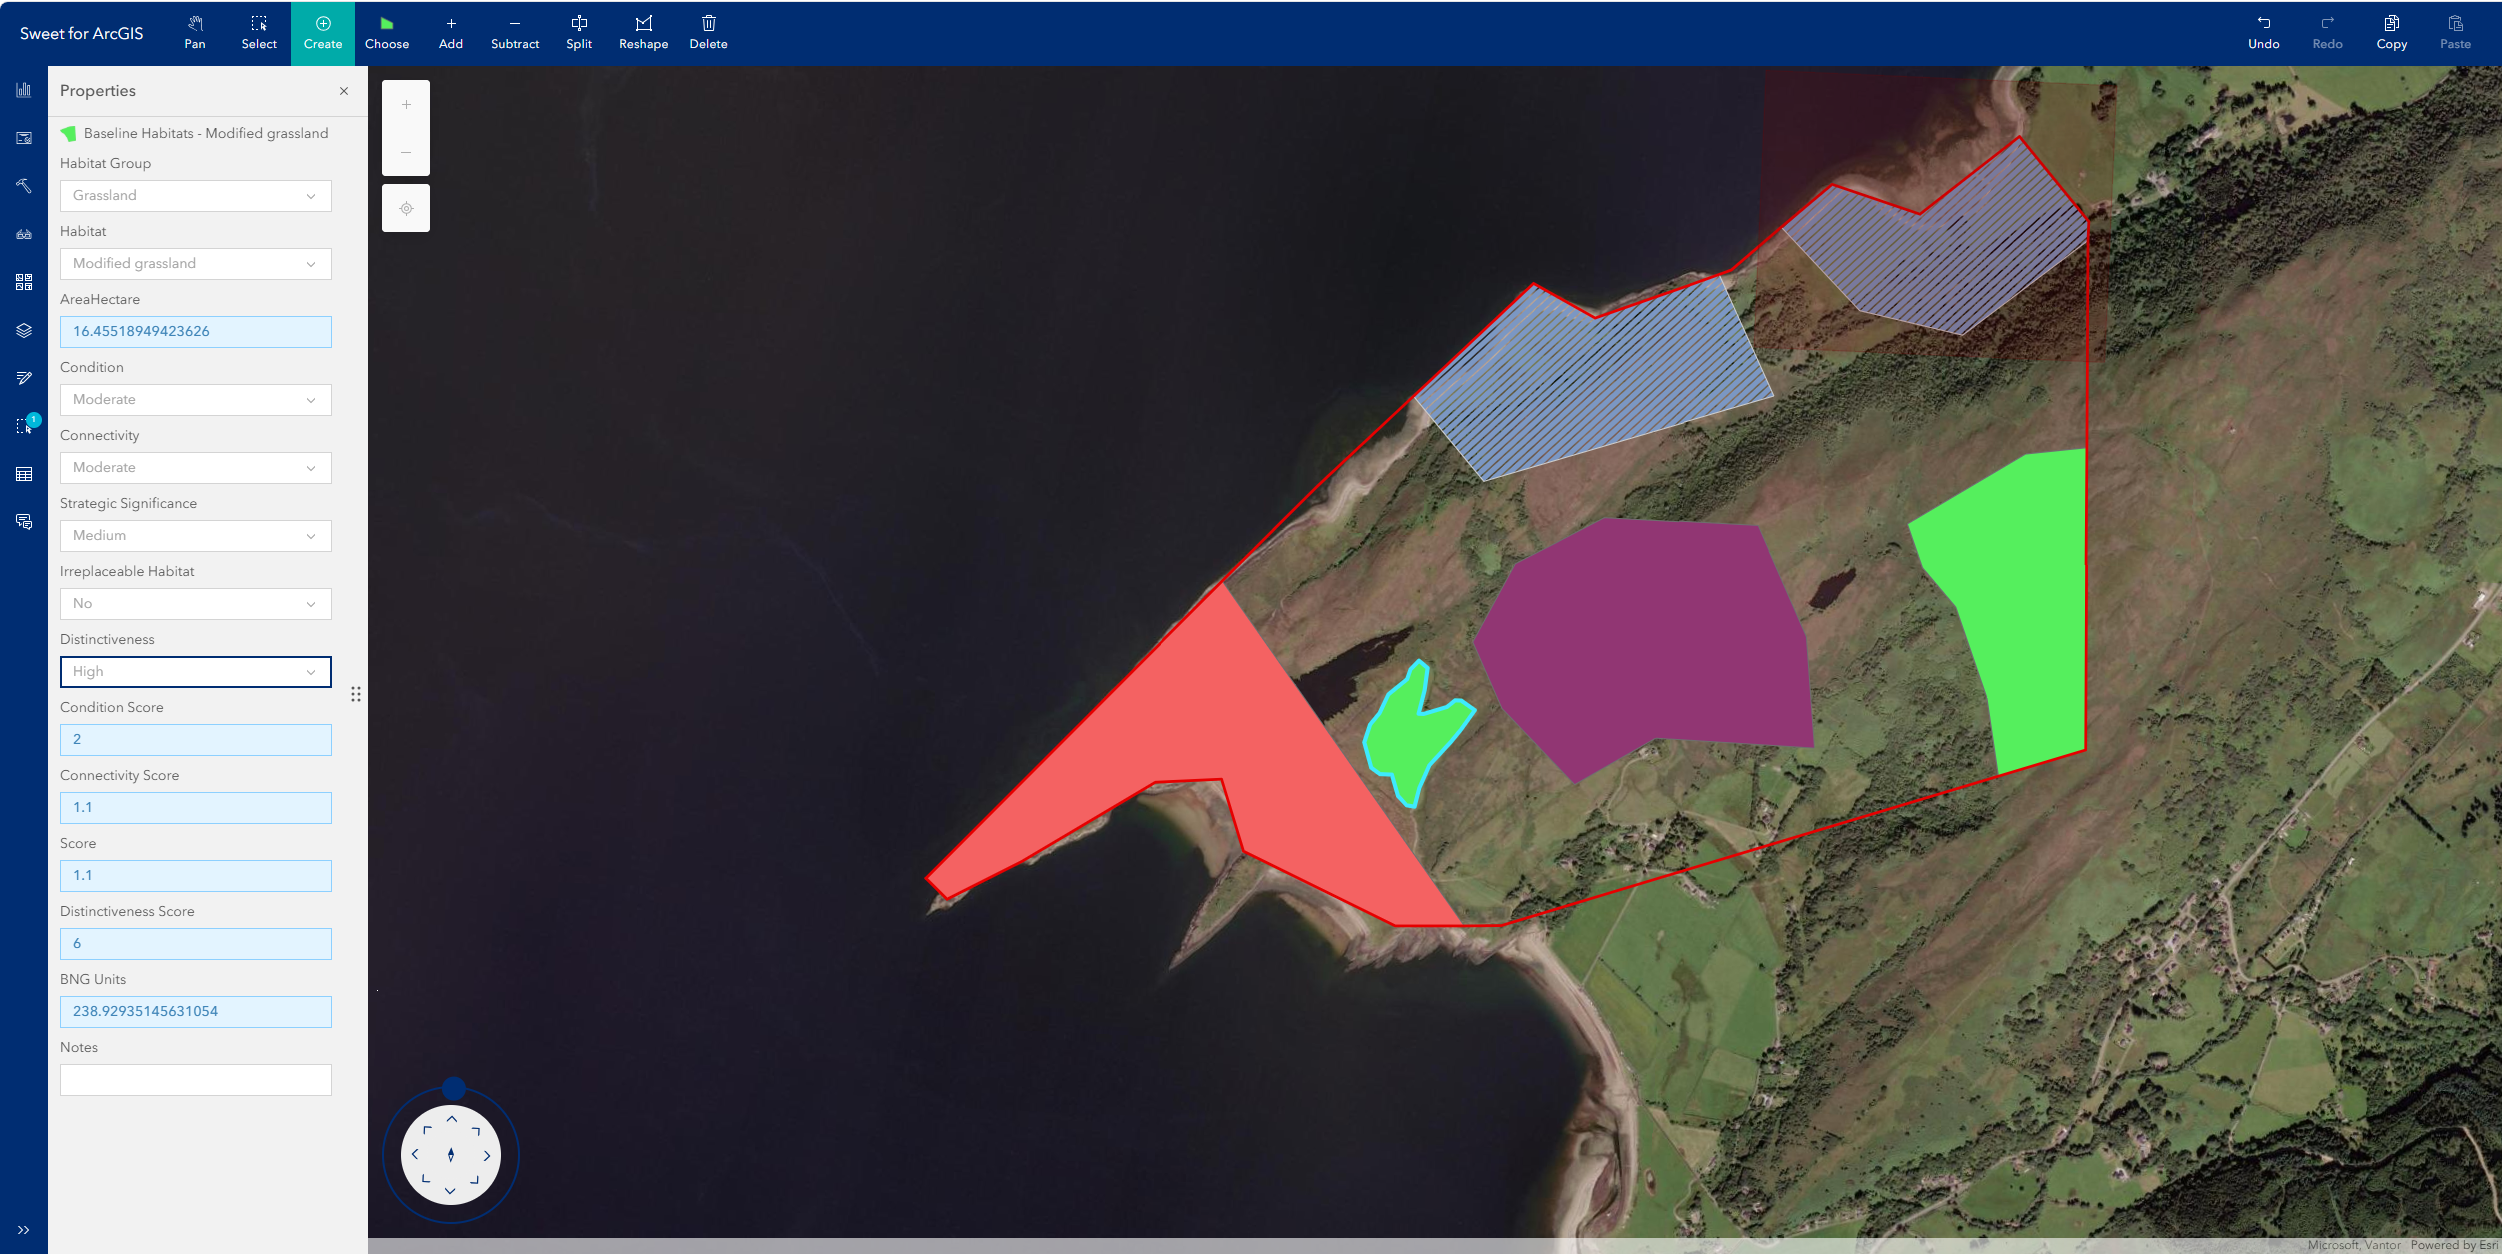
Now, ecologists can conduct full habitat assessments in the field, collect habitat data on their mobile devices and upload it seamlessly to GeoHub. While still out on site, or when back in the office, they can mark areas of habitat that may be lost by planned new developments on digital maps. They can then draw in the areas covered by proposed habitat restoration or enrichment schemes and instantly generate a mathematical value or ‘score’ to quantify the predicted impact on biodiversity. All the data is displayed in live site-specific dashboards, giving everyone a clear and up-to-the-minute view of the BNG status at each location.
Benefits
Effective evaluation of biodiversity potential
Using the new ArcGIS-based workflow, ecologists are now better able to evaluate the potential of proposed habitat enhancements and compare different options scientifically using numerical BNG scores. They can upload designs for several possible habitat restoration schemes; rapidly calculate and recalculate BNG scores to find the optimal approach; and make better informed decisions about which schemes to adopt to deliver the greatest net gain in biodiversity.
Instant access to biodiversity calculations
Having instant access to biodiversity calculations is very powerful, particularly during site selection processes and in early stage developments. The implications for BNG can be taken into account at a far earlier stage in planning and development processes and better decisions can be made about where to locate new infrastructure and buildings to minimise impacts on existing habitats. Previously, early stage BNG assessments may not have been undertaken at all sites, due to cost and time constraints.
Significant time and resource savings
The introduction of the new ArcGIS-based workflow for calculating BNG values has led to significant time and resource savings. For example, office-based staff no longer have to painstakingly collate and prepare the data needed for BNG calculations and manually upload data for dashboards. “Ecologists can calculate the BNG values at a site, within seconds, whereas previously this process would have taken several people hours if not days of effort,” Alley adds.
Clearer focus on BNG performance
The new BNG dashboards help staff at SSE Renewables to focus on the company’s BNG targets and work more purposefully towards achieving them. Currently, dashboards are only available for specific sites, but the company ultimately aims to have dashboards for all of its operational and development sites, as well as a single dashboard showing company-wide BNG progress across all hydro, wind, solar and battery operations. Wrapping up Alley says, “Biodiversity is fundamental to the company’s strategic goals. ArcGIS helps everyone to understand what biodiversity exists and how we can have a positive impact on it.”