Flooding poses an extreme threat to people’s livelihoods. Heavy rain and storm events cause surrounding rivers and coasts to become inundated with water, bringing a wealth of social, environmental and economic impacts. With floods of greater intensity predicted across much of the UK and the globe, we’re investigating flooding as an issue of increasing importance.
The identification of homes, businesses, and industries most at risk to the impacts of flooding is vital. It helps local governments form evacuation plans, identify areas in need of flood defences, and is used by insurance underwriting companies to quantify impacts to assets on their books.
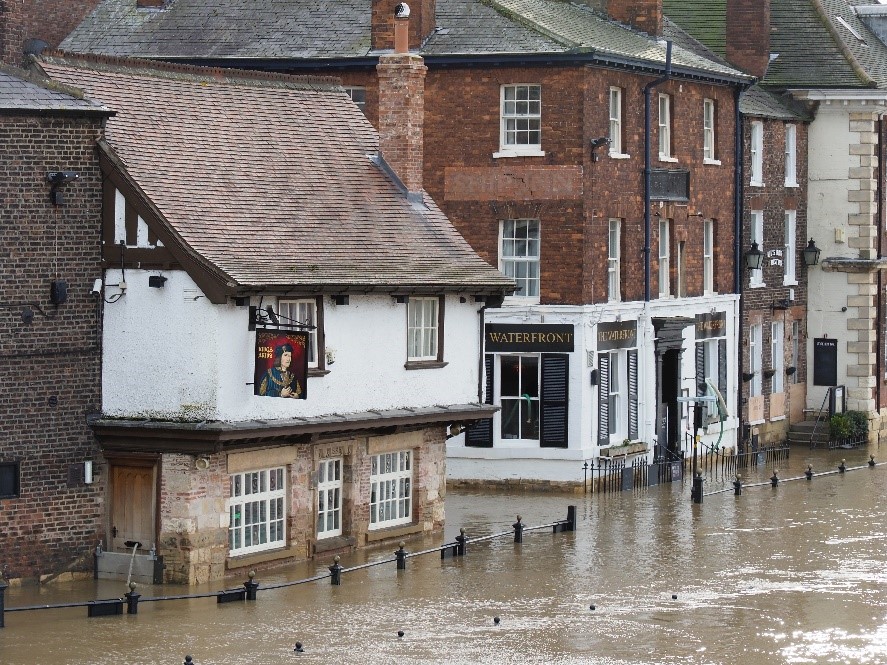
Photo by Don Lodge, Unsplash.
This blog will take you through a worked example as to how insurers use premium flood data to identify their assets most at risk. The flood data was provided by JBA, global leaders in flood risk management, and shows UK modelled flood extents and depths outputs at 5m resolution for return periods 20, 75, 100, 200 and 1,000 years.
The JBA UK Flood Map provides the annual probability (return period) and associated intensity (water depth) of flooding for a specific flood type (e.g. river, surface water and coastal) for a single location.
![]() JBA are one of Esri UK’s data partners, providing premium flooding content to ArcGIS users. Esri UK offer JBA data in ready-to-use formats within desktop and online platforms across the ArcGIS system. Delivering this flood data directly removes the burden of data management and maintenance, saving users time, cost and resources whilst ensuring their content is up to date. For more information about JBA and our other premium data partners, check out the Esri UK Data site.
JBA are one of Esri UK’s data partners, providing premium flooding content to ArcGIS users. Esri UK offer JBA data in ready-to-use formats within desktop and online platforms across the ArcGIS system. Delivering this flood data directly removes the burden of data management and maintenance, saving users time, cost and resources whilst ensuring their content is up to date. For more information about JBA and our other premium data partners, check out the Esri UK Data site.
Analysing the hazard to flooding
Step 1.
JBA data is delivered to Esri UK with three different raster layers; Raster Extent (RE), Raster Depth (RD) and Raster Bands (RB) for 3 different flood types. In its simplest form, a raster consists of a matrix of pixels (or cells) organized into a grid in which each pixel contains a value representing information, such as flood depths. These flooding layers change continuously across a landscape, providing regularly paced representations of the flood hazard.
- RE represents the area that is indicated to flood with the same annual probability.
- RD represents the modelled water depths (m).
- RB is a classified version of the RD layer into five flood depth bands, each associated with a specific depth interval.
This analysis works with the RB layer at a return period of 75 years. This means any at-risk assets identified have a 1.33% chance of being affected by river, surface-water or coastal flooding in a given year. The basemap used is the Ordnance Survey’s (OS) MasterMap Topography Layer– the most detailed base mapping product available for Great Britain. With over 500 million real-world features, it gives users the confidence to make location-based decisions about assets and environmental risk.
Esri UK are a trusted Licenced OS Partner – check out their webpage for more information about their products, as well as the other premium basemaps we have available.
Step 2.
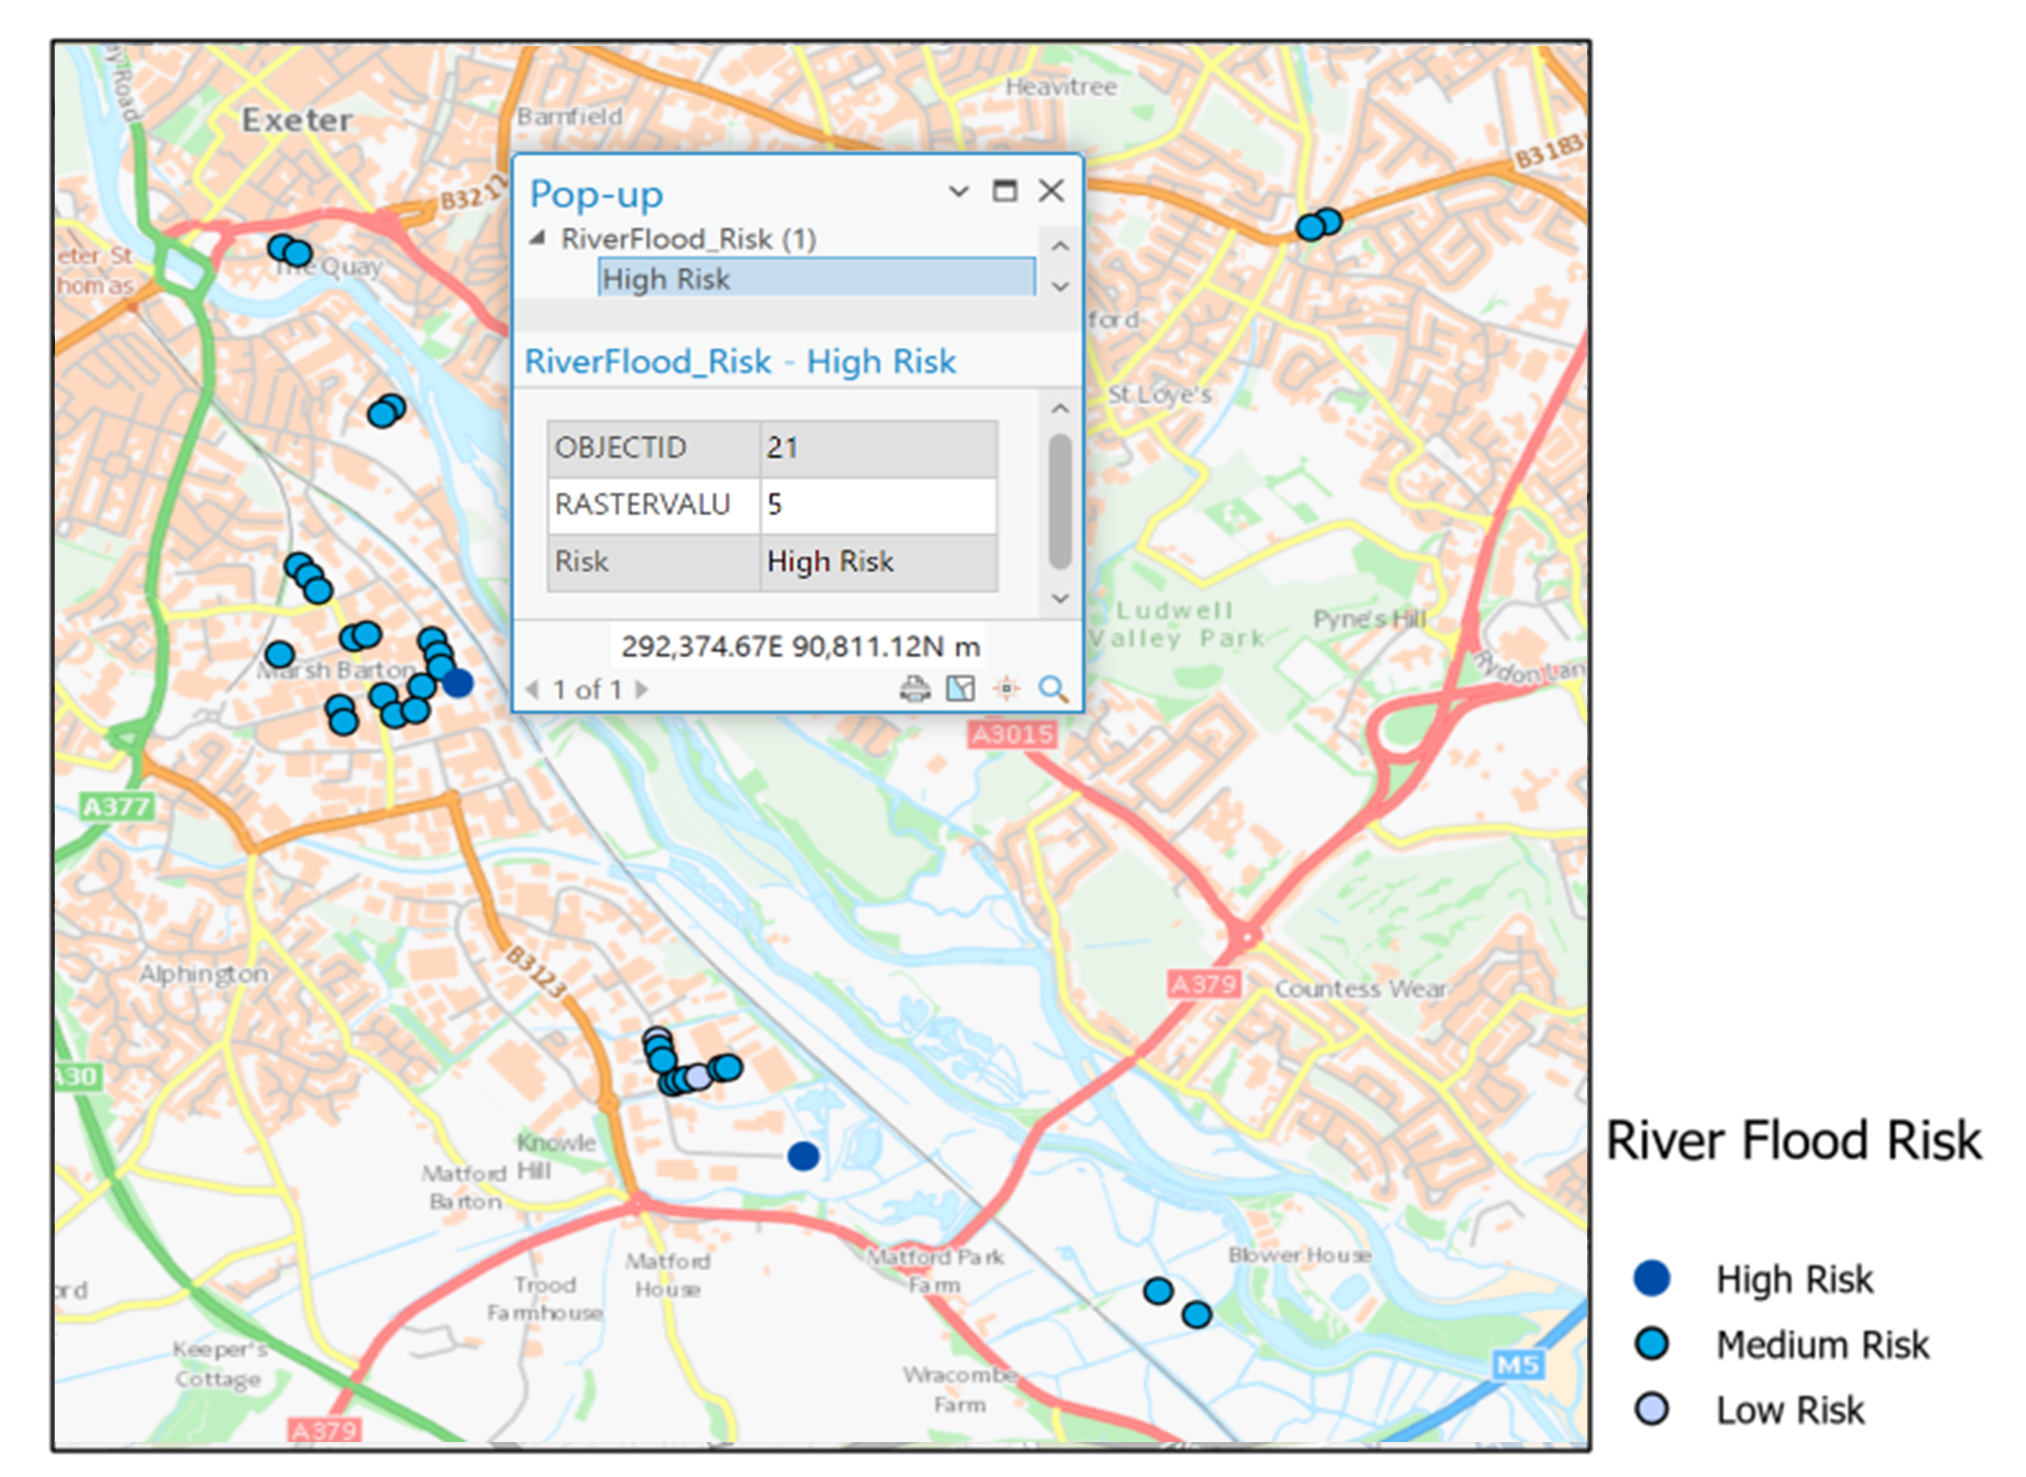
Here, I’ve loaded a point dataset showing the locations of houses and other building assets on my books. This is overlaid with RB layer for a 75 year river flood map in ArcGIS Pro. The image below shows the location of my assets indicating those that might be impacted by flooding.
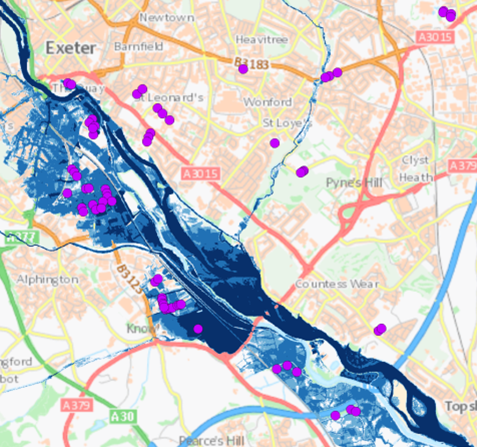
Map output showing which of our properties would be impacted in a 75- year return period. JBA UK Flood Map © 2023 JBA, Ordnance Survey MasterMap Topography Layer © Crown copyright and database rights 2023 OS 100030994.
Step 3.
To assign each of my properties a depth band, I use the Reclassify Field geoprocessing tool to reclassify the depth categories into whole number; 1 through 5. 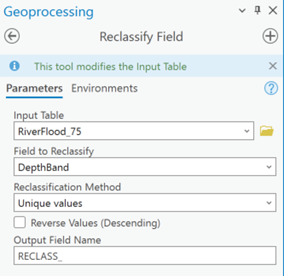
Step 4.
Next, using Extract Values to Points geoprocessing tool, I can extract the raster value that lies underneath each of my property assets and record this value in the attribute table.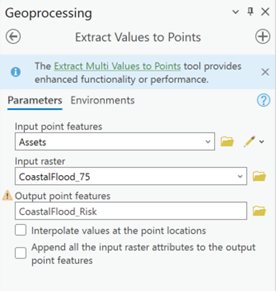
Step 5.
Once the ranked values have been extracted, I need to symbolise each asset in a meaningful way. Ranked values aren’t that useful outputs for analysis, as they give no clear indication of the risk posed to each asset. Using the Calculate Field data management tool, I can assign each rank a risk value – rank 1 and 2 as Low Risk (<10 cm), rank 3 and 4 as Medium Risk (<1m) and rank 5 as High Risk (above 1m).To do this, I wrote a snippet of Python code, as shown below:
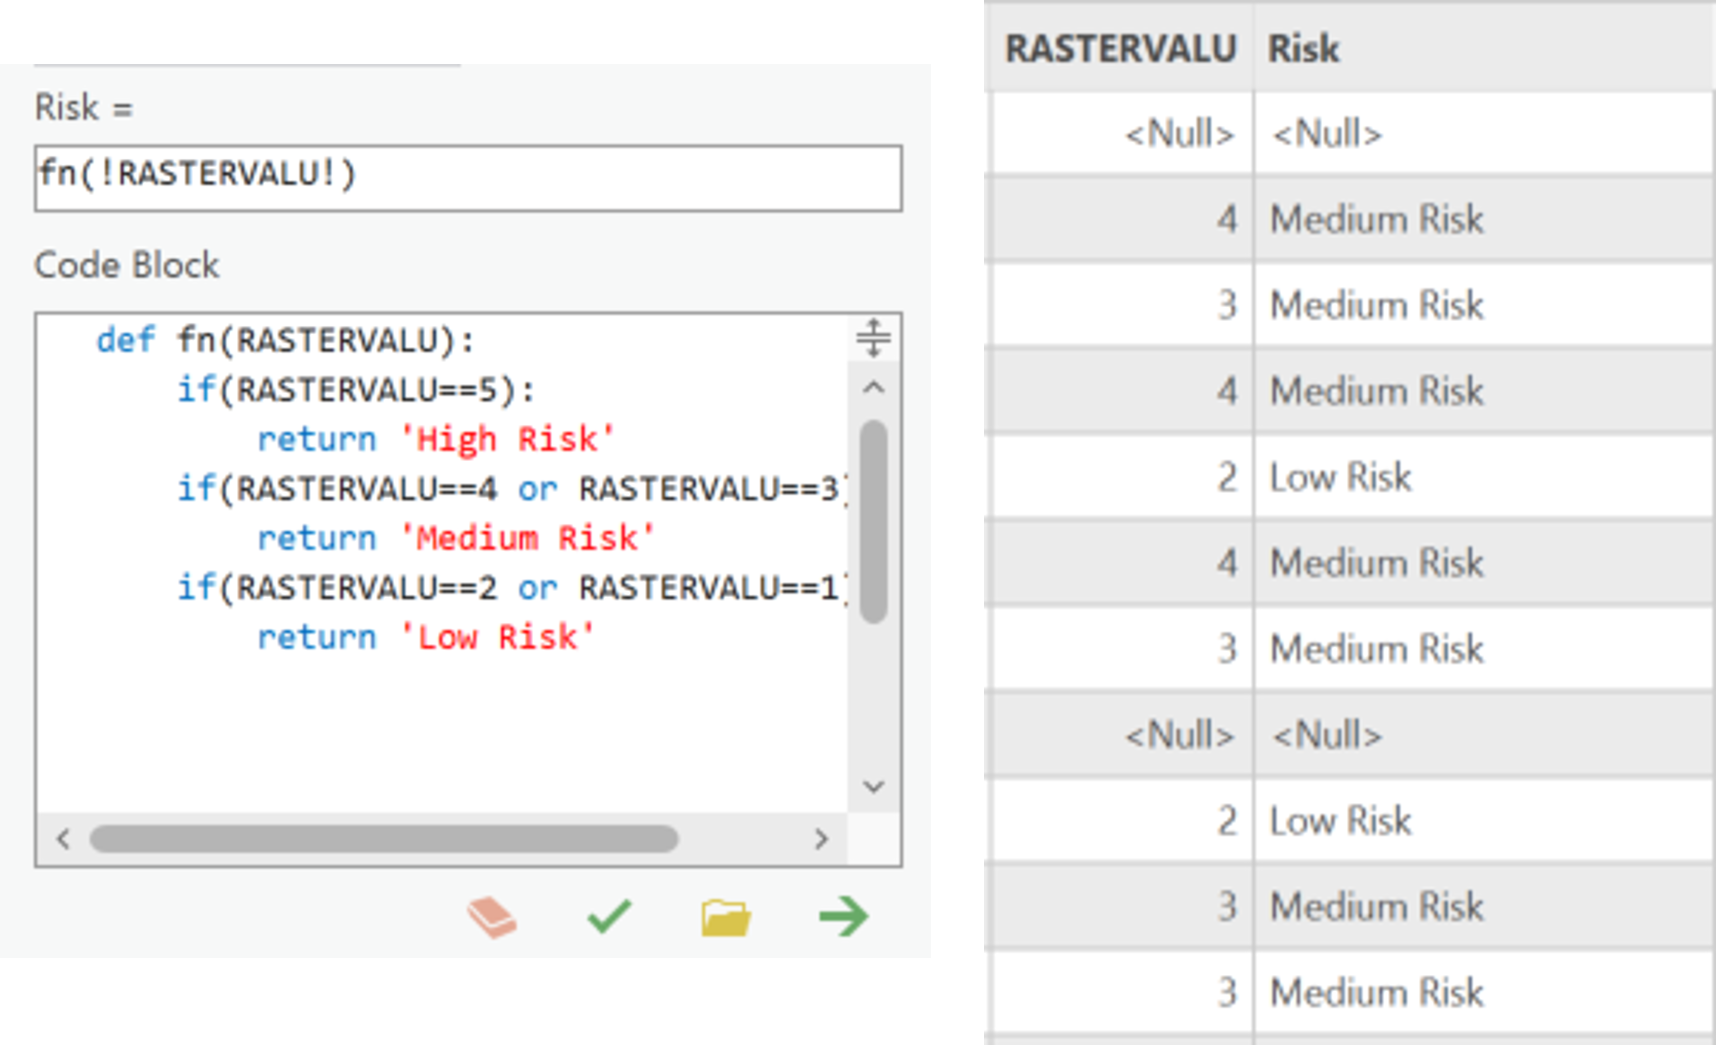
Python code used in the Calculate Field tool (left) and Output table for the assets attribute table (right)
Step 6.
Finally, I’ve symbolised each property to represent their Risk Value: the darker the blue; the higher the flood risk.
Note – some assets did not overlap the flood area. These assets were given a value of ‘null’ and left transparent, as we found no risk of flooding to the property in this return period scenario.
Our results
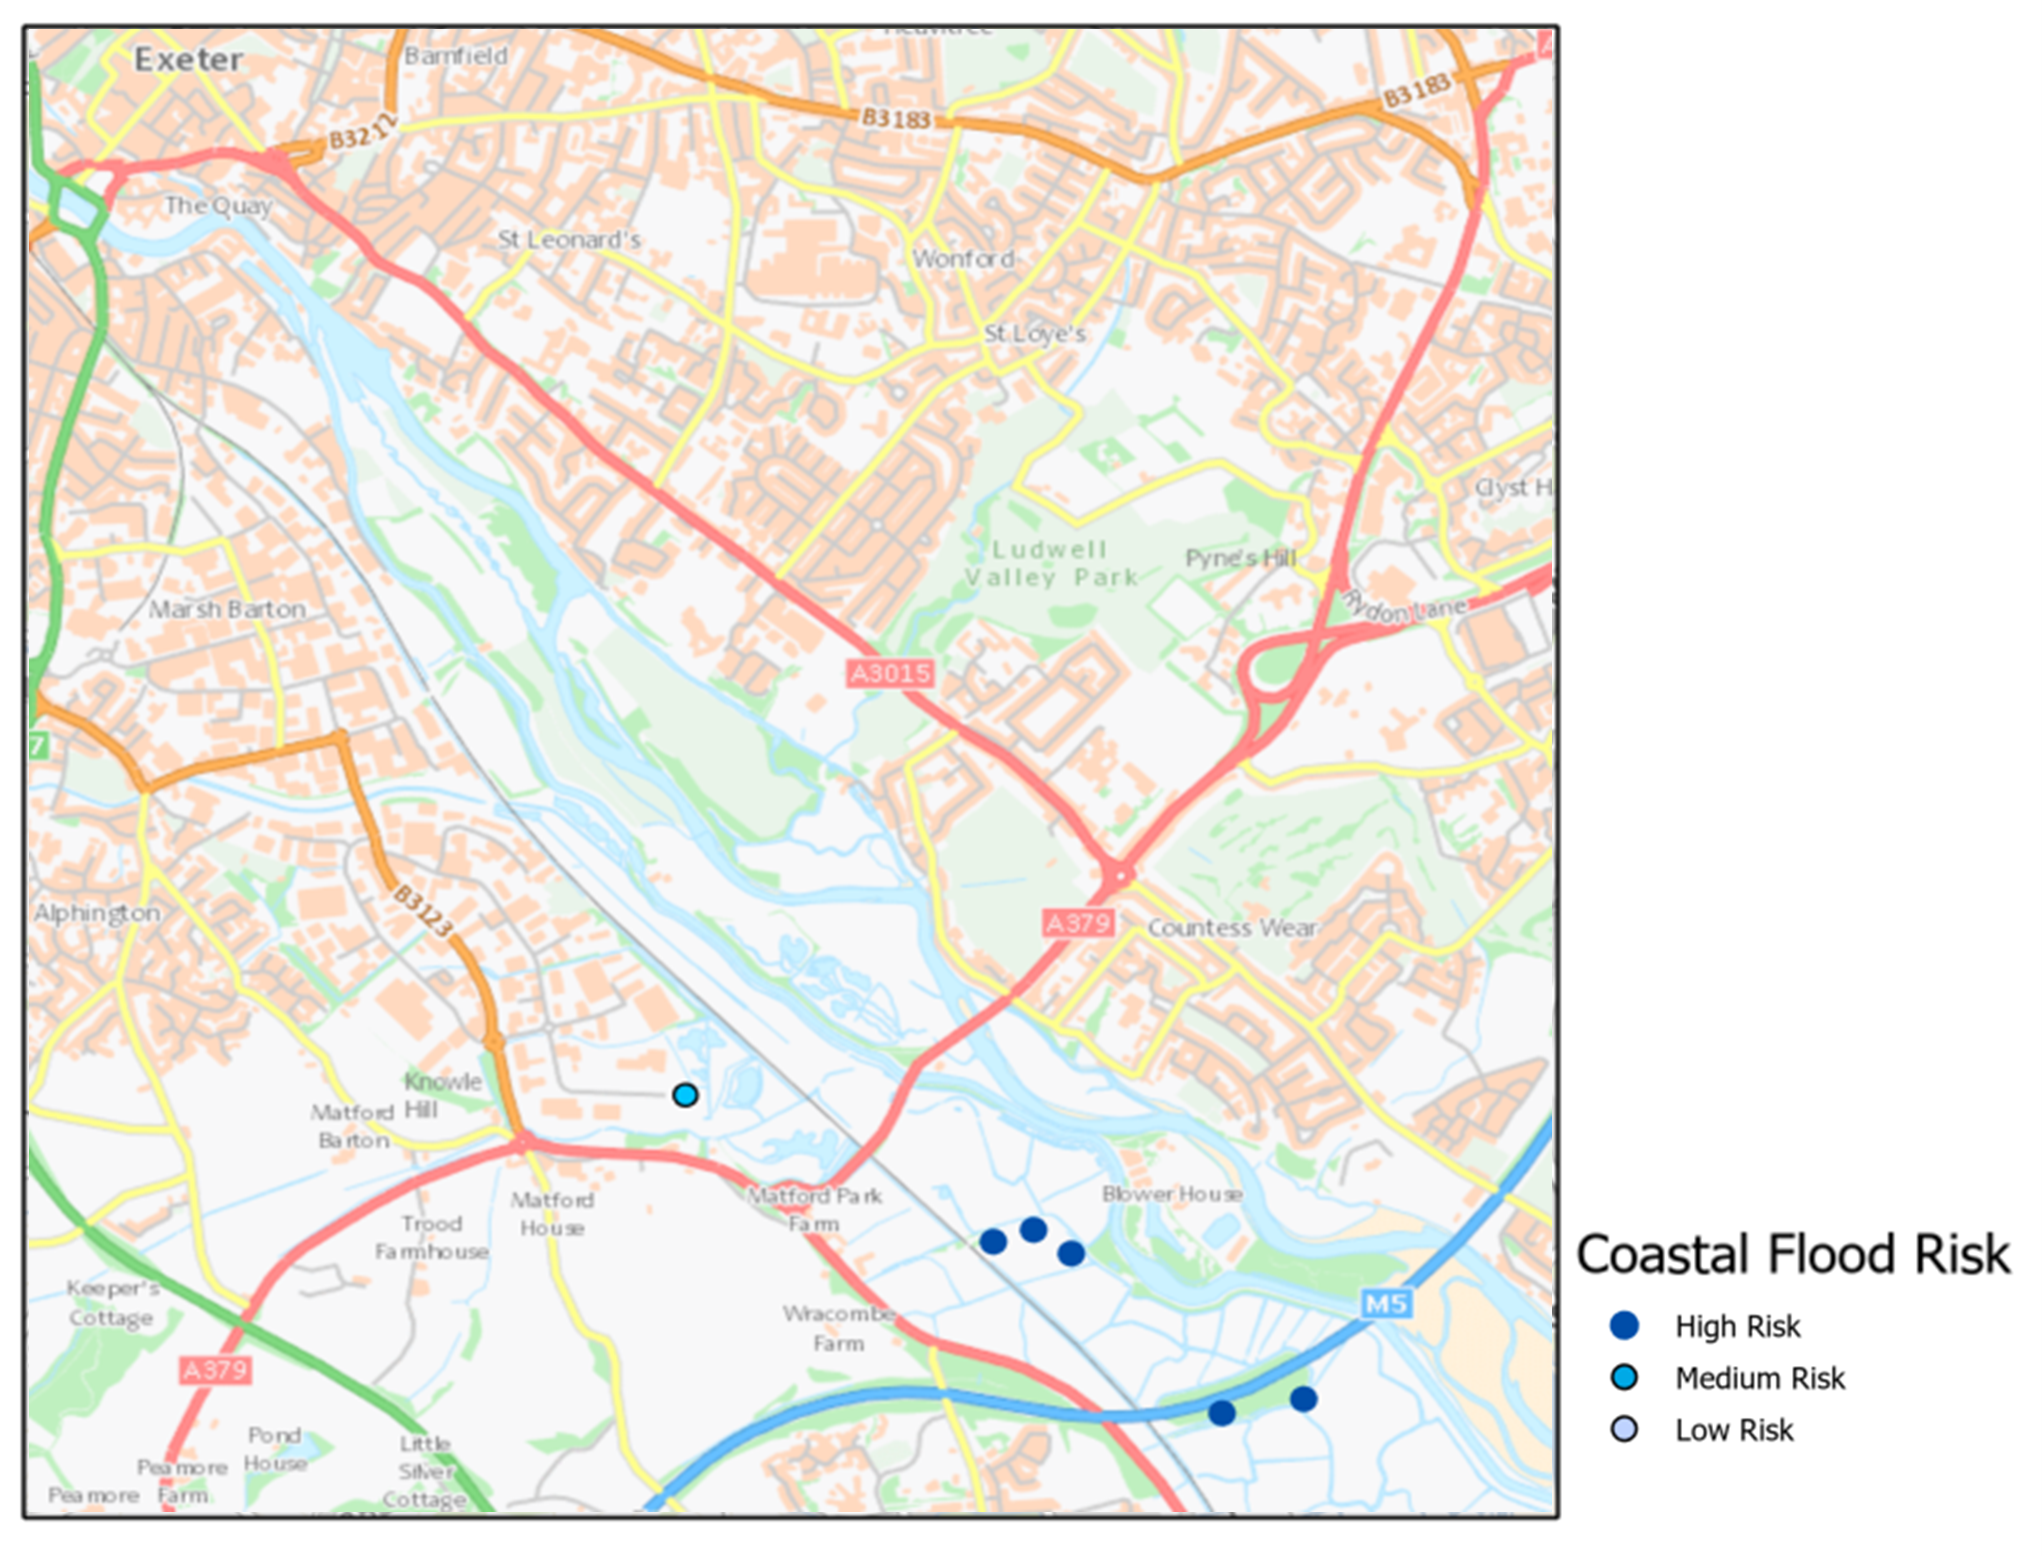
The final output map is shown below, with each asset showing a risk level using our analysis method, based on JBA’s river, surface water and coastal flooding data.
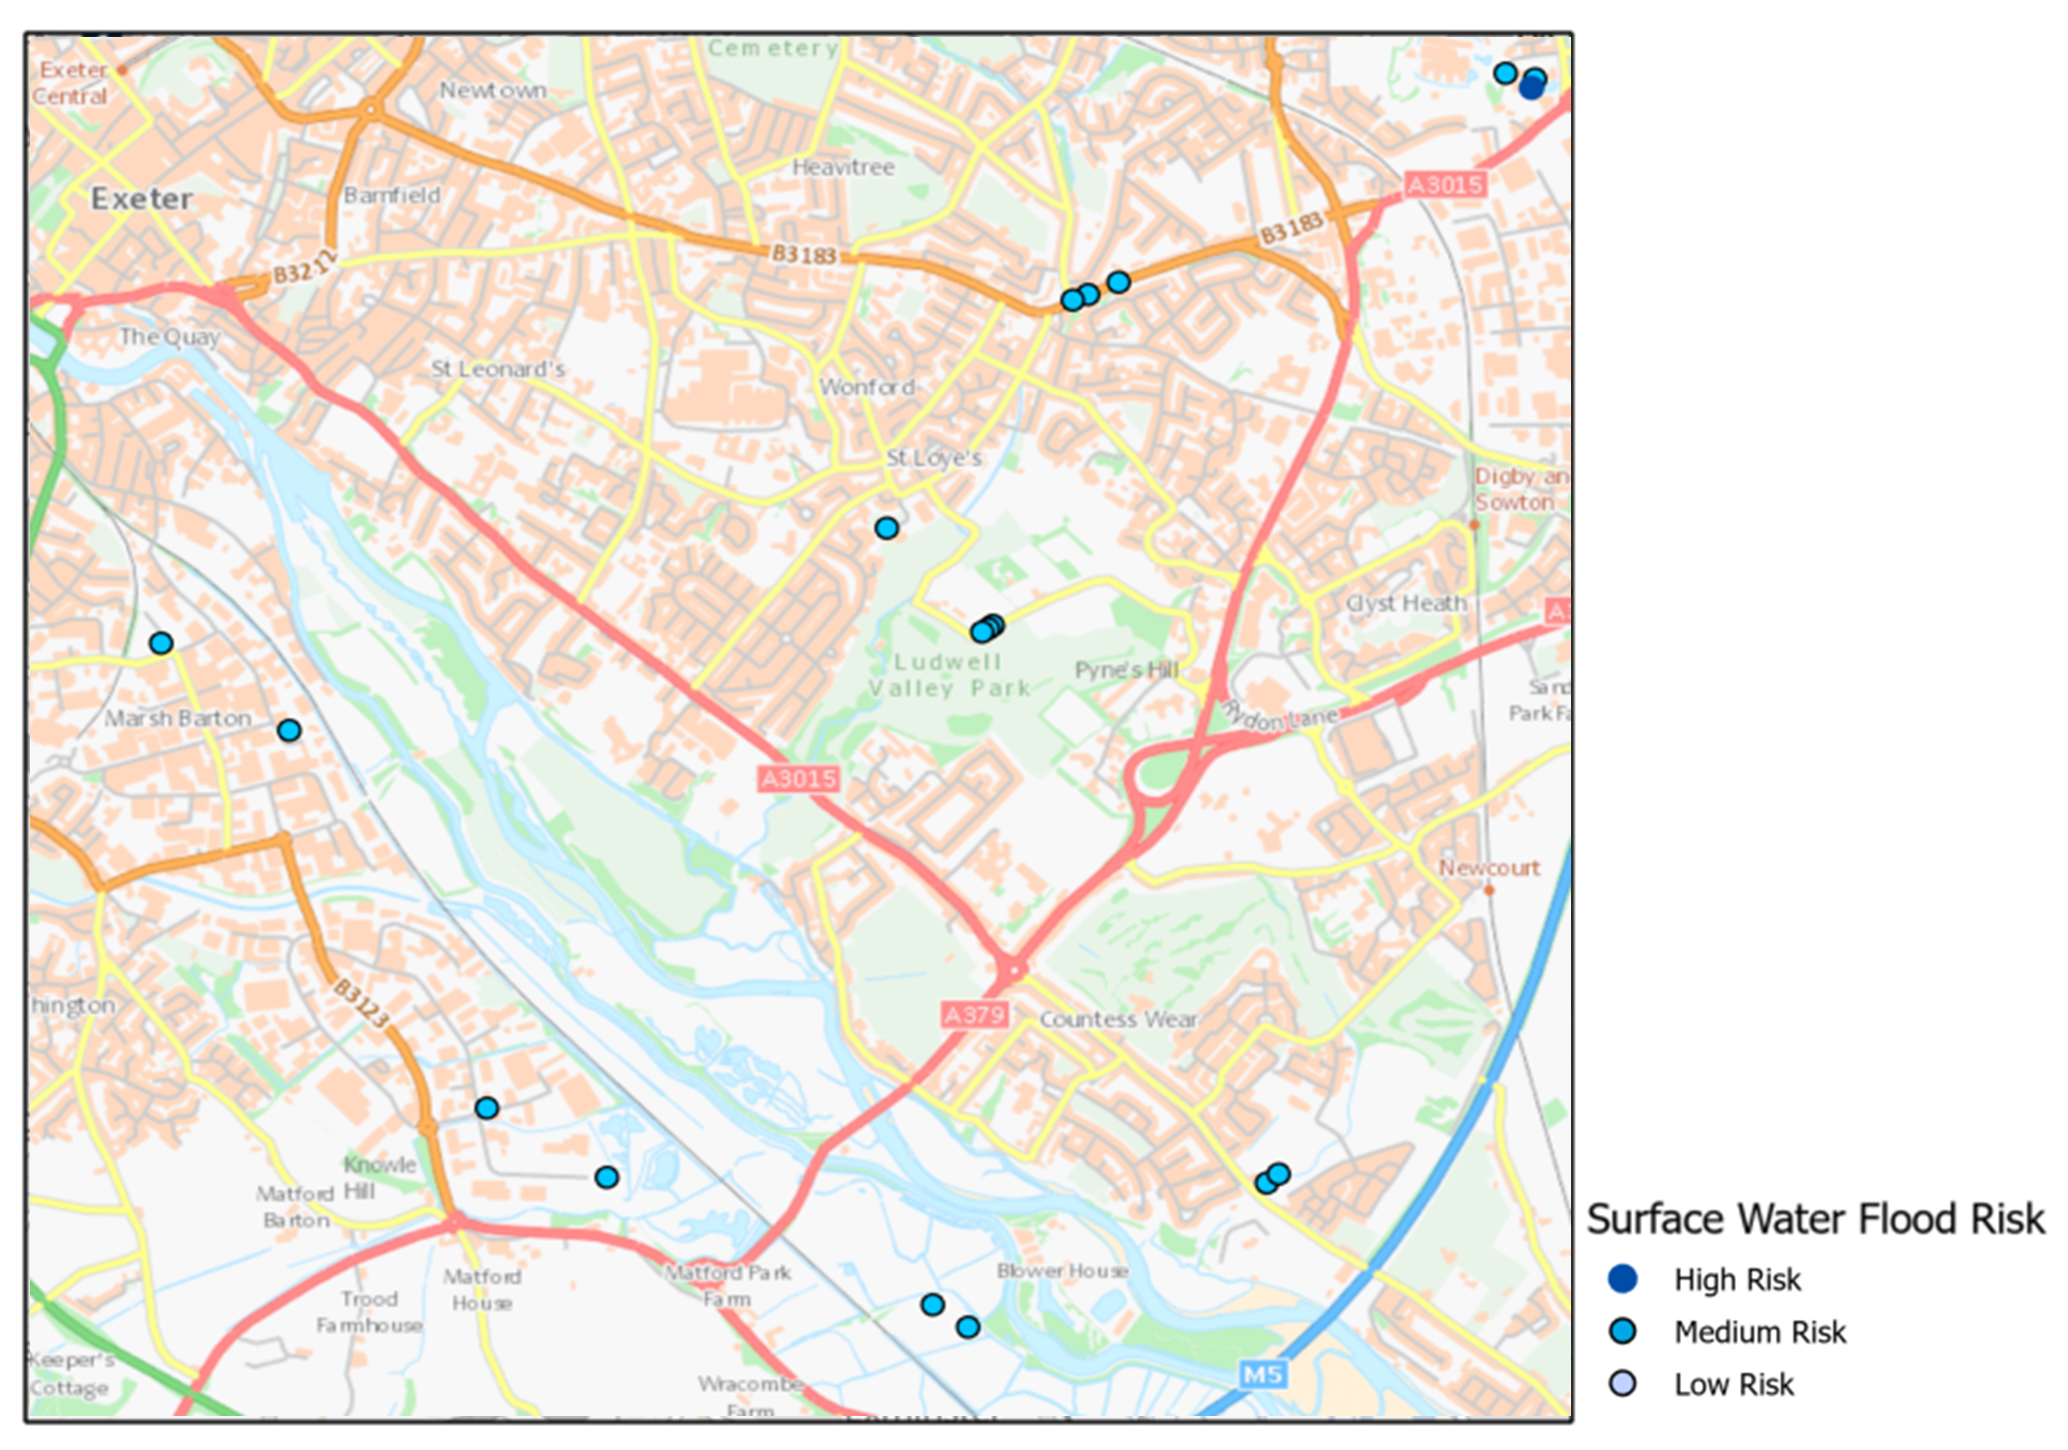
Our output risk rating based on JBA UK Flood Map data © 2023 JBA, Ordnance Survey MasterMap Topography Layer © Crown copyright and database rights 2023 OS 100030994.
Further applications
This analysis focused on a 75-year return period, but you could look at the data for other return periods to compare the output. Esri UK have published some other useful blogs that look at streamlining workflows in ArcGIS Pro.
In addition to using a point dataset for our asset data, this analysis can be carried out with a polygon dataset, to visualise flood risk across a whole area. Using the Extract by Mask tool from the Spatial Analyst extension, I was able to assess the risk across land parcels I manage.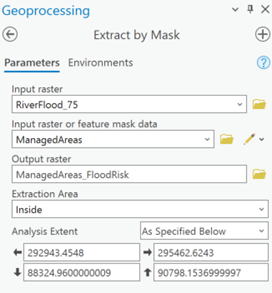
JBA’s Global Flood Maps are the highest resolution national scale flood mapping available; at 5m resolution for the UK, US, Australia and much of Europe, and 30m resolution worldwide. This powerful data combined with the analytical capabilities of the ArcGIS System can quickly and confidently identify assets and land at the greatest risk to flooding.
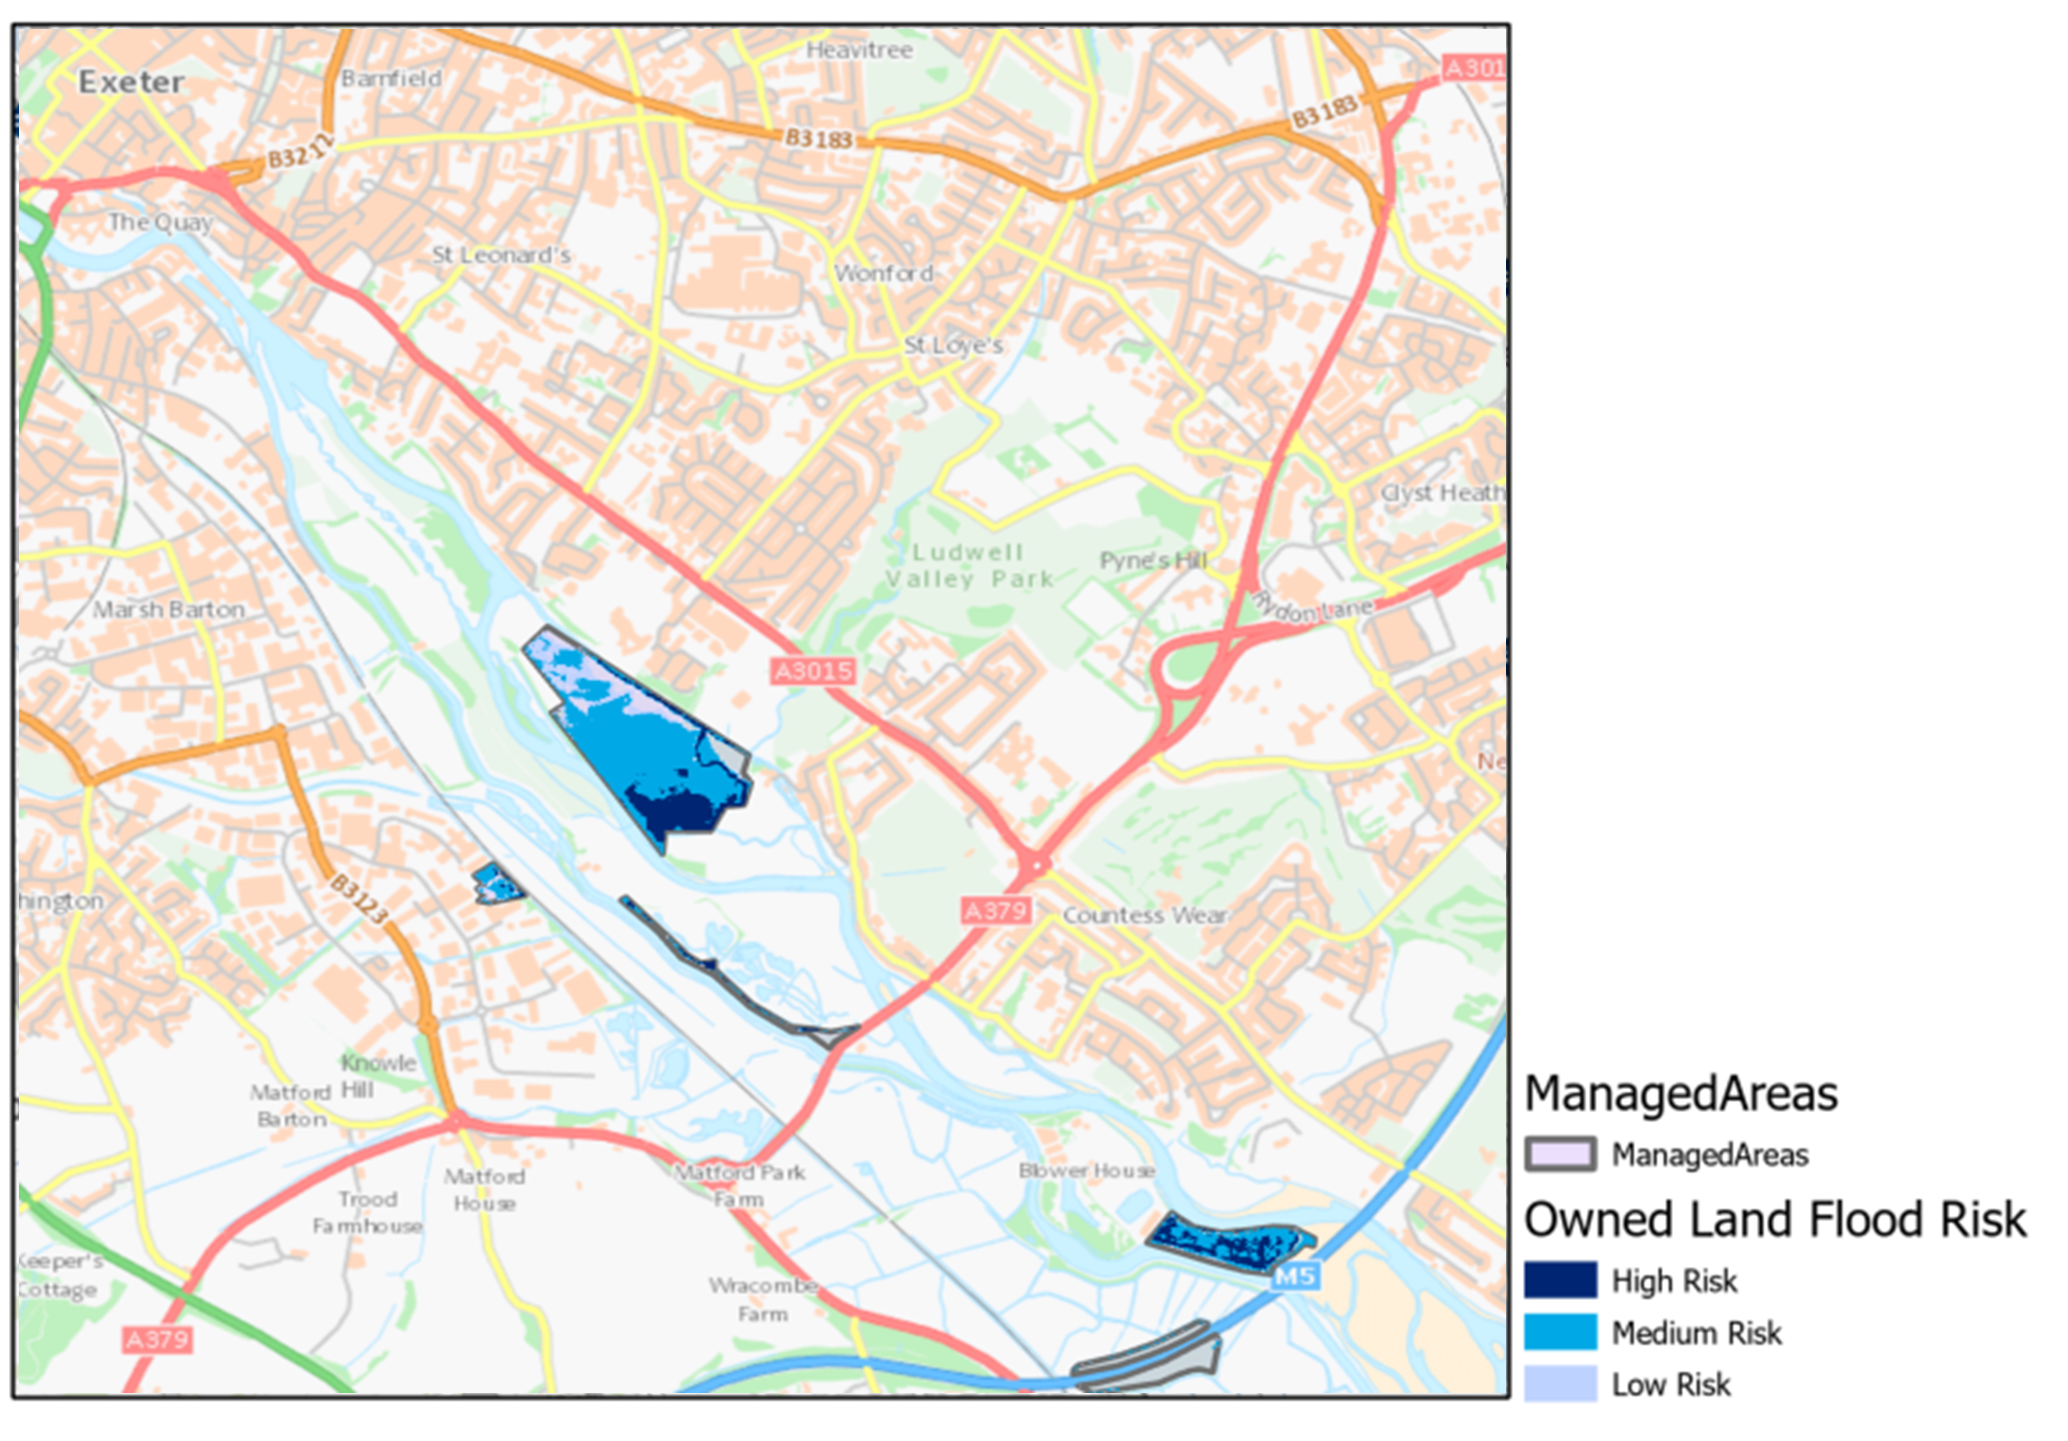
Our output risk rating based on JBA UK Flood Map data © 2023 JBA, Ordnance Survey MasterMap Topography Layer © Crown copyright and database rights 2023 OS 100030994.
Check out this StoryMap for a full overview of open and premium Flooding Services Esri UK can provide and explore the Esri blog site for more information on how you can use ArcGIS in flooding analysis.
For more information on JBA datasets or other premium data, email content@esriuk.com.