Blend modes have been available in ArcGIS Online for some time now, and we often see them used to enhance thematic maps with eye-catching cartography. But with 30 different blend modes available in the Map Viewer all applying unique effects to your layers and maps, it is easy to feel overwhelmed by all the possibilities!
Step outside of static blending
If you’re anything like me, your average interaction with blend modes will be using Multiply to give your maps a bit more visual interest. My go-to is to blend the World Hillshade layer from the ArcGIS Living Atlas onto any basemap, and sit back in delight at my cartographic genius.
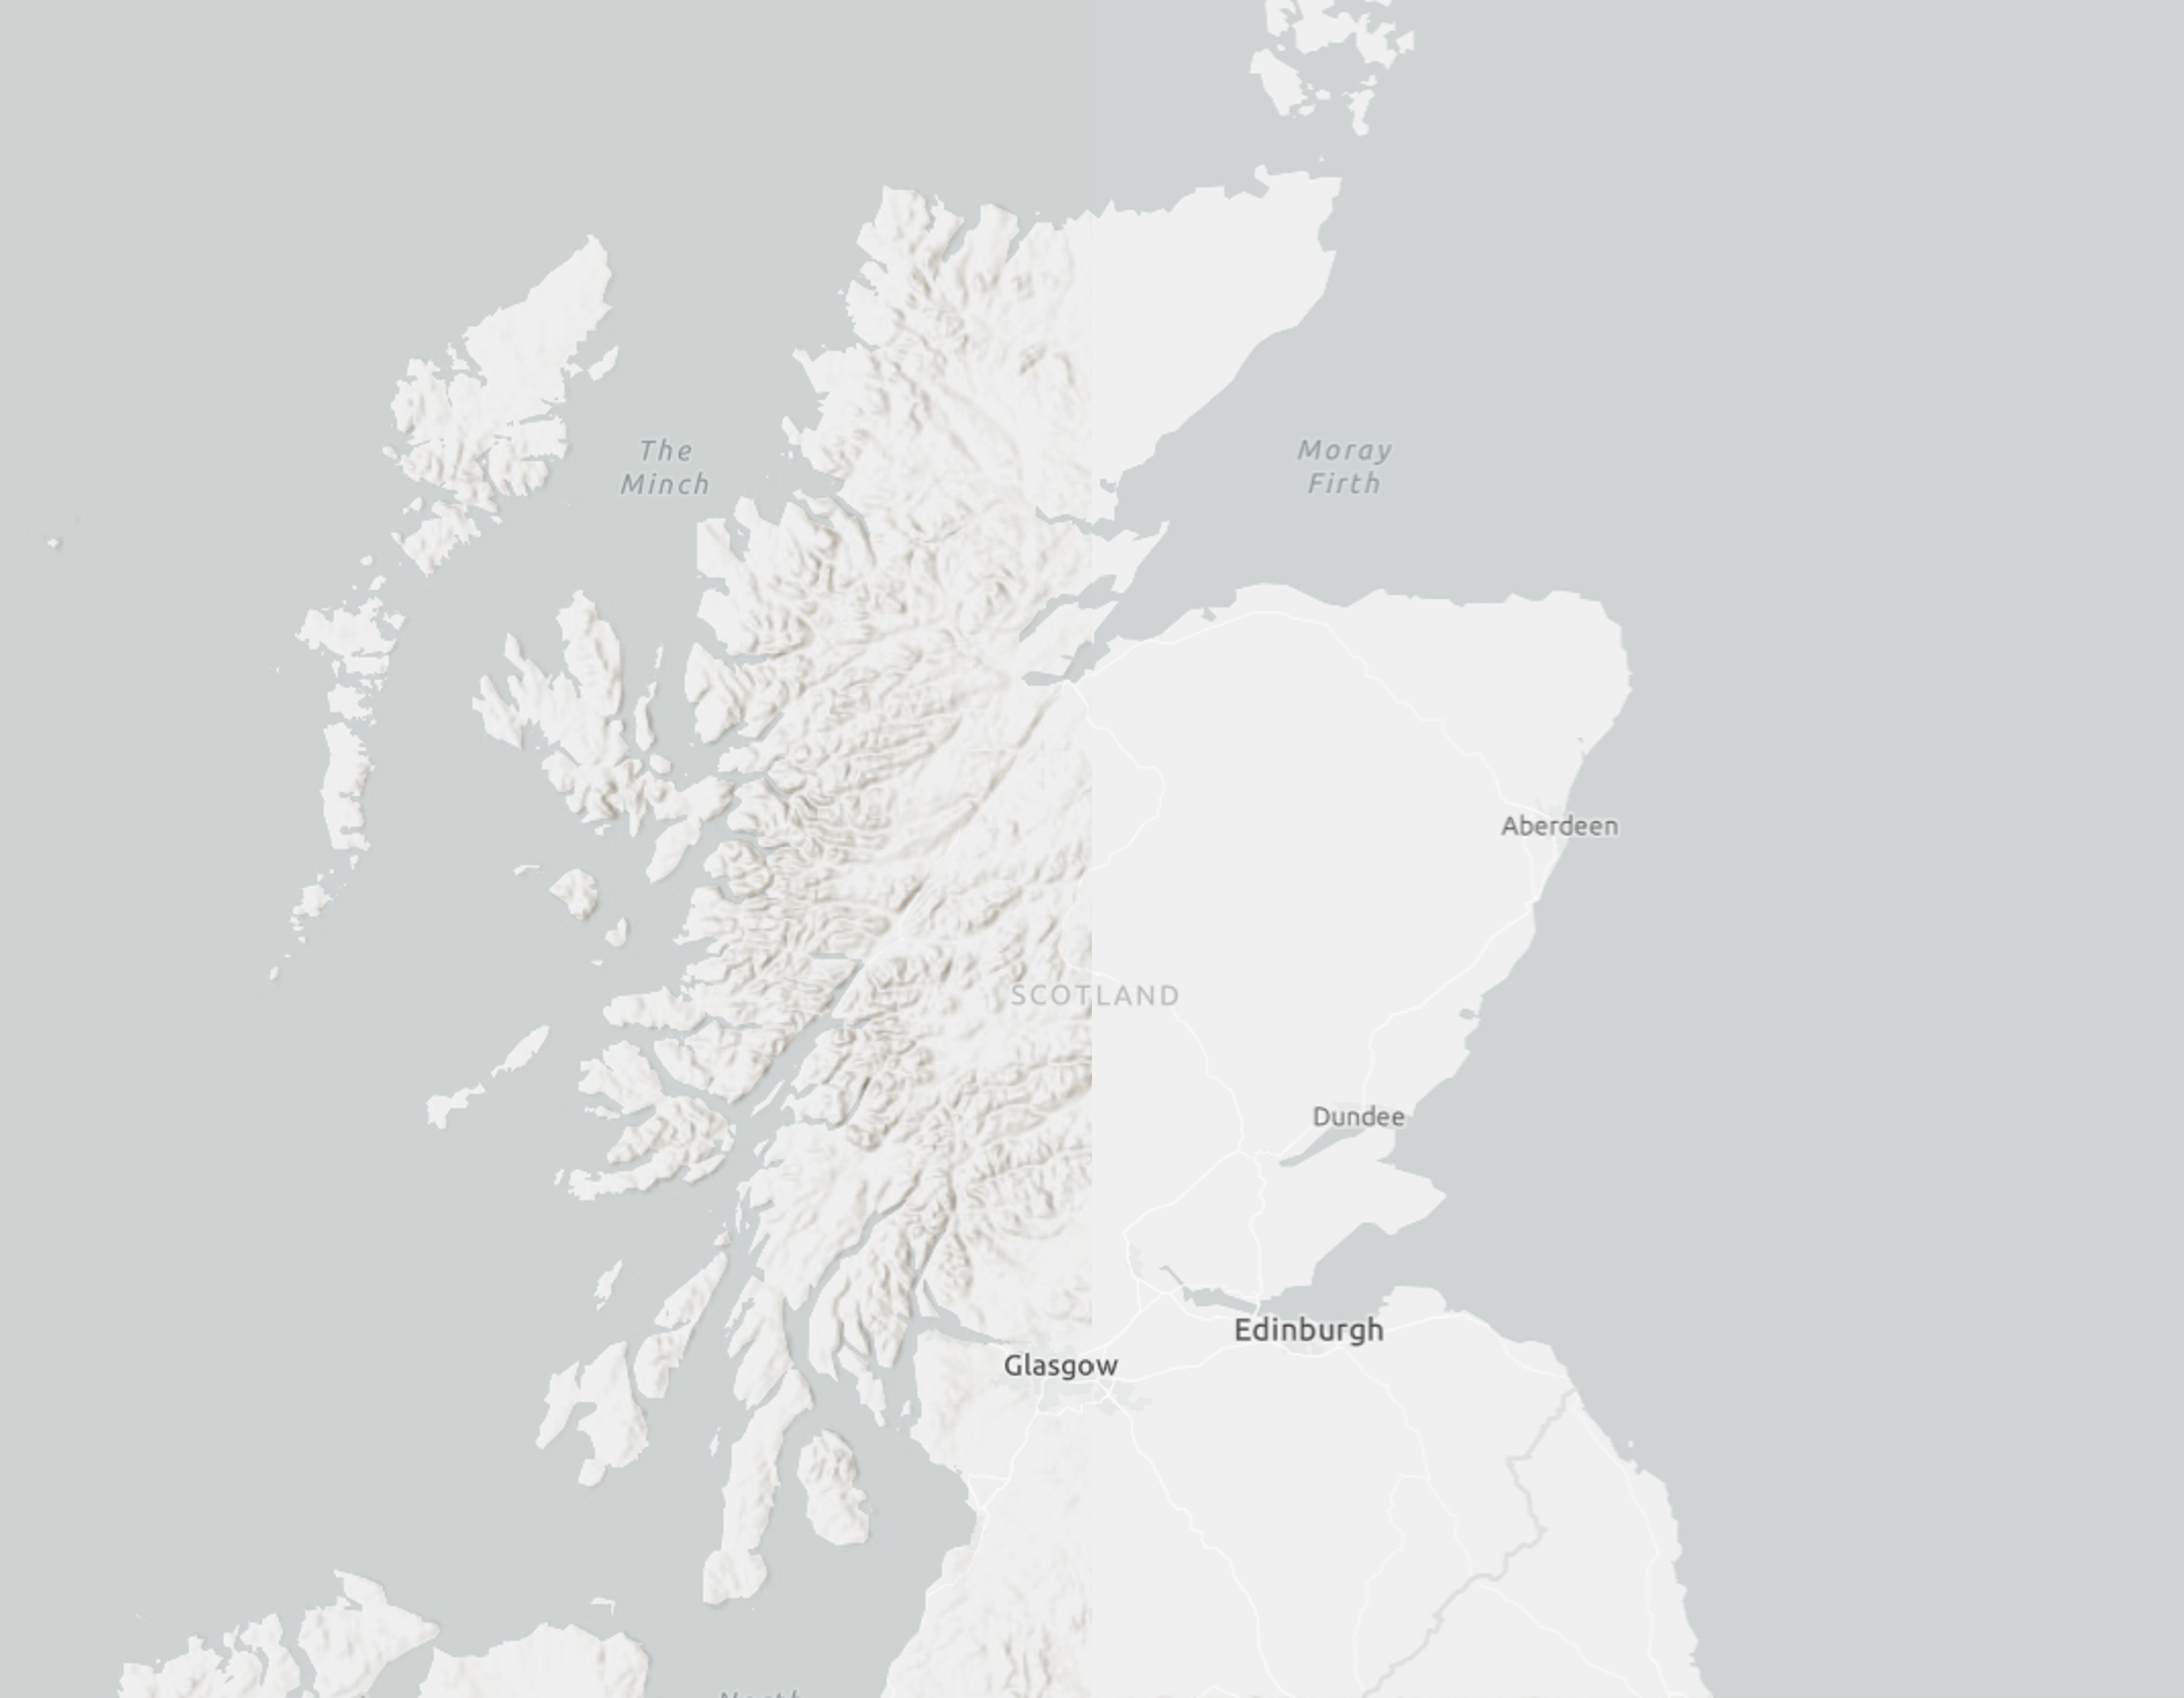
(Left) World Hillshade blended on top of the Light Gray Canvas basemap. (Right) No layer blending applied.
And whilst this looks great, did you know that blend modes can also be applied to act as dynamic filters, highlighting key information on your maps as your data changes?
This can be particularly useful for visualising time-enabled data, or polygon layers which use dynamic generalisation. You can also use blend modes in conjunction with layer visibility ranges to show a variety of information about an area of interest, which can change at different scales.
Getting started
If you’re new to blend modes in ArcGIS Online, you can access Blending under the Properties tab in the Map Viewer. The best way I’ve found to get a grasp of what each option does is to just choose one and see what happens (although this Blend Mode helper may provide some more scientific backing for anyone who would like to dive a bit deeper).
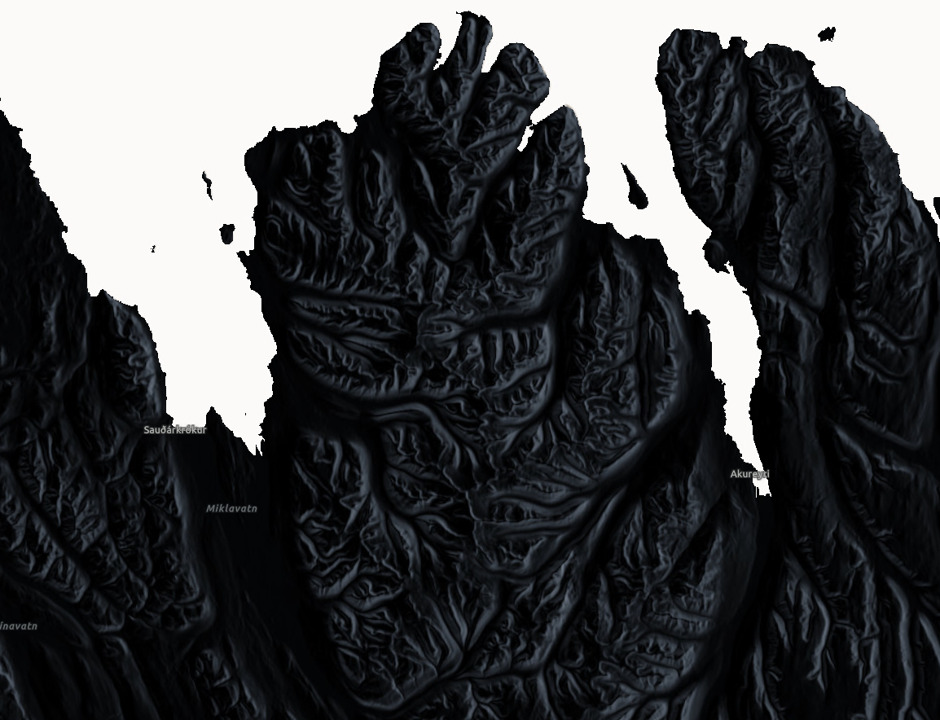
Testing out the Difference blend mode resulted in this interesting view of Iceland’s glacial landscapes.
To help you understand the purpose of each blend mode available in ArcGIS Online, the options are separated into six themes: Lighten, Darken, Contrast, Component, Compositing, and Invert. The Compositing blend modes are most useful when working with dynamic data; they create visual masks of the contents of either the top layer, the background layer, or both.
Making it dynamic
A great example of how this can work dynamically is by using Source In to overlay an imagery layer onto polygon data. In this example I’ve used the blend mode to clip the Living Atlas’ World Imagery layer to Important Bird Areas from the RSPB. These layers have varying visibility thresholds which allows the map to scale from simple polygons to detailed imagery at different scales.
To make this even more visually effective, I used the Greyscale Layer Effect on a copy of the World Imagery layer to have a black and white copy of the imagery display outside my areas of interest.
Using Source In to clip imagery to an area of interest.
Whilst that example shows how easily blend modes can be used to visually clip your data, the real visual magic is introduced when we have data that is dynamic across time, such as weather data.
By setting the blending to Destination In, polygons which represent rainfall over time can be used to dynamically filter which cities across the UK are predicted to receive rain at any given time.
This map works with only four layers; the white city points and blue rain polygons are displayed normally on the map with no blending or layer effects, and a duplicate copy of each were added to a Group Layer where Destination In was applied. By using a group layer, the blend modes are targeted only to the layers within the group, allowing the rest of the map to display without any blend modes being applied.
Whilst relatively simple, this makes for some cool effects as the polygons move across the map over time.
Blend mode magic: cities across the UK light up blue as they are predicted rainfall (fictional data).
Hopefully this blog has introduced some new techniques for using blend modes with dynamic data in ArcGIS Online. If you want to learn more about blend modes, check out these blogs: