Ever wondered what’s going on right beneath your feet? If your answer is yes, then keep reading to find out about our latest edition to the Living Atlas. The ArcGIS Living Atlas of the World is an evolving collection of ready-to-use, authoritative data layers from around the globe, curated and prepared for easy ArcGIS integration. It is free to use with all ArcGIS subscriptions and includes maps, apps, and data layers to support your work.
The new dataset
As you may have already seen, within the ArcGIS Living Atlas we now have a growing collection of British Geological Survey (BGS) datasets and that collection has just got even bigger! This month we welcomed the BGS 625k Geology dataset, which is an adaption from the dataset available from the BGS website, with simplified attribution and labels of polygons to ensure accessibility for everyone. The BGS 625k Geology dataset is a generalised digital geological map covering the entire UK, featuring three layers: Bedrock Geology, Superficial Geology and Faults.
If you’ve not come from a geology background and would like to know more about what these layers mean, BGS have an excellent article on their website providing some detail on each of the layers.
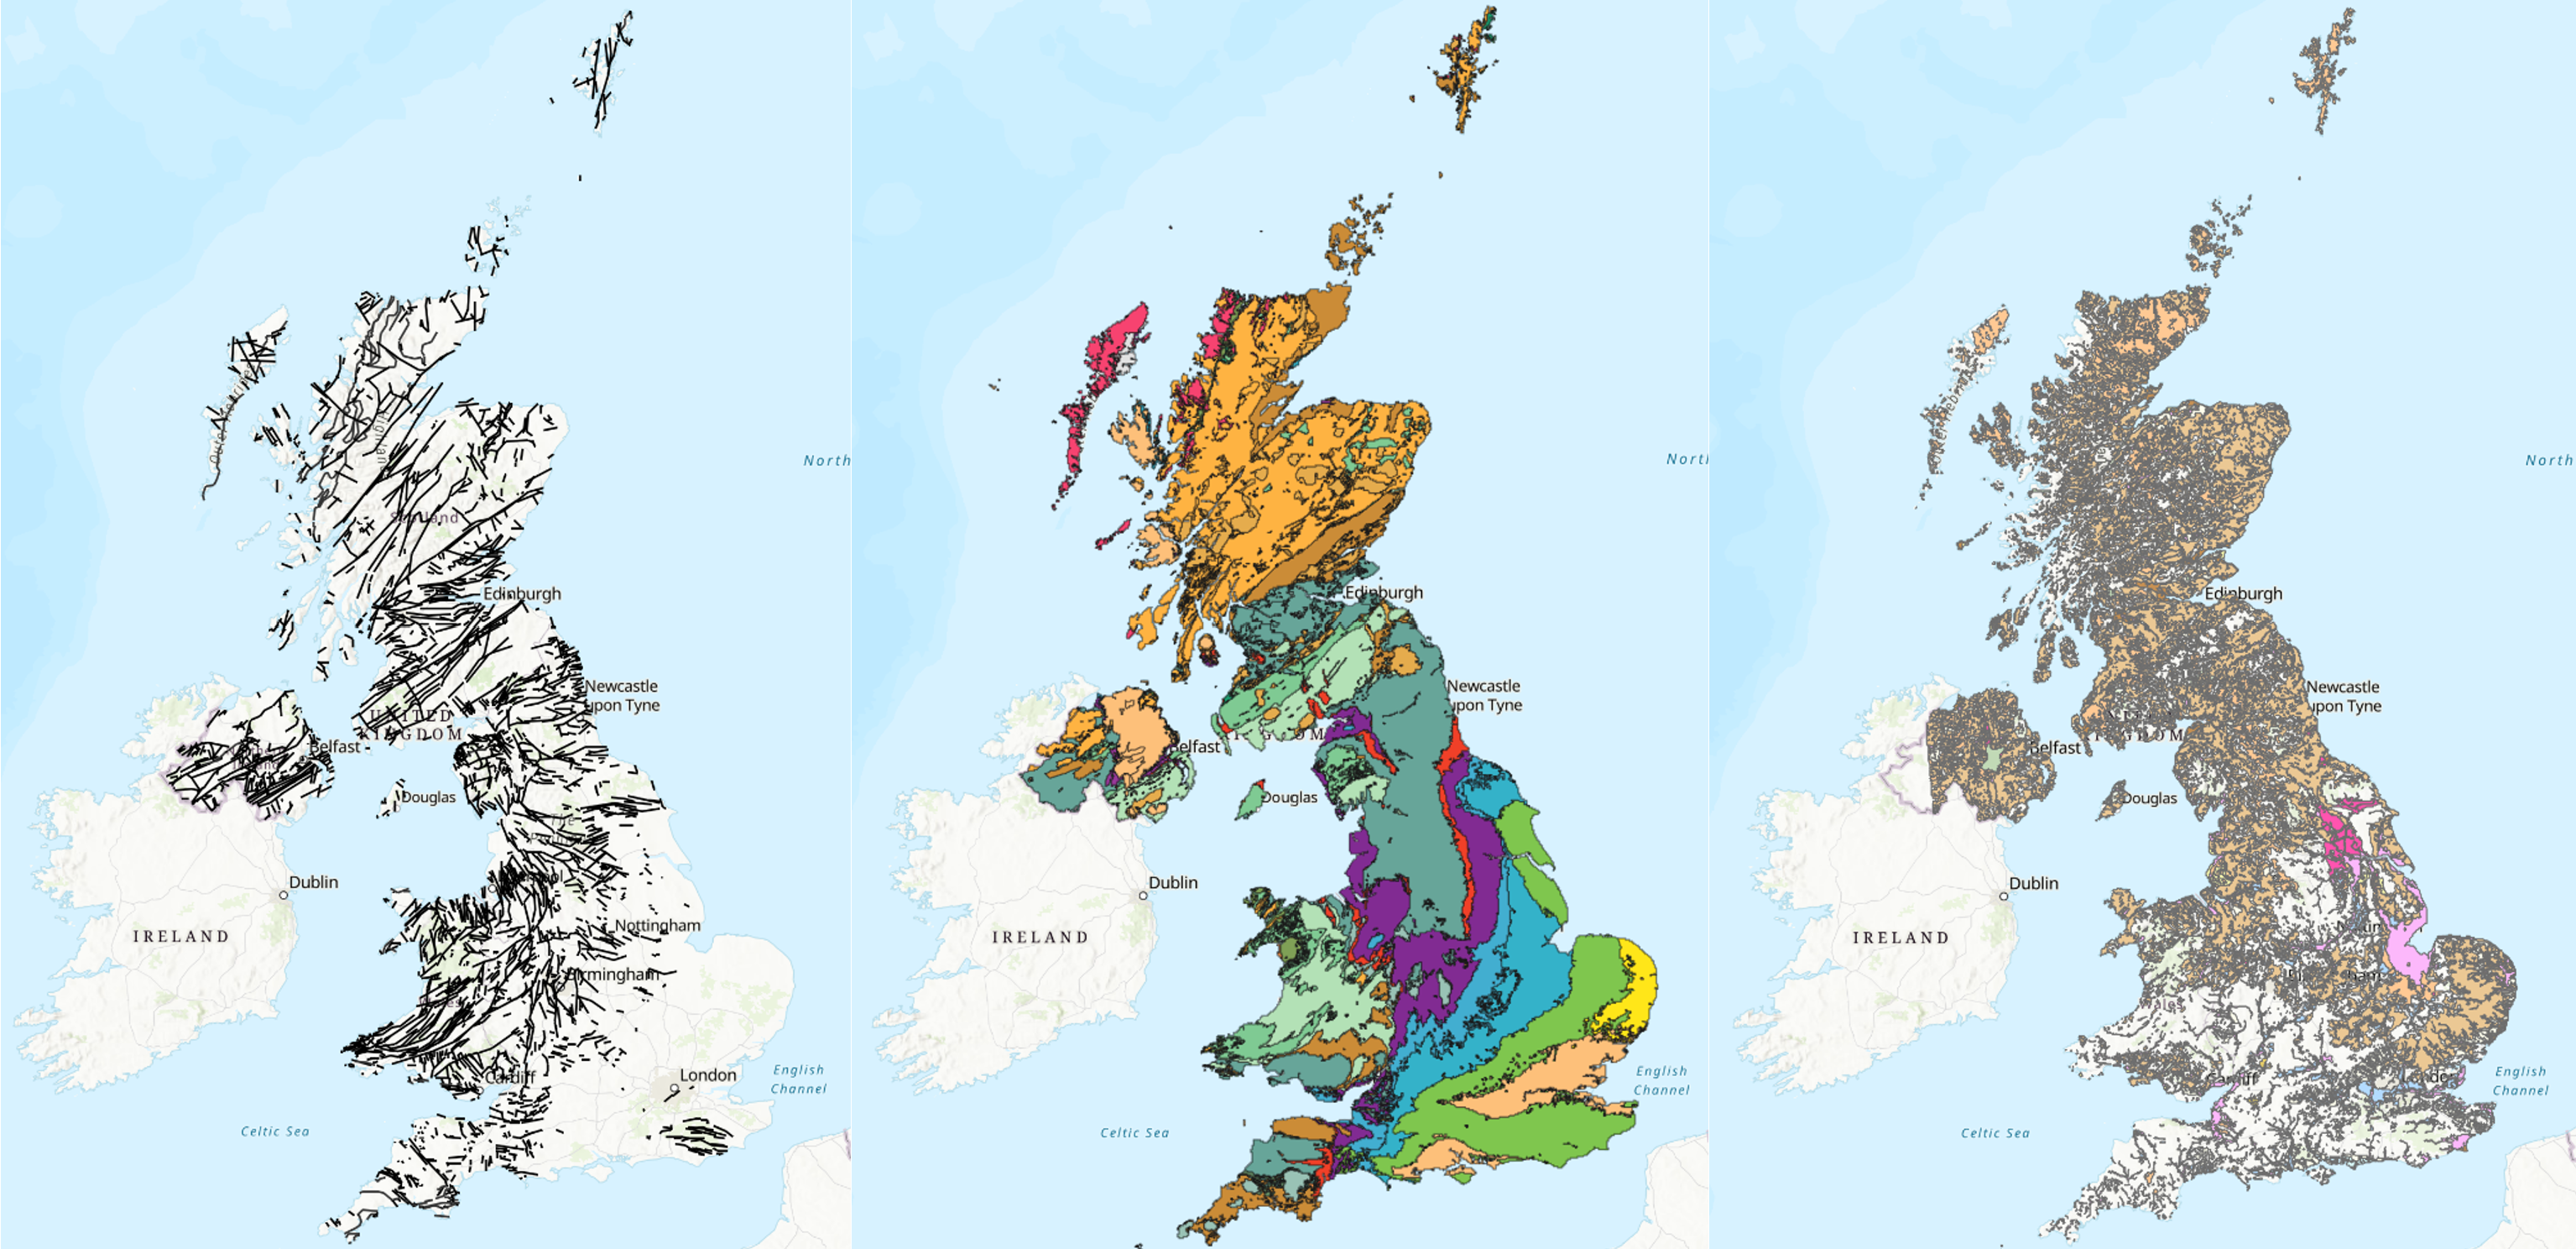
The BGS 625K dataset displayed in order: Faults, Bedrock Geology, Superficial Geology
This calls for an ArcGIS Dashboard
While I would normally recommend bringing this map into a dashboard to analyse the data further, BGS have actually already created an insightful dashboard, which is also available within the Living Atlas! This interactive dashboard allows you to explore the bedrock geology of the UK, with multiple pie charts displaying what the rocks are made of, when they were formed, by what processes and in what type of environment. By selecting different slices of these pie charts, you can filter down the bedrock to interrogate the data. As an example, within the video below, I have used the pie charts to filter down my map to view only sedimentary carboniferous bedrock.
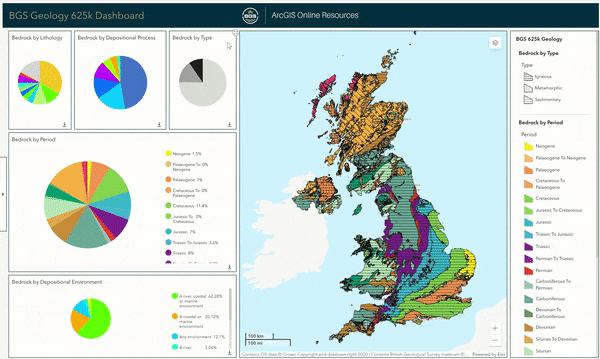
Using the dashboard pie charts to filter down the data.
Using the data
Student use
Within the dataset description, BGS have highlighted how useful this dataset is for students studying Earth Sciences and I couldn’t agree more. With an understanding of the earth geology, we can start to see why certain processes or events happen where they do. As a student, to learn more about ArcGIS and find out whether you have access through your university, take a look through this webpage.
To help build upon your understanding of earth geology, we can introduce other Living Atlas data alongside this geology dataset, and begin to see relationships and patterns within the data.
Let’s look at an example of this in more detail…
Investigating UK Earthquakes
Last year, we welcomed another BGS dataset to the Living Atlas, UK Modern Earthquakes, which shows the location of all earthquakes recorded within the UK from 1956 up to the present day. This dataset allows earthquakes as small as magnitude 2.0 to be detected and contains useful information, such as Richter local magnitude and earthquake depth. By overlaying this dataset with the geological faults layer, we can begin to see a correlation between where faults are located and where earthquakes have occurred. Doing this also allows us to investigate the earthquakes that have occurred much further away from these mapped geological faults. A common suggestion for the reason behind these earthquakes are that they are due to unmapped faults located kilometres below the surface. BGS also believe some could be due to the melting of the ice sheets that covered many parts of Britain thousands of years ago.
To learn more about this modern earthquake dataset, and other datasets from BGS within the Living Atlas, take a look through this blog written by one of my colleagues.
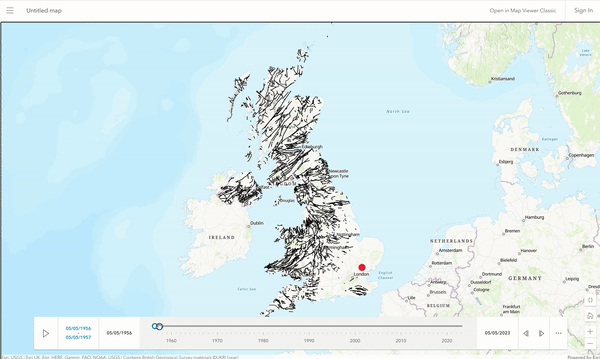
Partnering the BGS Geology dataset with the UK Modern Earthquakes helps find relationships within the data
More to explore
It’s not just earthquakes that this dataset could be used with, there is actually a huge range of datasets within the Living Atlas that would benefit from having the underlying geology mapped alongside it. For example, earlier in the year BGS added the GeoClimate UKCP18 Open dataset, showing potential future subsidence as a result of climate change. By using the spatial join geoprocessing tool in ArcGIS Pro, we can join this with the Superficial Geology layer and see that the South East of England being more prone to subsidence movement it is likely due to the prevalence of clay soil.
This data can be brought into any of our ArcGIS Online applications, such as ArcGIS Field Maps, to aid with site investigation, or ArcGIS Storymaps, to provide geological context when telling your own stories.
Want to contribute your own data?
If you have a dataset of your own that you would like to nominate to the ArcGIS Living Atlas, you can do so from within the ArcGIS Living Atlas Website or alternatively you can contact us directly on datacurator@esriuk.com.