Climate change is affecting the risk of subsidence in Britain. The impact on ‘shrink-swell’ is described in this British Geological Survey article, but can be summarised as higher temperatures and drier conditions leading to increased soil shrinkage – or subsidence. With predictions indicating that our climate will change to match these conditions in the near future, the BGS has been able to predict the likely subsidence hazard across Great Britain.
Our latest ArcGIS Living Atlas of the World addition comes courtesy of the British Geological Survey (BGS) who, having first contributed three datasets last year, have now added their GeoClimate UKCP18 Open dataset to Living Atlas. This is one of their GeoClimate: shrink-swell national datasets showing potential future subsidence as a result of climate change. By adding this dataset, the breadth of British geological and geotechnical data available to ArcGIS users is bigger than ever.
Shall we dig into this newest offering and see what we find?
Letting it sink in
The GeoClimate UKCP18 Open data shows the potential subsidence hazard across the UK for two time periods, 2030s (2025-2035) and 2070s (2065-2075), each in its own layer. The UK is divided into 2 km grid squares with the median average for each time period used as the output. Through a combination of long-term UK Climate Projection (UKCP) estimations for rainfall and temperature and geotechnical ground properties, each grid has been assigned a category in the CLASS field. This outlines whether it is ‘improbable’, ‘possible’, or ‘probable’ that climate change will affect the likelihood of subsidence. Luckily, the pop-ups have been pre-configured using a handy Arcade expression to summarise this data at any location in an easy-to-digest format.
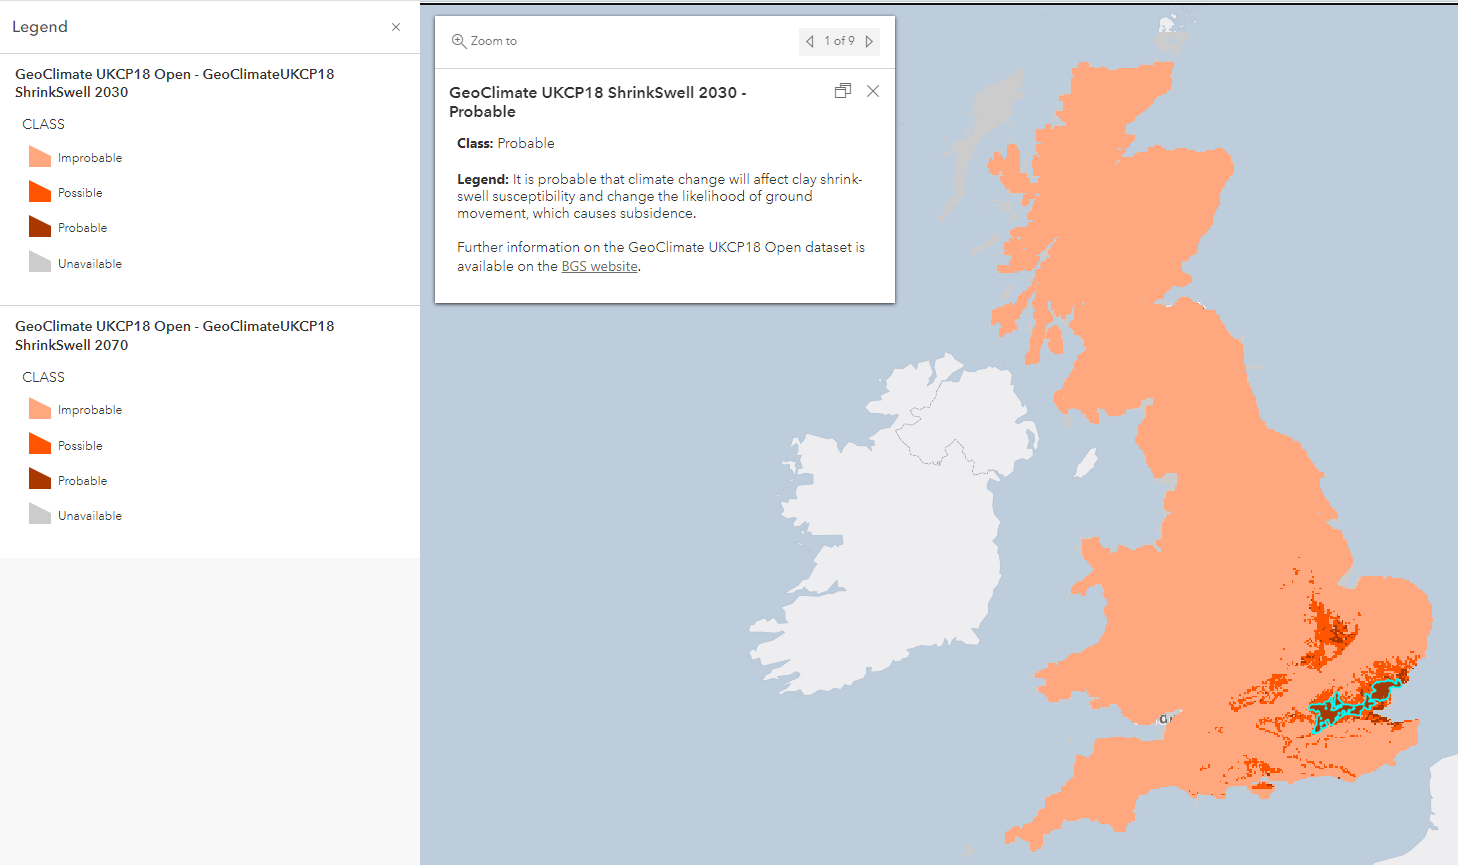
Exploring the symbology and pop-ups of the GeoClimate UKCP18 Open data
Digging down deeper
By having the data configured this way, you can filter the CLASS field to focus your attention on specific levels of predicted hazard, as shown below. This reveals the basemap to help provide more geographic context – something also achieved by playing with the transparency. By taking the data into ArcGIS Pro, I’ve been able to identify how the data changes between the 2030s and 2070s. Over several steps, I can separate the data and alter the symbology to highlight where the potential risk has increased and by how much it has increased, with darker shades of red showing levels of change compared to the 2030s subsidence hazard.
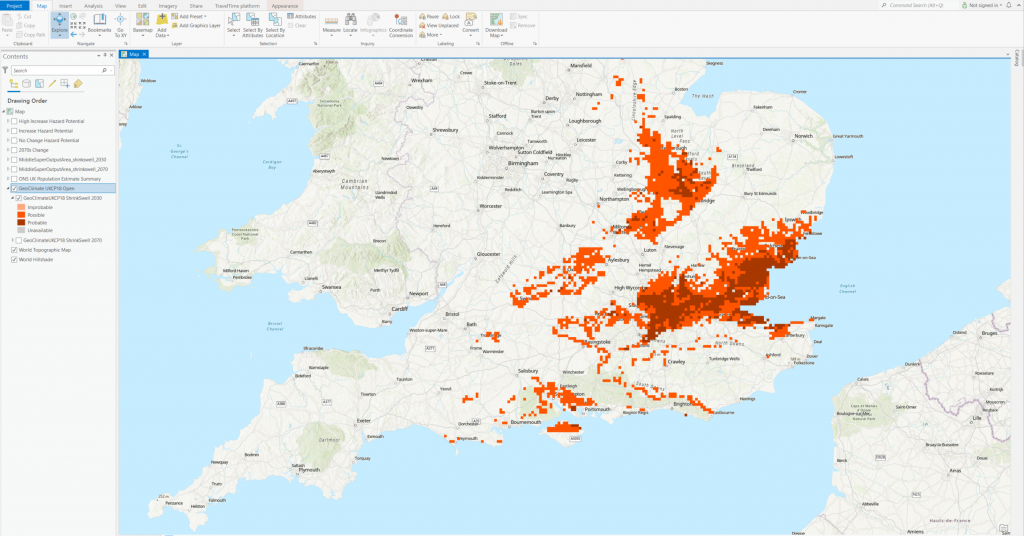
Filtering the data allows the geographical context to be added to subsidence hazards
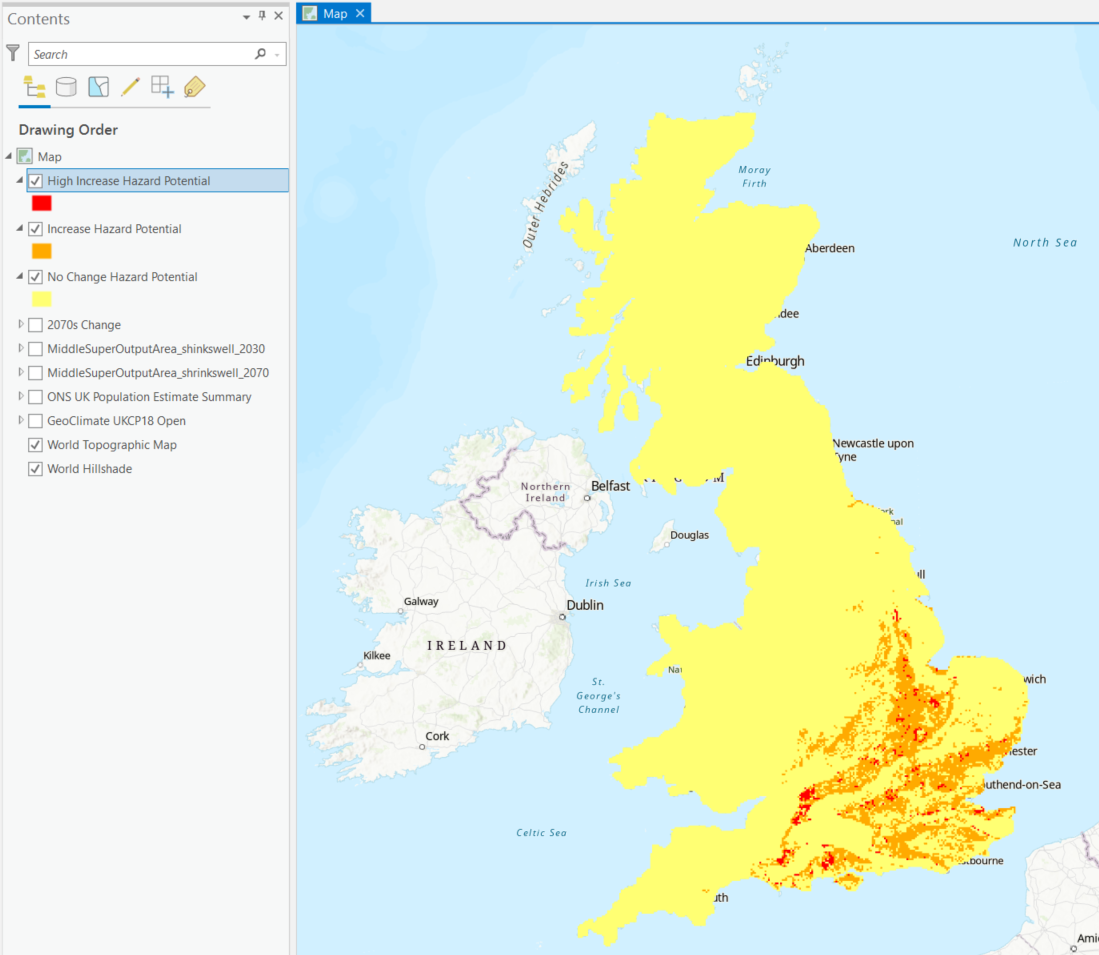
Performing some geoprocessing in ArcGIS Pro allows you to explore the change in subsidence hazard
Combining BGS datasets
There is real value in using the GeoClimate UKCP18 Open dataset in tandem with some of the other data Living Atlas has to offer. This is especially true of one dataset, also by the BGS, which was added last year. The GB Single Onshore Borehole Index contains over one million records of boreholes, shafts, and wells that have been gathered during drilling and site investigation work carried out by the BGS. Most boreholes contain a link to a scan of the borehole record held by the BGS, which contains more detailed location and lithological descriptions using the geologist’s/surveyor’s observations. Using this dataset alongside the shrink-swell data will provide added context to a location being investigated and shed some light on the reasons behind the predicted subsidence hazard – after all, the underlying lithology is one of the most influential factors on subsidence potential.
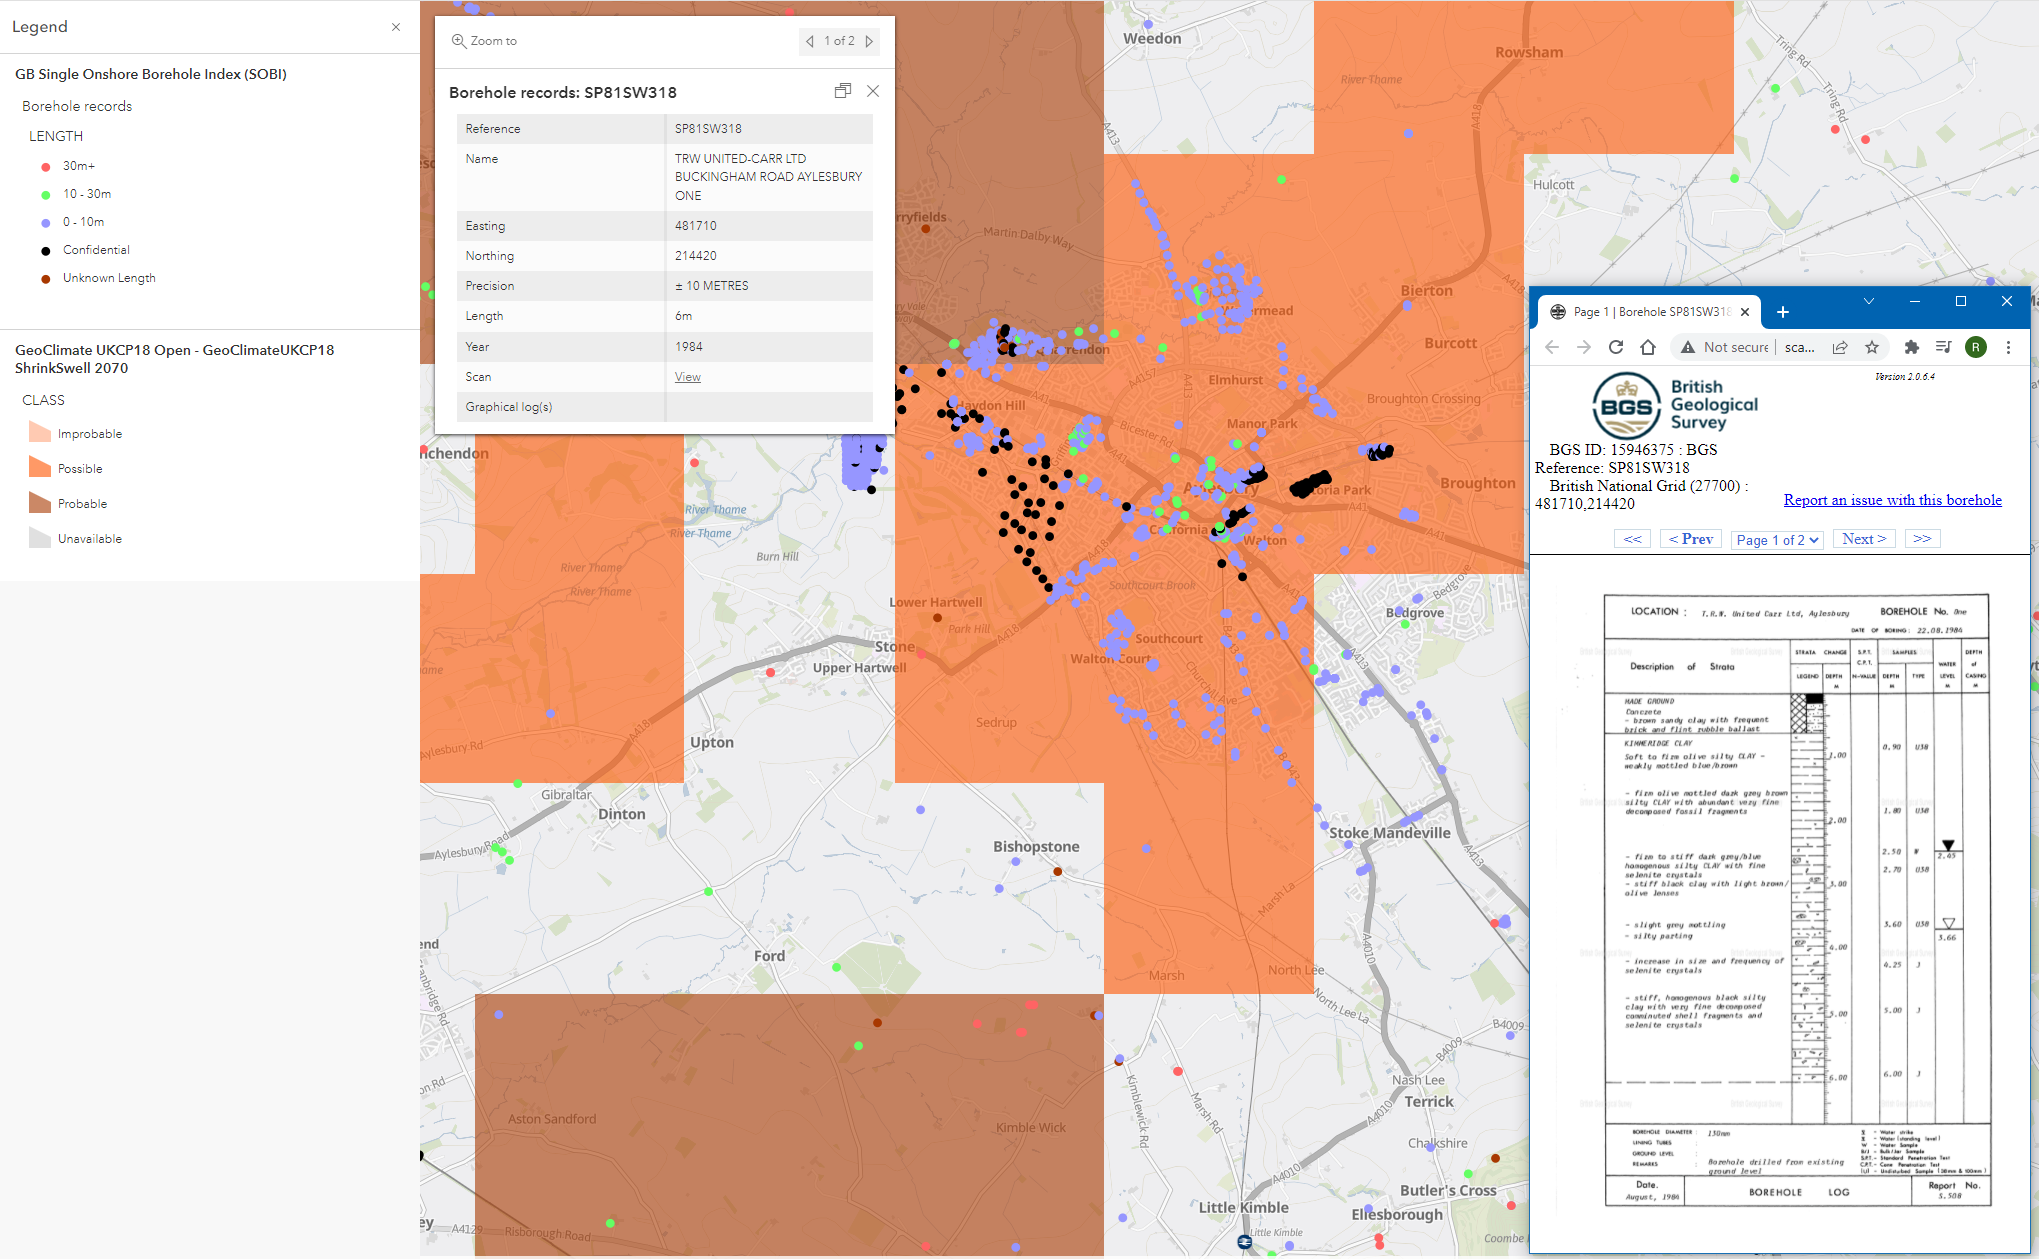
Partnering the GeoClimate UKCP18 Open data with other BGS offerings provides greater insight
Assessing the risk
Any standalone hazard is not really a problem until it starts to affect and impact on human lives. This is what turns a hazard into a risk. Assessing the risk posed by potential future subsidence will be of utmost importance to those concerned with construction and property management, as well as infrastructure and utility networks. Local governments will also be monitoring these circumstances. Knowing the volume of people likely to be affected is crucial. By using the spatial join tool in ArcGIS Pro, we can take the ONS UK Population Estimate Summary dataset and attribute the subsidence hazard to each Middle Super Output Area. We can now break the country down into these MSOAs, symbolised by subsidence hazard potential, and find out the estimated population at risk. By combining two of our latest additions to Living Atlas, we’ve enhanced the hazard data to provide extra insight and expand on the use of this data.
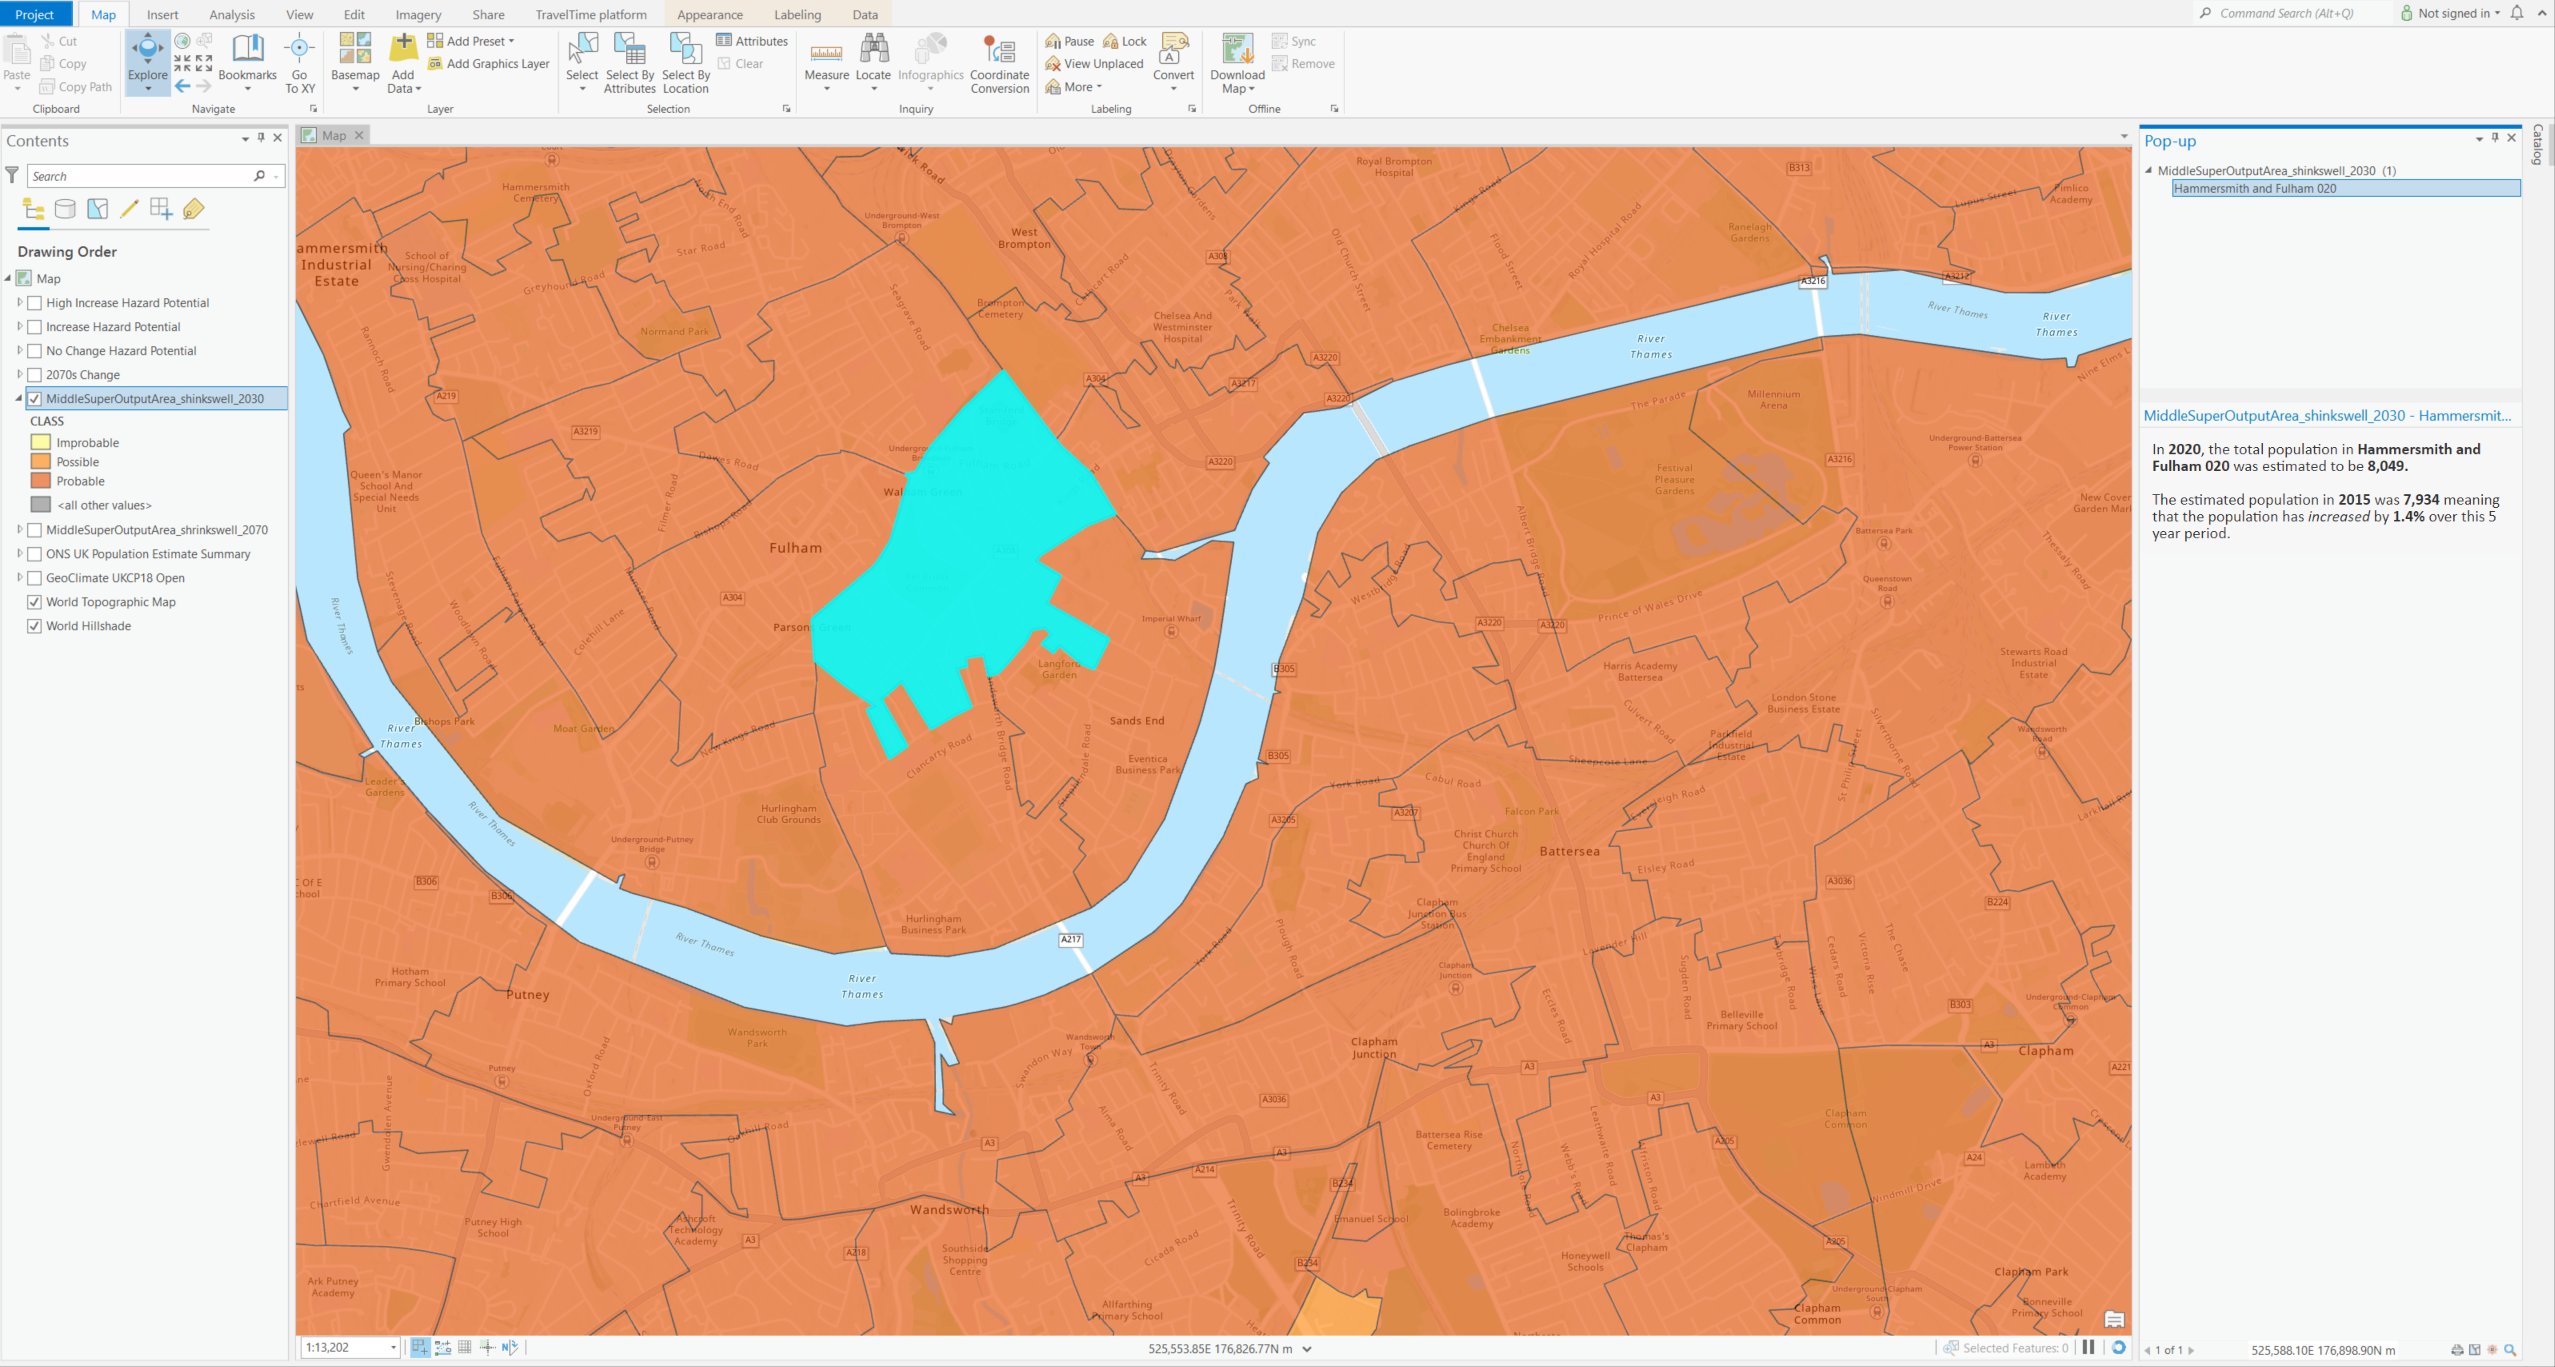
Using other Living Atlas data, risk can be assessed by identifying the likely affected population
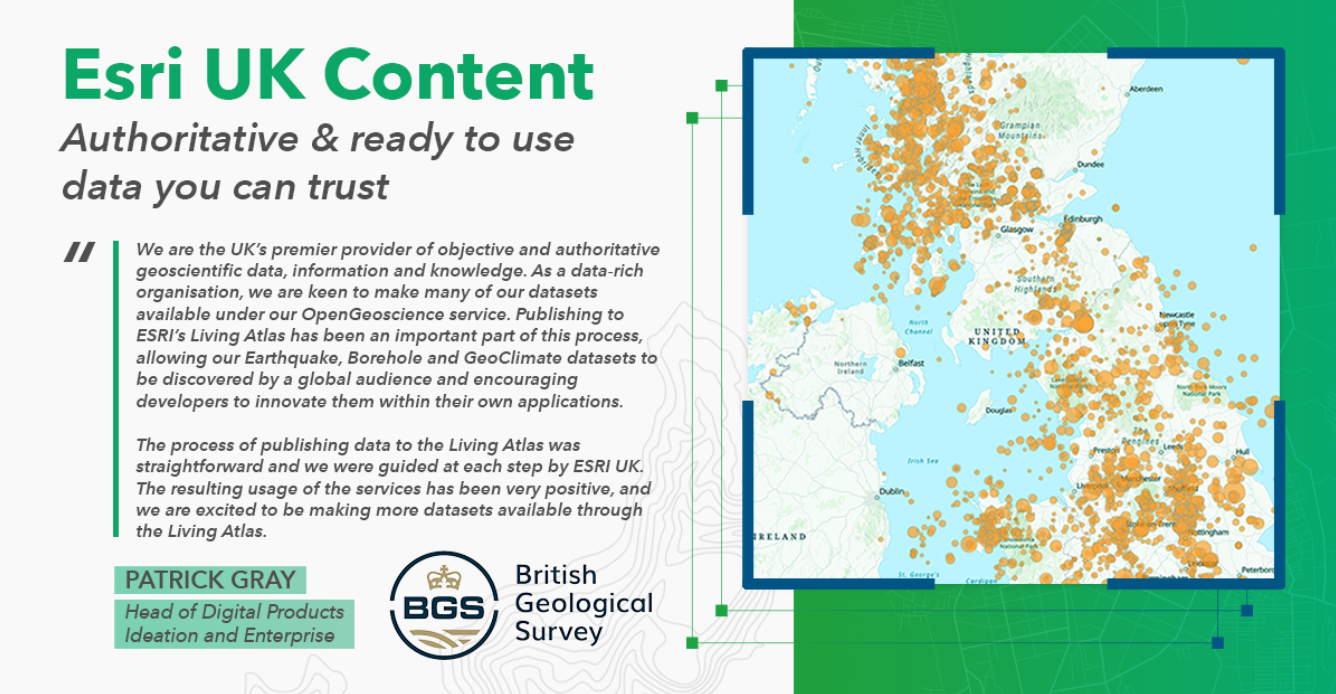
We’re really excited to welcome another new dataset from the British Geological Survey to ArcGIS Living Atlas, and I hope I’ve been able to show how you could make the most of this data. Here is what Patrick Gray, Head of Digital Products, Ideation, and Enterprise at the BGS, had to say about contributing BGS data to Living Atlas:
If you have a dataset of your own that you would be interested in nominating to ArcGIS Living Atlas for use by the GIS community, you can do so from within the ArcGIS Living Atlas Website or alternatively, you can contact us directly at datacurator@esriuk.com
The next discovery…
Why not visit ArcGIS Living Atlas of the World to explore the thousands of authoritative content at your fingertips?
To keep up to date with other ArcGIS Living Atlas news, check out Esri’s blog and follow our dedicated Twitter account. Join Esri Community to connect with other ArcGIS Living Atlas users and share ideas, solutions and collaborate to solve problems with GIS.