It’s been a jam-packed last few months for the UK Living Atlas. For this summer update, we have welcomed 134 new datasets and four new contributors including: the British Antarctic Survey, Welsh Government, Marine Scotland (part of the Scottish Government) and Crown Estate Scotland. We also have some useful Living Atlas resources to share with you, including a shiny new Dashboard to help keep you in the know of what’s in Living Atlas and who has contributed.
Here are your Q2 Living Atlas hot off the press.
Infrastructure
New global 3D buildings and trees data from OpenStreetMap
Three new OpenStreetMap (OSM) 3D scene layers are now available in Living Atlas. These layers can be used in Scene Viewer, ArcGIS Pro, and other ArcGIS apps that support 3D visualisation. These new layers feature global buildings and trees which are built using the OSM Daylight map distribution.

OpenStreetMap 3D Buildings and Trees of central London.
We have:
- OpenStreetMap 3D Buildings – 3D buildings scene layer where the buildings are rendered using information found in the OSM tags for each feature, including heights and levels.
- OpenStreetMap 3D Trees (Thematic) – 3D trees scene layer rendered using a thematic representation of the trees. The closest matching tree type is determined from the OSM tree type tags.
- OpenStreetMap 3D Trees (Realistic) – 3D trees scene layer rendered using more detailed tree symbols representing specific species. The closest matching tree type is determined from the OSM tree type tags.
For more information, see the OpenStreetMap 3D Scene Layers documentation and New OSM 3D scene layers in terms of how you can help enhance this data.
Explore the National Heritage list from Historic England
The National Heritage List for England (NHLE) is the official, up to date, register of all nationally protected historical buildings and sites in England. We are pleased to announce that Historic England have made this data available in Living Atlas. This register, which is updated daily, includes information on: listed buildings, scheduled monuments, protected wrecks, registered parks and gardens, and battlefields. Knowing the location of these areas is important for their future preservation.
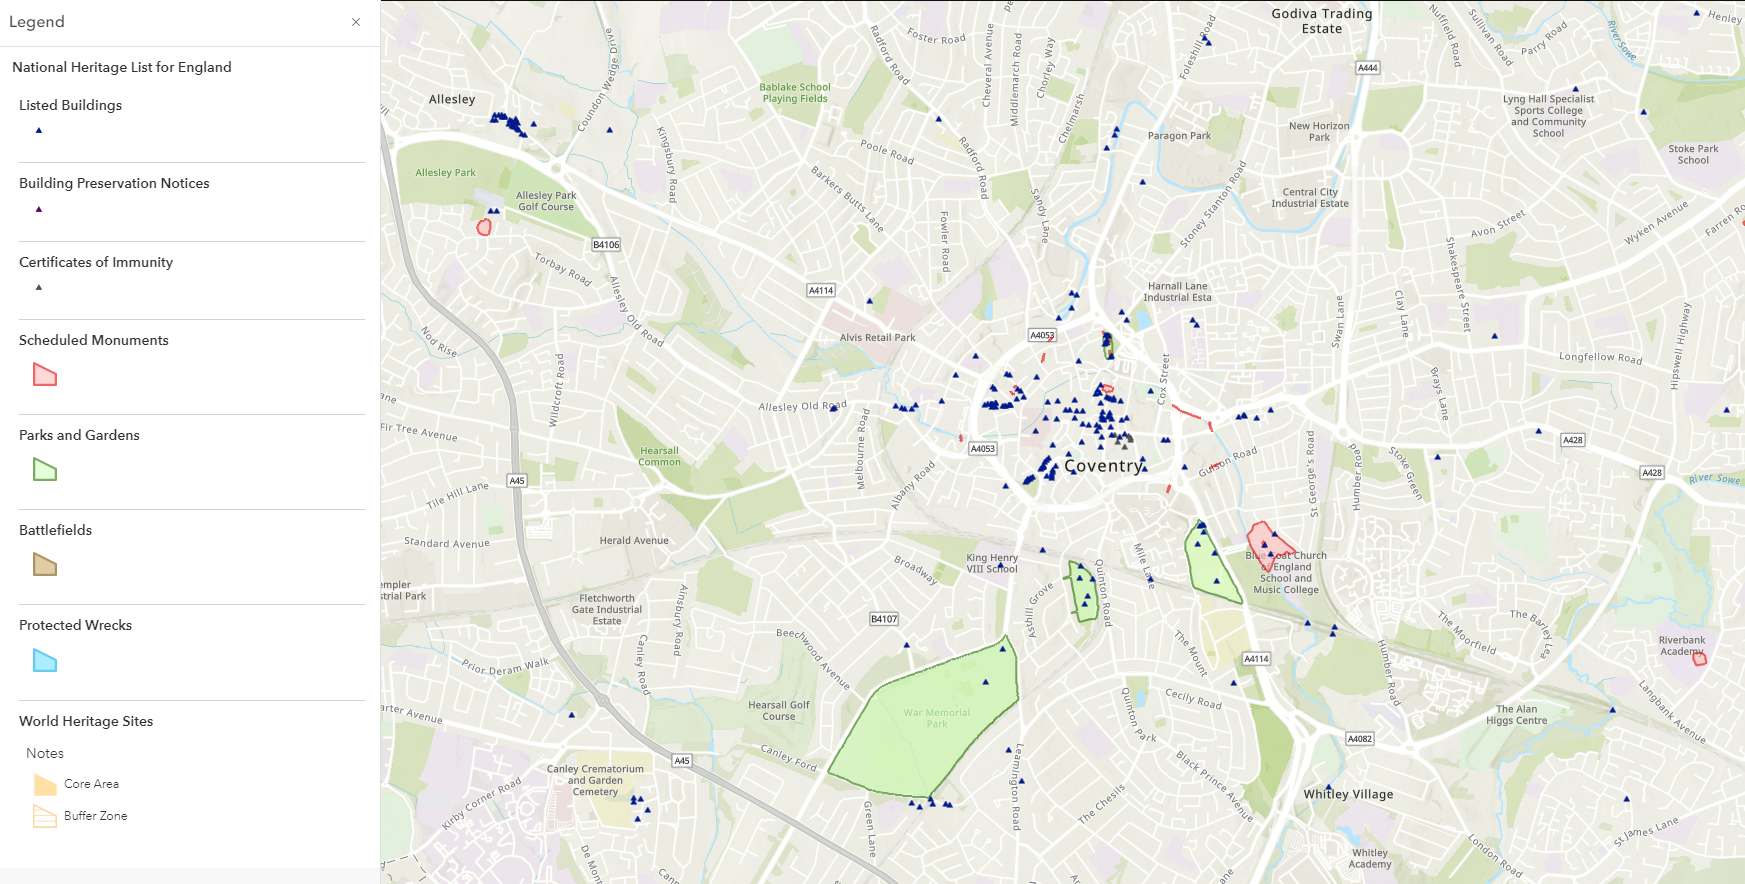
National Heritage List around Coventry from Historic England.
Environment
Environment Agency’s tree map of England
One of my favourite additions for this quarter is the LIDAR-derived Vegetation Object Model (VOM) from the Environment Agency. VOM is a raster product which identifies classified vegetation objects above 2.5 metres. Essentially, it’s a tree map of England and it was created to identify riparian tree cover and opportunities for tree planting to increase future shading of streams & rivers. Though I can see how this data can also be applied in other applications such as insurance risk assessments, utility asset management and even flood and pollution modelling.
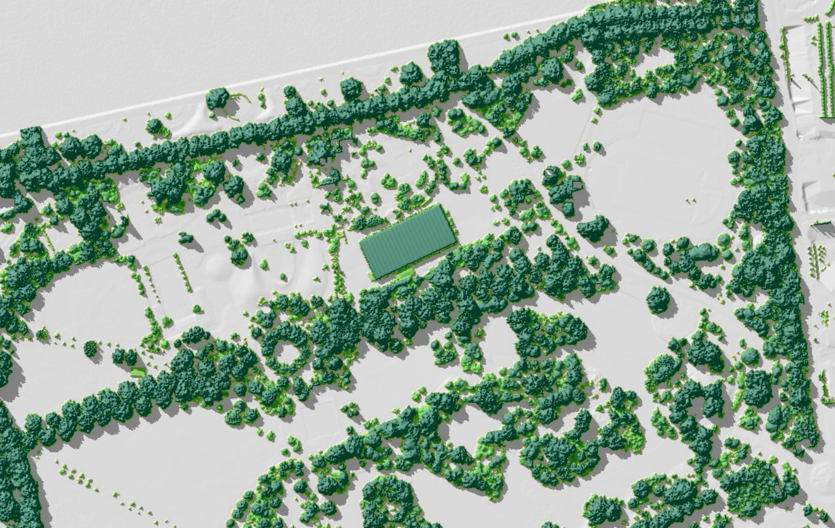
Using the Environment Agency’s Vegetation Object Model to identify tree cover.
This is a first release of the data and coverage is only available for all the National LIDAR Programme data. However, the service will be updated later this year to complete the coverage for England. When using this image service, the Vegetation Object Model should be overlaid with a 50% transparency on the Vegetation Object Model Hillshade.
Learn about Antarctica’s topography with these additions from the British Antarctic Survey
The British Antarctic Survey also joins the Living Atlas family after sharing datasets from the SCAR (Scientific Committee on Antarctic Research) ADD (Antarctic Digital Database). These layers are of Antarctic contours and coastlines, including grounding lines and ice shelf fronts, at varying resolutions to help you gain a better understanding of the topography of Antarctica. Having these datasets be readily available in Living Atlas ensures that reliable and up-to-date information is available to the scientific communities. They have also written a blog highlighting their contributions which you can read here.
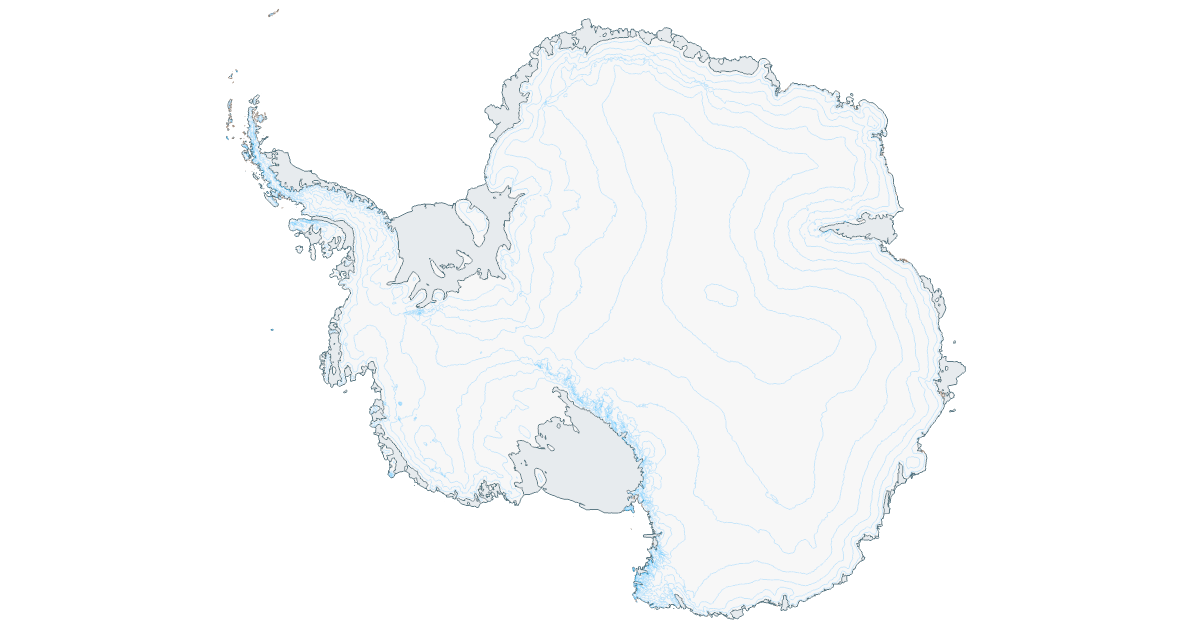
Explore Antarctica’s topography with these vectors and contours data from the British Antarctic Survey.
Investigating storm overflows in 2021 with The Rivers Trust
The River’s Trust have shared more of their Storm Overflows data to Living Atlas. This particular dataset shows how often and for how long monitored storm overflows discharged in 2021 for 10 water companies operating in England and Wales. This dataset is part of a series looking at storm overflows from 2018-2021 in England and Wales which you can explore here.
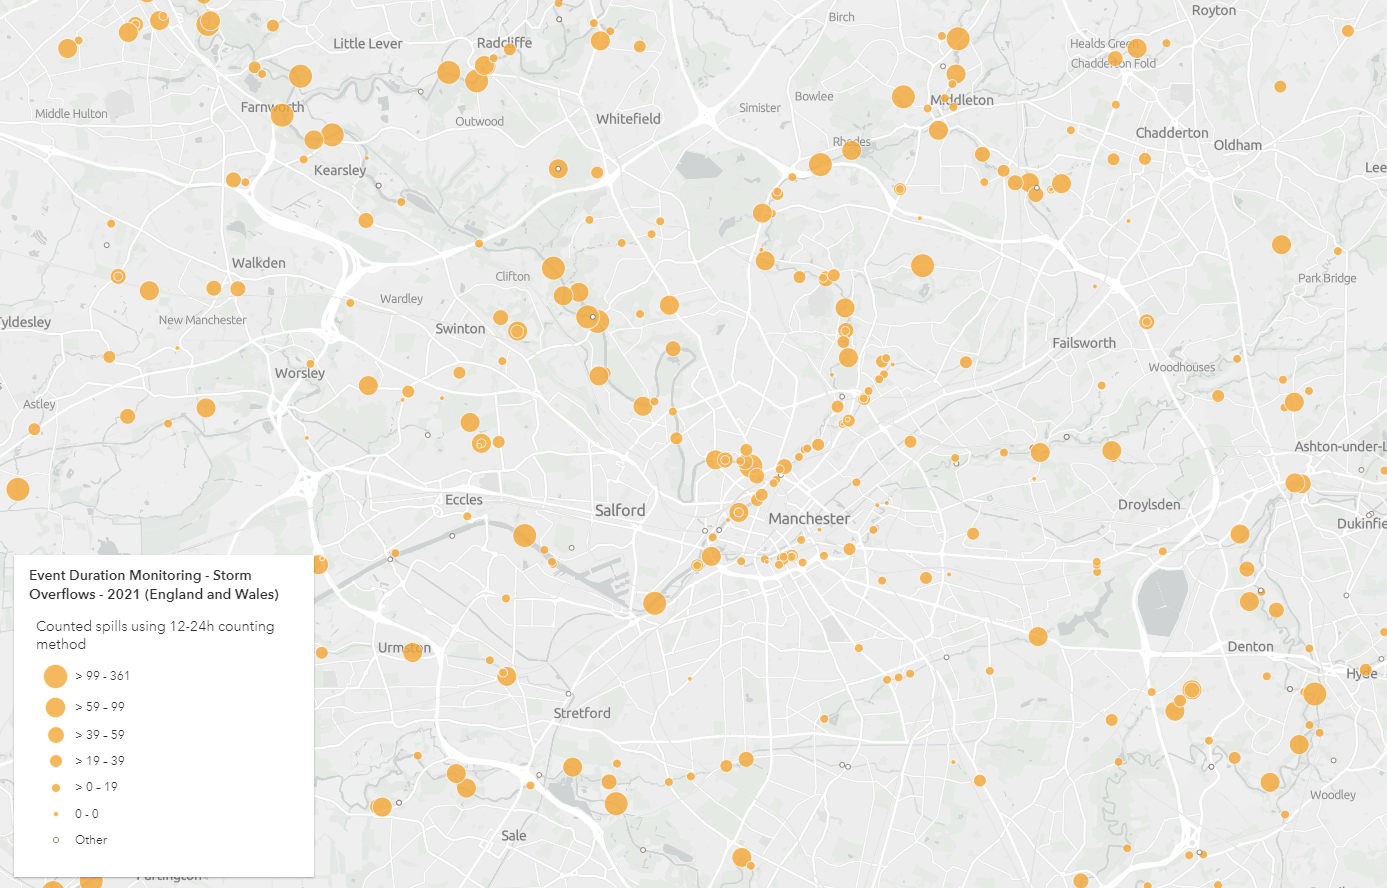
Storm Overflows for 2021 around Manchester from The Rivers Trust.
Understand how our moorlands our changing with Natural England
Natural England have contributed their Sentinel-2 derived Moorland Change Maps from 2015-2021. These datasets show whether the heather dominant uplands experienced a recent cut or burn in vegetation during the period of monitoring. Moorlands are important carbon stores, and this data plays a crucial role in improving our understanding of the changes these landscapes face and how we can better protect them.
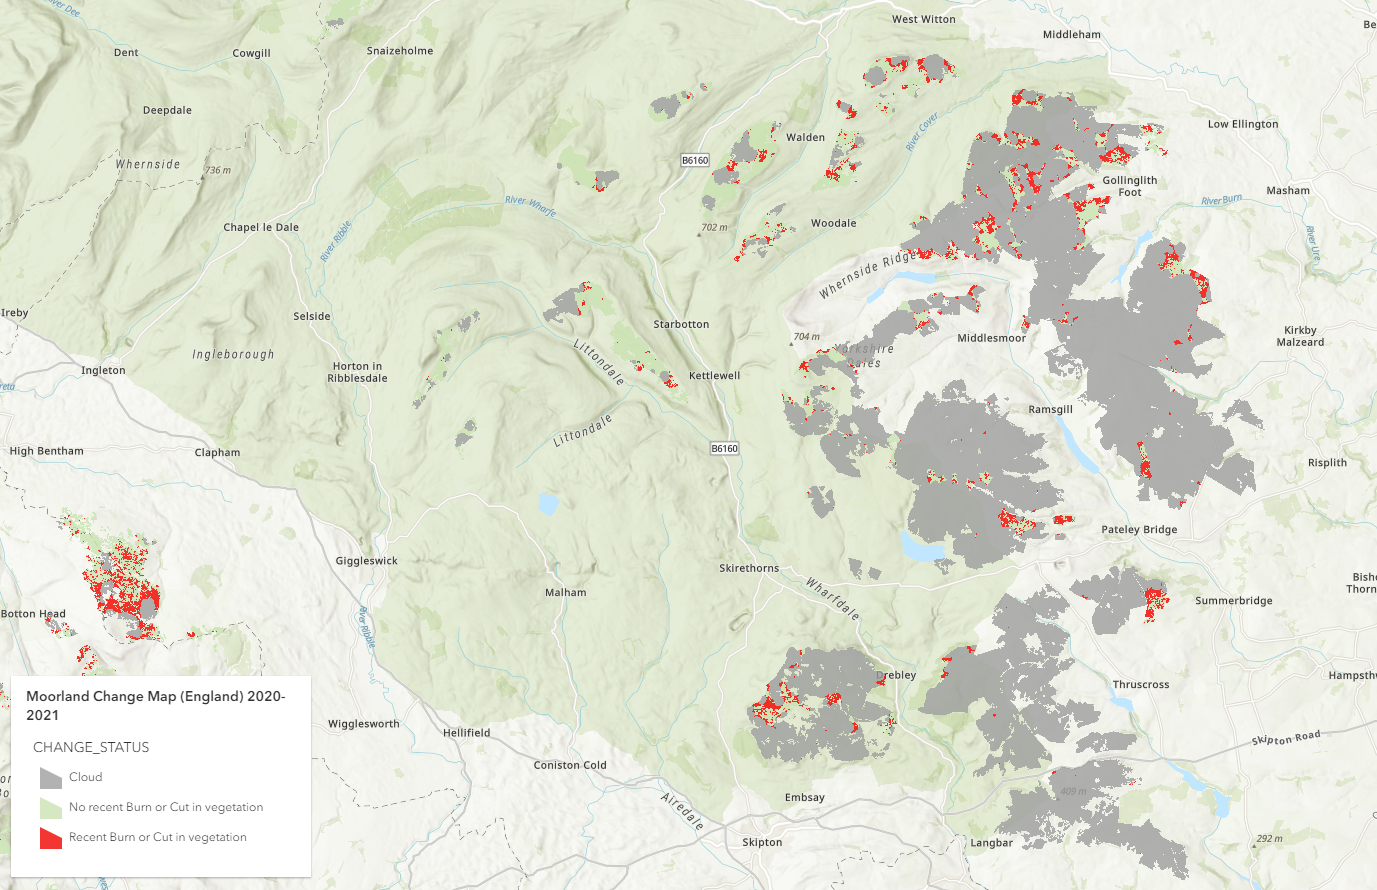
Using Natural England’s Moorland Change Map (2020-2021) to look at change in the Yorkshire Dales.
People
Public Health England’s COVID-19 Vaccination data
Esri UK published a COVID-19 vaccination service sourced from the UK Health Security Agency (UKHSA), previously known as Public Health England. The data is updated daily using UKHSA’s API service. It provides information about the latest cumulative vaccination figures at four geography levels: upper tier local authority, lower tier local authority, regions and nations. Use this to learn more about vaccination uptake in your local area or combine this service with the COVID-19 cases data in Living Atlas to get a fuller picture. Read this blog to find out more.
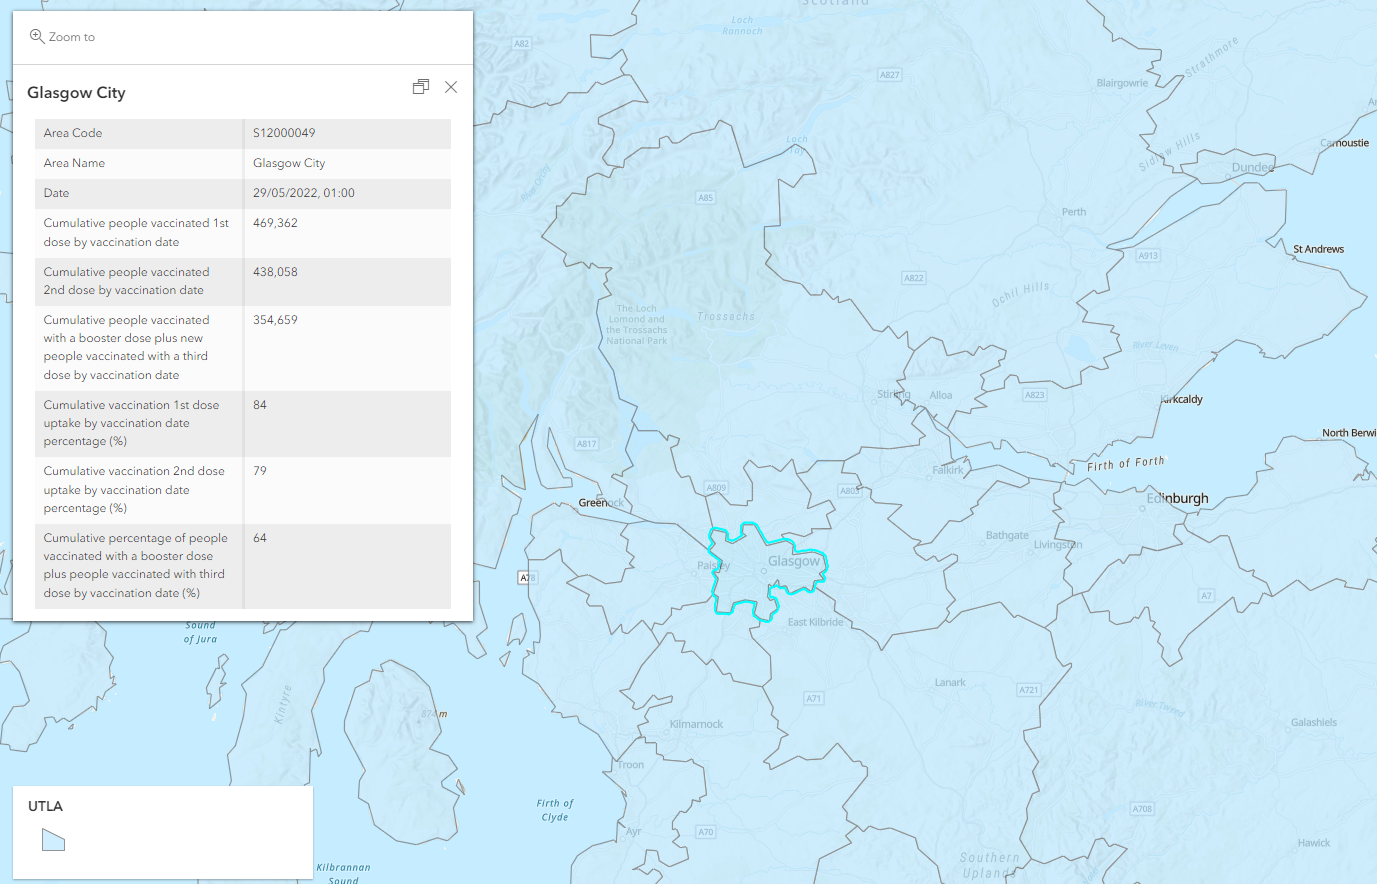
Vaccination data in Glasgow, Scotland using UKHSA’s API service.
Explore the Indices of Multiple Deprivation in Wales
The Welsh Government are a new contributor to the platform after sharing 19 datasets. These include the Welsh Index of Multiple Deprivation (WIMD) for the years 2014 to 2019. WIMD is the Welsh Government’s official measure of relative deprivation in Wales. This data is broken down into different domains including: Education, Housing, Community Safety, Health and more, allowing users to explore the concentration of different types of deprivation in their area.
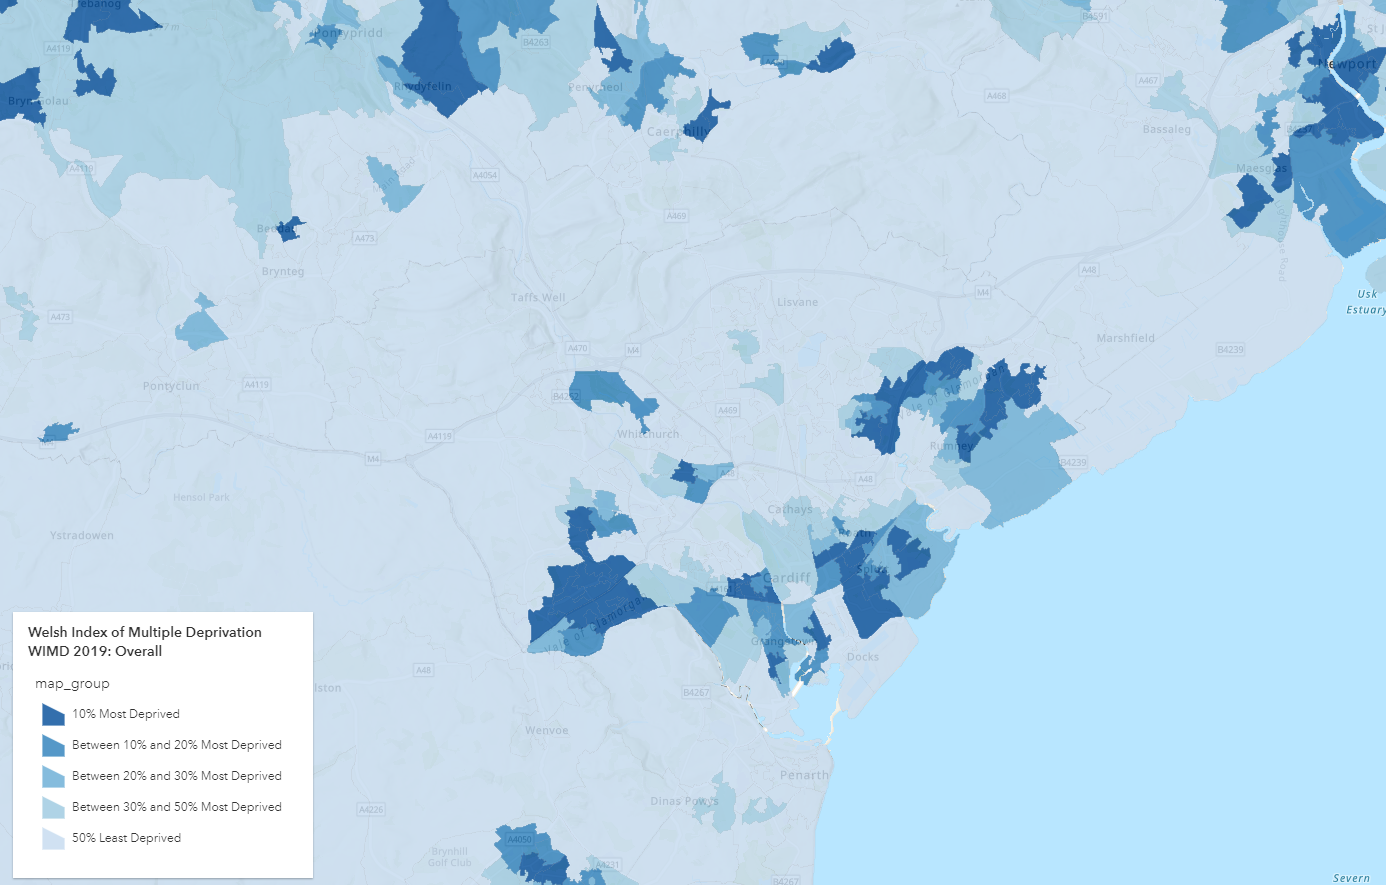
Overall WIMD for 2019 in Cardiff using Welsh Government data.
Following this addition, we now have a complete picture of Indices for Multiple Deprivation for Great Britain in Living Atlas – see here to access the data for Scotland and England.
Boundaries
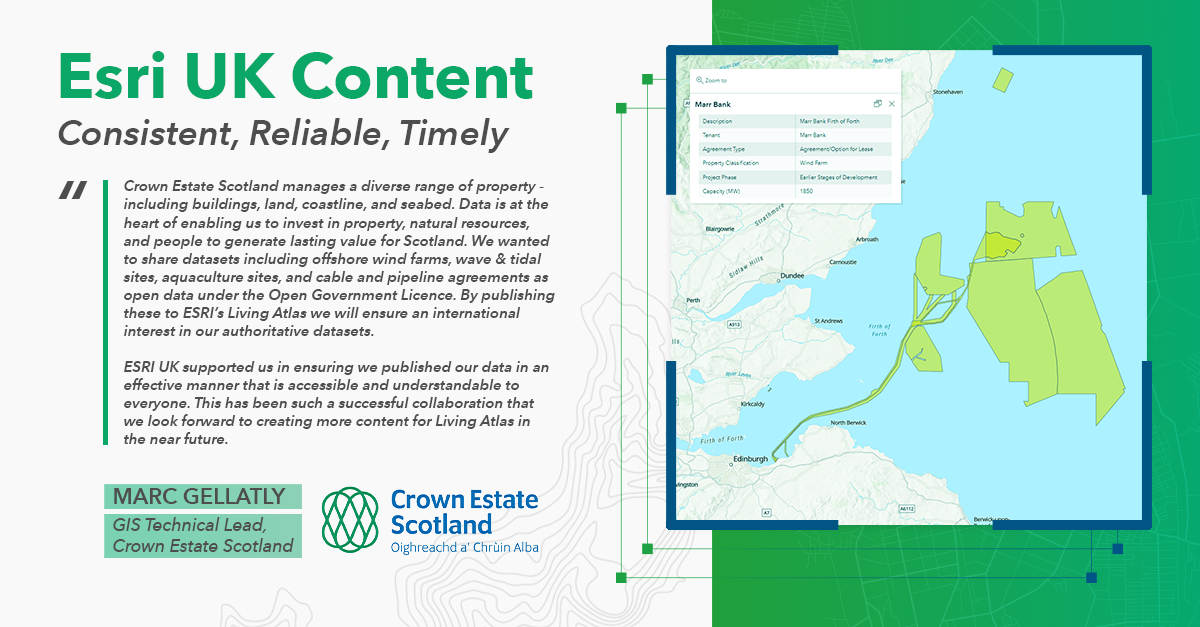
Investigate site agreements in the Scottish waters with Crown Estate Scotland
We are pleased to increase the Scottish data available in Living Atlas. Check out these latest additions from Crown Estate Scotland, also a new contributor. They have contributed eight items which relate to different site agreements and designated areas in Scotland such as offshore wind farms, aquaculture and more. These datasets represent all the current assets in Scottish waters and are a true reflection of what has been signed in the Lease documents and legal agreements. Use this to identify the location of Scotland’s important national assets.
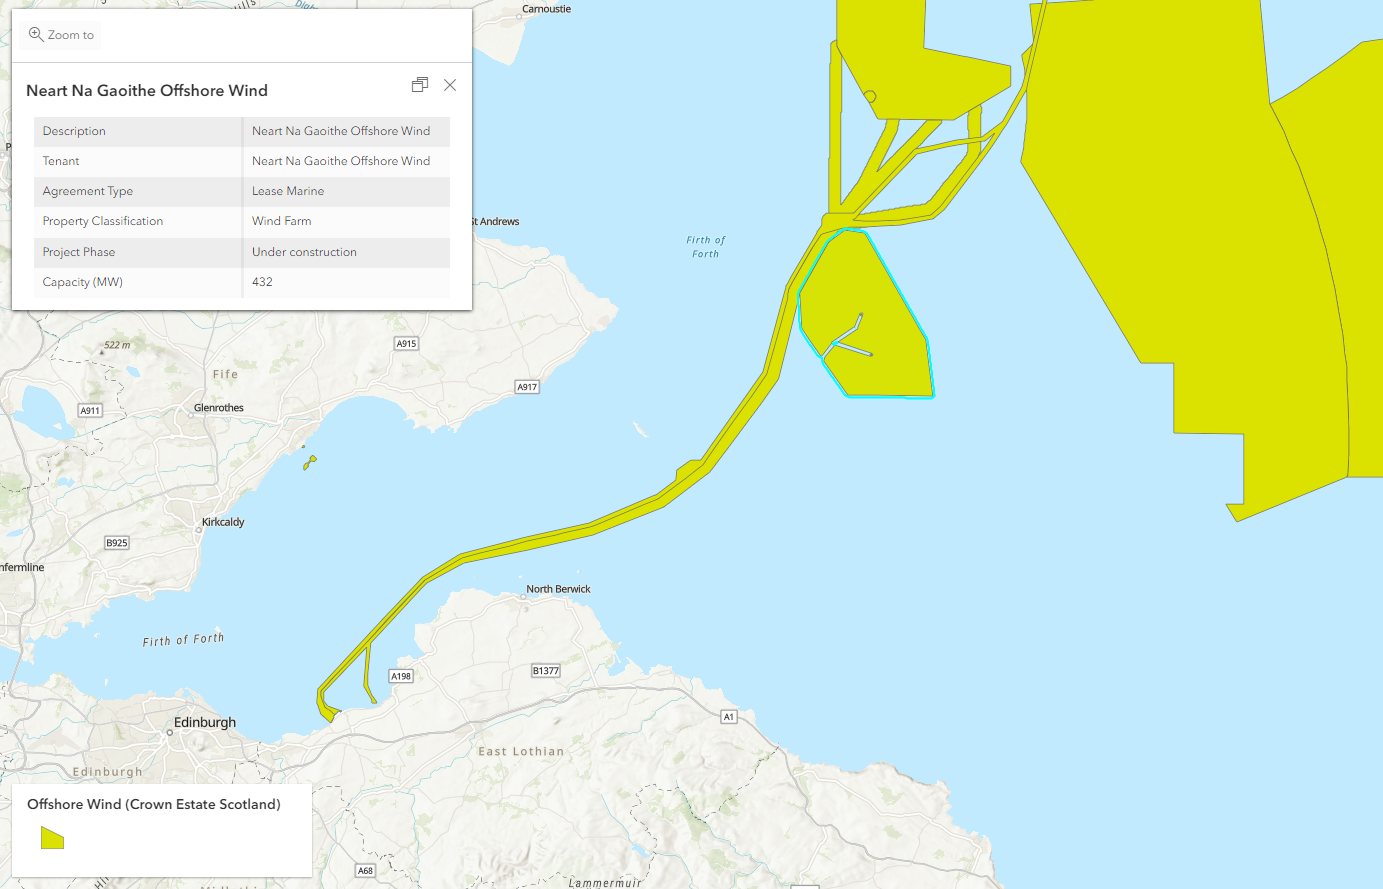
Offshore wind assets in Scottish waters from Crown Estate Scotland.
Improve your marine planning with Marine Scotland’s Scottish Marine Regions
To add to the collection of data from the Scottish Government, Marine Scotland have contributed Scottish Marine Regions which depicts the statutory inshore Scottish Marine Regions (SMRs) and the non-statutory Offshore Marine Regions (OMRs). The marine regions were developed to define boundaries based on their physical characteristics and can be used for marine planning.
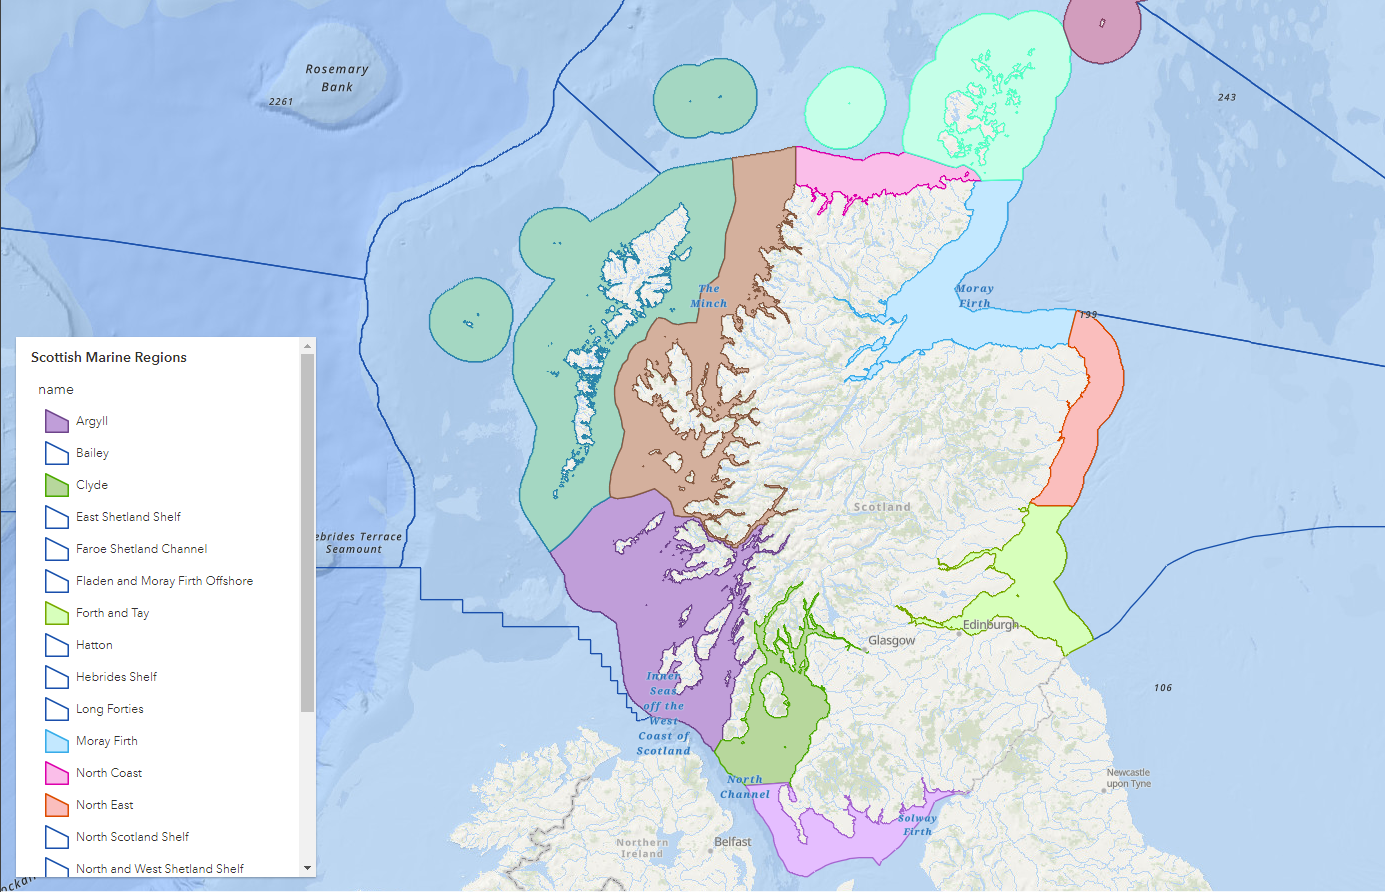
Scottish Marine Regions provided by Marine Scotland.
Historic England’s Conservation Areas
Conservation Areas are designated by Local Planning Authorities and are created to protect special architectural and historical aspects of a place. Historic England have now shared this information as a feature layer in Living Atlas to help users access the most up to date version of this data. Check it out here.
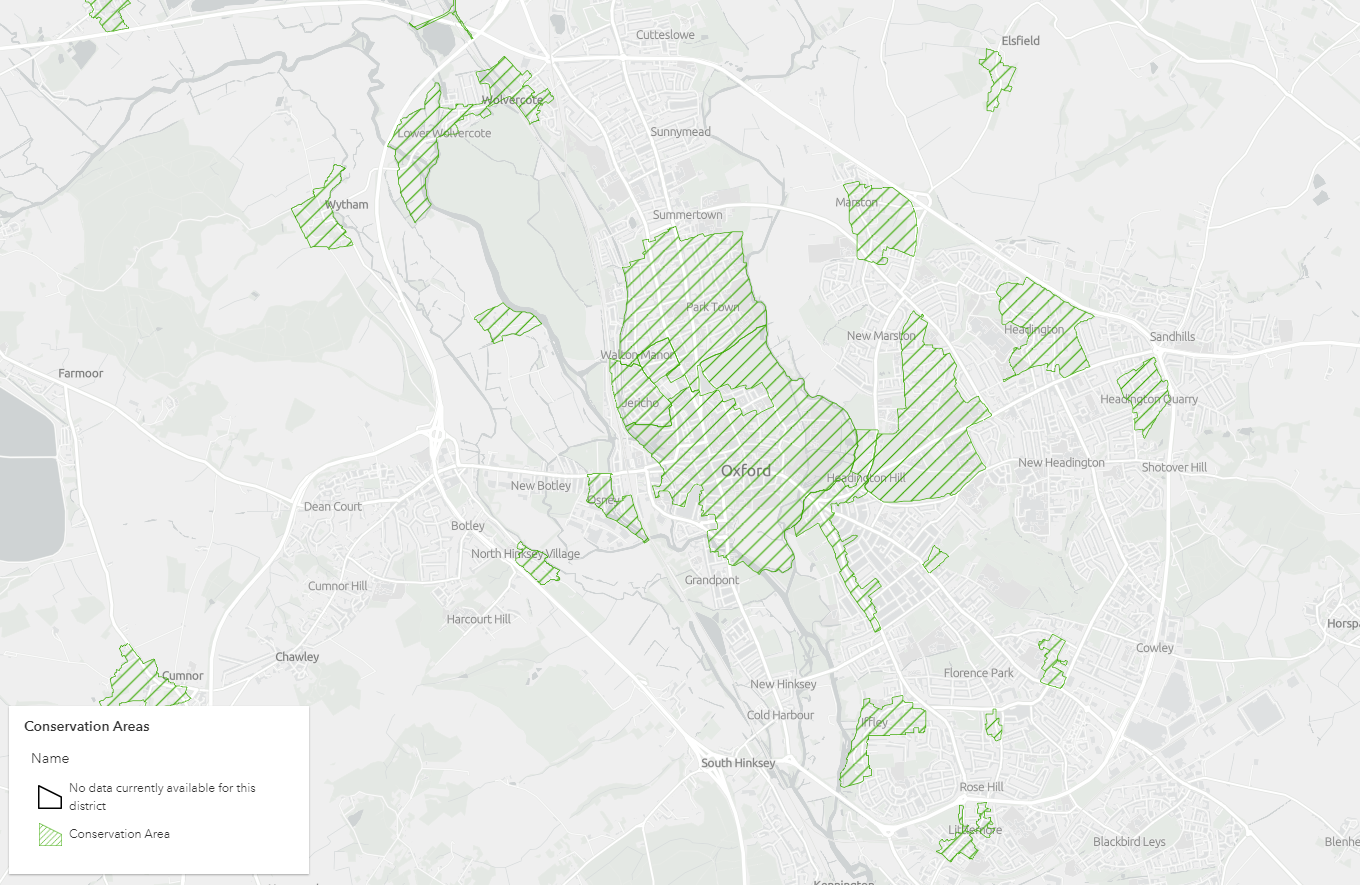
Conservation areas around Oxford made available by Historic England.
Conservation Areas in Wales provided by the Welsh Government
Equally worth highlighting is that the Welsh Government have also shared Conservation Area boundaries in Wales. This dataset was created to conform with the Planning Act of 1990. This service only provides boundaries and for the full information, including information on designations, individuals are advised to contact the appropriate Local Authority.
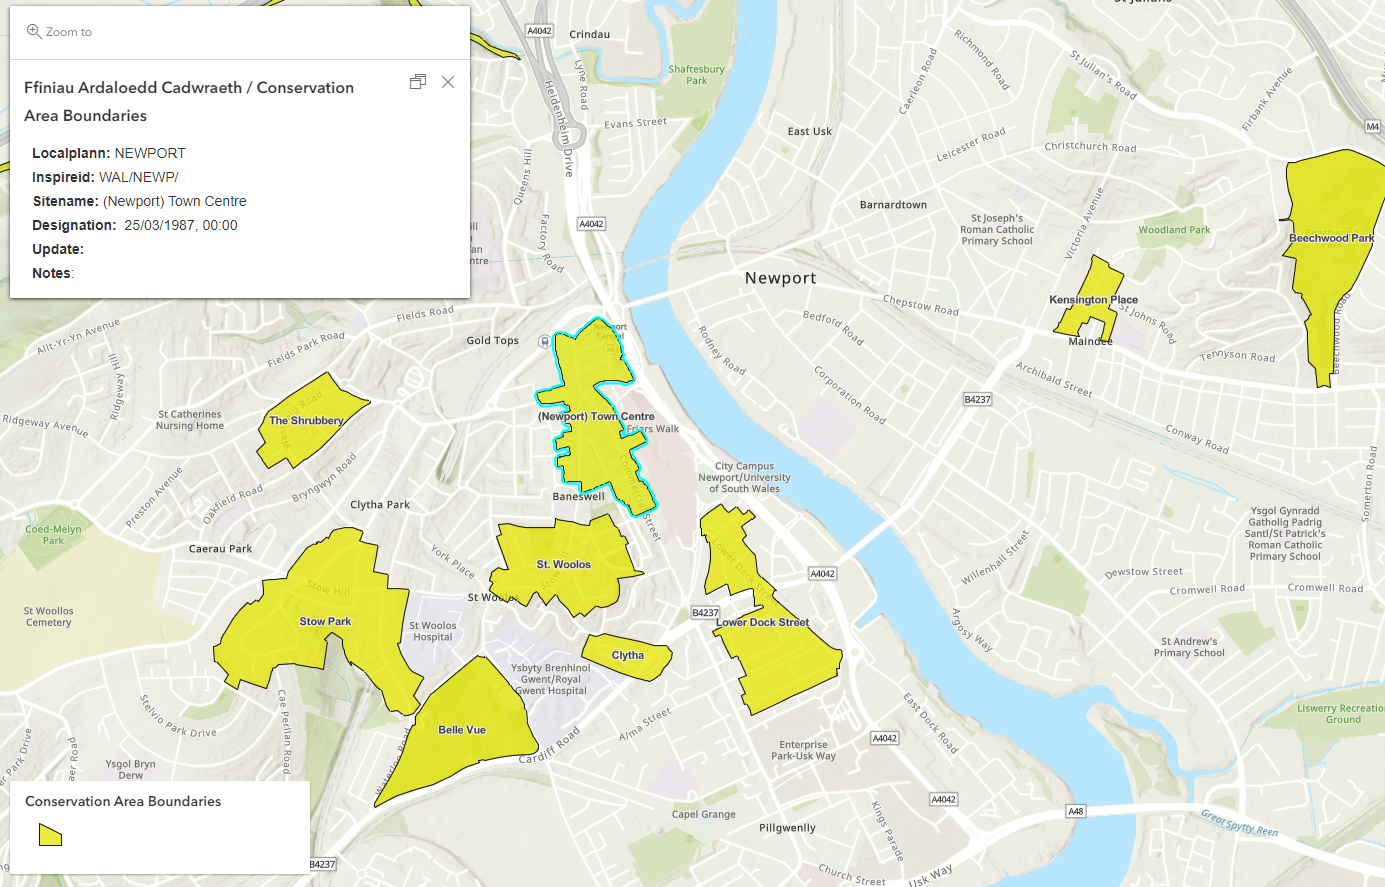
Conservation areas in Newport from the Welsh Government.
A shiny, new Living Atlas UK Dashboard (Beta)
To help keep you in the know of the different content in Living Atlas and who has contributed for the UK, I’ve created the Living Atlas dashboard. This is the perfect tool to help you answer questions like:
“How many item/contributors are there in Living Atlas”, “What are the most viewed items?” and “What items have been recently updated?”. With this dashboard you can explore Living Atlas content by filtering by contributor, item type, category and more. The dashboard is fully interactive and is updated on a weekly basis. It is currently in Beta release so if you have any feedback on what other metrics you would like to see, please reach out to DataCurator@esriuk.com.
Living Atlas UK Dashboard to help users explore what’s in Living Atlas and who has contributed.
Contribute to Living Atlas
See what our Living Atlas contributors have to say about sharing their data to Living Atlas:
Statement from NatureScot about their experience of contributing data to Living Atlas.
If your organisation has authoritative datasets that would be a valuable addition to the platform, contribute them to Living Atlas and you too can be featured in the next blog. Find out how in this StoryMap.
For any ArcGIS Living Atlas queries, please get in touch with DataCurator@esriuk.com.
Now you’re up to date…
Why not visit the ArcGIS Living Atlas of the World to explore the thousands of authoritative content at your fingertips?
To keep up to date with other ArcGIS Living Atlas news, check out Esri’s blog and follow our dedicated Twitter account. Join Esri Community to connect with other ArcGIS Living Atlas users and share ideas, solutions and collaborate to solve problems with GIS.