Smart home systems, wearable health monitors, autonomous farming equipment and even smart dog collars; the world is becoming more and more interconnected every day and we have the Internet of Things (IoT) to thank for that. IoT refers to the over 20 billion physical devices across the world that are embedded with sensors to connect and exchange data with other devices. Much of the data harvested by IoT sensors contains spatial information, an exciting thought for us GIS enthusiasts, providing us with an ever-expanding library of live observational data to explore and use in a range of use cases.
In ArcGIS we have a range of tools available to us and in this blog, I’m going to explore the real-time offerings that are all available within the ArcGIS system. All that’s left for you to do is decide which of our offerings is right for you.
The first question to ask is what are you looking to track and monitor. Perhaps you are looking to track the location of a vehicle, or explore how people move in an environment or to monitor static sensors such as road network surveillance. The ArcGIS system provides you with the products, tools and capabilities to collect, ingest, analyse and share real-time data. You have the flexibility to use one product independently or you could use multiple products together to get the best from your real-time data. Let’s look at the offerings.
ArcGIS Velocity
For those familiar with ArcGIS, when you hear the word ‘real-time’, ArcGIS Velocity may be the first to come to mind.
ArcGIS Velocity is a cloud-native, software-as-a-service (SaaS) add-on capability for ArcGIS Online, enabling you to ingest data from IoT platforms, message brokers or third-party APIs. By configuring a feed, you can connect to these external sources of data and produce a live map layer and watch your data populate your map as it is received.
But of course, there’s more. Once you have configured a feed, you can perform analytics, allowing you to explore your real-time data. ArcGIS Velocity has many different tools that allow you to transform and discover your data – analyse patterns, find locations, manage data, summarise data, use proximity and data enrichment. Whether you want to perform geofencing, find clusters in your data, or perhaps detect incidents, there are many options to analyse and explore your data in ArcGIS Velocity.

ArcGIS GeoEvent
ArcGIS GeoEvent provides a similar service to ArcGIS Velocity, but runs on-premise as part of an ArcGIS Enterprise deployment. As with Velocity, it starts with configuring a feed which you can display as a feature layer. You can modify your real-time monitoring, design real-time analytics and use filters and processors to refine your focus on the data and even send updates and alerts to those who need it, wherever they need it. Leaving you to make better decisions, the moment something happens.
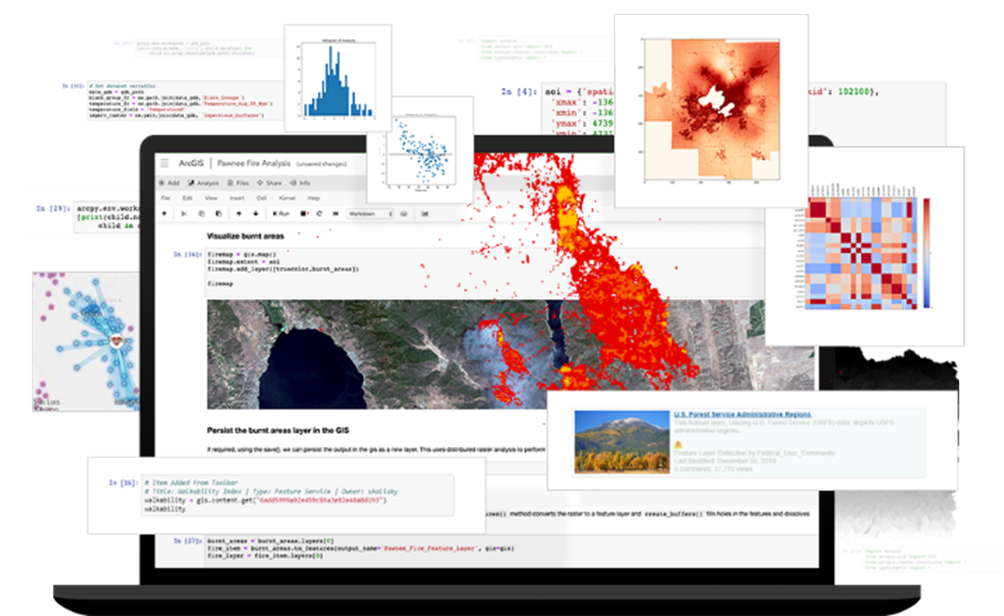
ArcGIS Notebooks
Next up is ArcGIS Notebooks. Notebooks provides a web-based interface that allows users to combine code, real-time visualisations, maps and data tools. Providing a Jupyter experience, Notebooks brings together spatial analysis algorithms with open-source Python libraries. Using Python and scheduled notebooks, you can create your own bespoke ingestion mechanisms for your real-time data. You could also use Notebooks to enhance your data engineering, perform advanced spatial analysis, use machine learning and deep learning frameworks to predict spatial events or even use built-in Python libraries to automate those repetitive administrative tasks. Now that’s a pretty powerful Notebook.
How do I get hold of ArcGIS Notebooks I hear you ask? – well that’s easy. ArcGIS Notebooks are available with:
- ArcGIS Pro (2.5 and above)
- ArcGIS Enterprise (10.7 and above)
- ArcGIS Online
Simply put, if you’re a lover of all things code, this could be the product for you in harnessing real-time data and visualisation. If you’re thinking ArcGIS Notebooks might be the route for you, this blog can help to get you started.
Notebooks are a great way to use Python with ArcGIS, but you can also run Python directly. Transport Scotland’s Gritter Tracker is a brilliant example of this in action, producing an application that displays real-time locations of all of their gritters, reassuring the public that they are doing what they can to keep the roads safe. This use case shows off what’s possible, why real-time visualisation is important and some rather amusing gritter vehicle names. Take a look for yourself.
Location Tracking in ArcGIS
This next offering is not a product but a real-time capability that can be accessed through several of our products. That’s right, the ArcGIS system even provides you with the tools to produce your very own real-time data with Location Tracking. One way of accessing Location Tracking is in our all-in-one application for efficient field operations, appropriately named ArcGIS Field Maps. You can also access this capability through ArcGIS QuickCapture, allowing you to record where users are and where they have been. Both apps can be used in conjunction with some of our other products mentioned above to provide an end-to-end solution, from data collection, analysis, to sharing.

Perhaps you need to coordinate your workforce out in the field. Using location tracking, you can see the live locations of everyone in the field who is holding a device running the chosen app. These real-time locations can then be visualised by adding it as a live map layer. You could track your workforce for operational purposes, have I deployed my teams to the appropriate areas? Perhaps there is an unforeseen event on site, which of your workers are nearby? Of course, tracking of your workforce also holds significant health and safety advantages, knowing the location, status, and wellbeing of all workers in the field can be critical, particularly in event of emergency.
But why stop at simply monitoring these live locations? You could perform analysis, determine if there’s a more efficient route for individuals in the field, spot areas that are not covered by your workers and act upon these findings as the data is coming in.
ArcGIS Dashboards
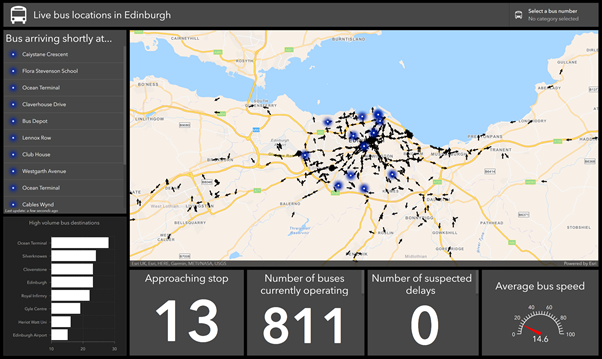
Once you have decided on your preferred way of ingesting and analysing real-time information, next you will need a method of displaying and sharing it with others. What is happening? Where is it happening? Where are my workers? What assets are available right now? ArcGIS Dashboards is a brilliant application to show off that real-time data. You can add infographics alongside your map to better understand your data and quickly respond to events in real-time.
It is also ideal for monitoring real-time – this next example shows the live locations of buses across Edinburgh. All in this one screen, you can see their live locations along with a number of statistics and information including the total number operating, any delays and buses that are approaching their stop.
Like what you see? Well, if you are wanting to show off your data or share insights of your live data feed, it may be time to get your hands on ArcGIS Dashboards.
It’s your time to shine
I hope this blog has proved useful in understanding the real-time offerings available within the ArcGIS system. The questions you must ask yourself is firstly, what do I want to track? And secondly, what do I need to answer using these real-time capabilities? Once you have answered both of those questions, you will find the ArcGIS real-time product/s that are right for you.
And with that, all that’s left is for you to get started.