Halloween is just around the corner, and what better way to celebrate than with a spooky map? Inspired by the Inferno map by John Nelson, we wanted to produce a scary map that centred on Halloween-related place names. In this blog, we’ll take a look at how this app was made using data from the ArcGIS Living Atlas of the World and then shared with a wider audience using ArcGIS Experience Builder.
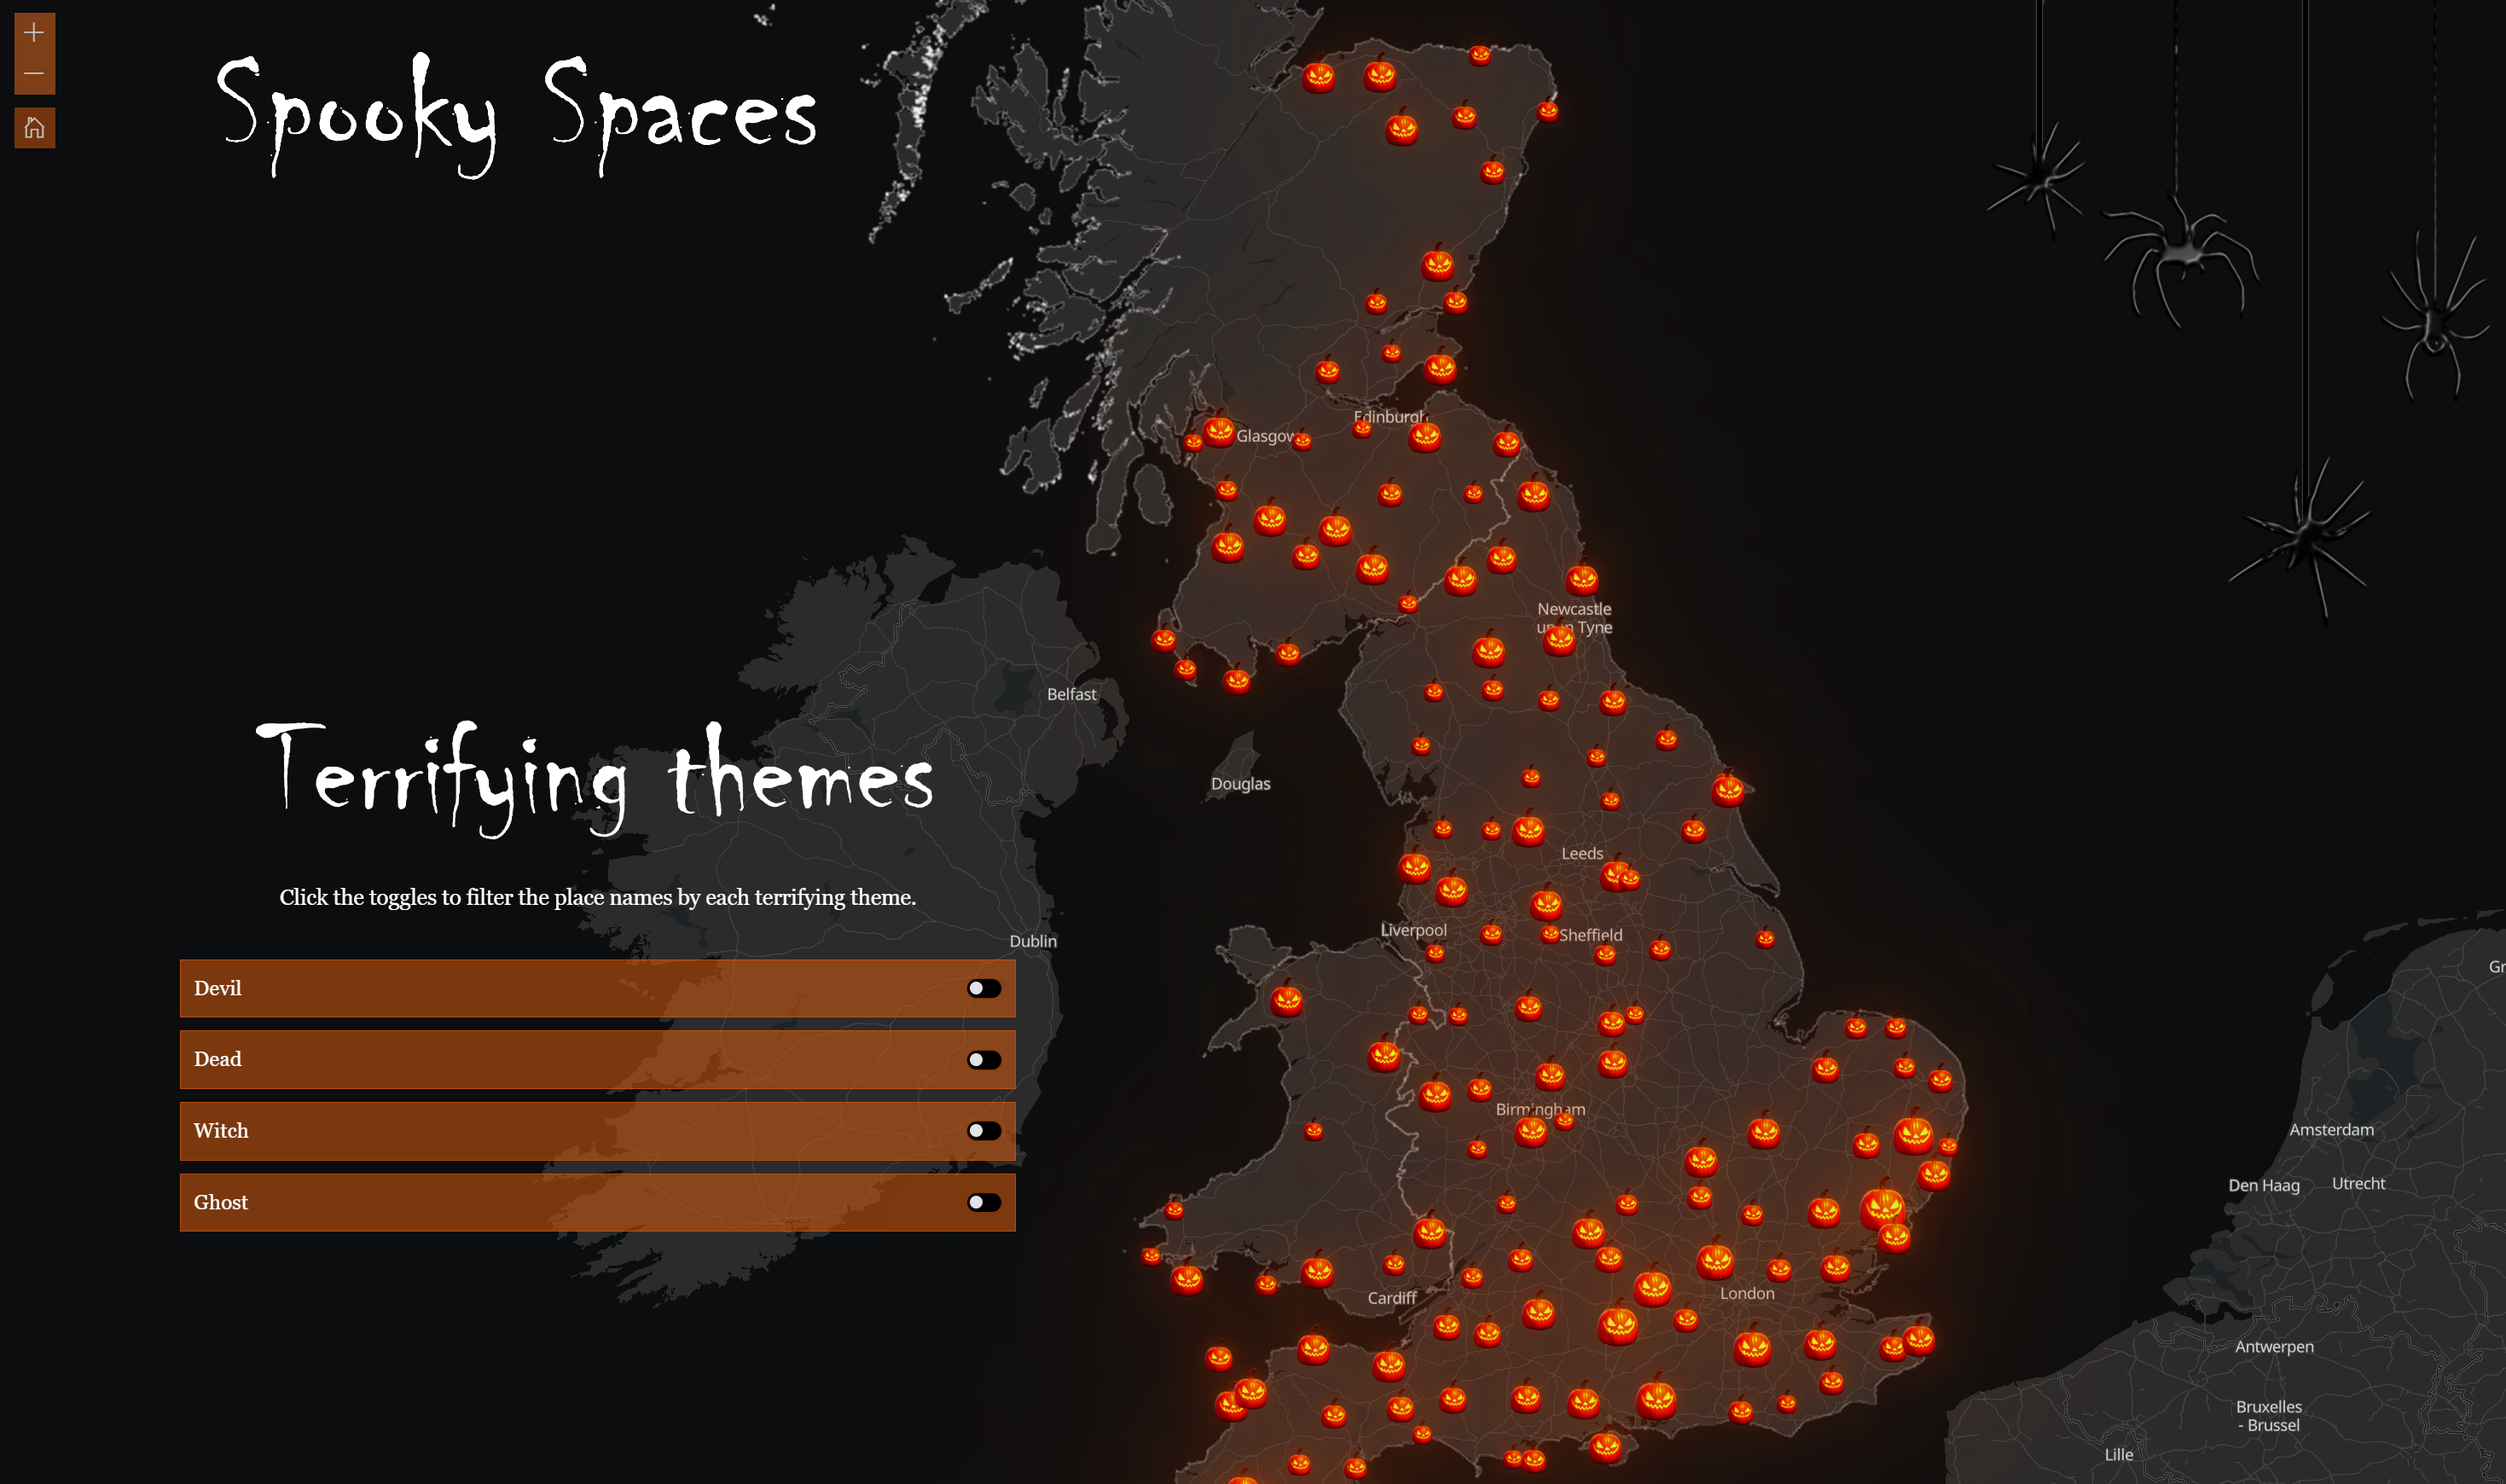
A snapshot of our eerie Experience Builder app. Are you spooked yet?
Great maps start with great data
When creating a map, it’s vital to start with the right dataset. The best place to begin your search for high-quality, authoritative data is the Living Atlas. This is a curated collection of datasets from a wide range of organisations that can be used across Esri’s product suite. You can explore all of the datasets on offer for yourself here.
We knew that we’d need a dataset containing placenames. The OS Open Names dataset, available in the Living Atlas, allows us to download the data directly in a geopackage format. Bringing the data into ArcGIS Pro, we started looking for spooky sounding names. Using the select by attribute tool, we selected placenames that contained words such as “dead,” “ghost,” or “witch”. This yielded close to 500 different places! Once we felt happy with the number of frightful features we’d collected, we exported them as a new layer and uploaded this to ArcGIS Online.
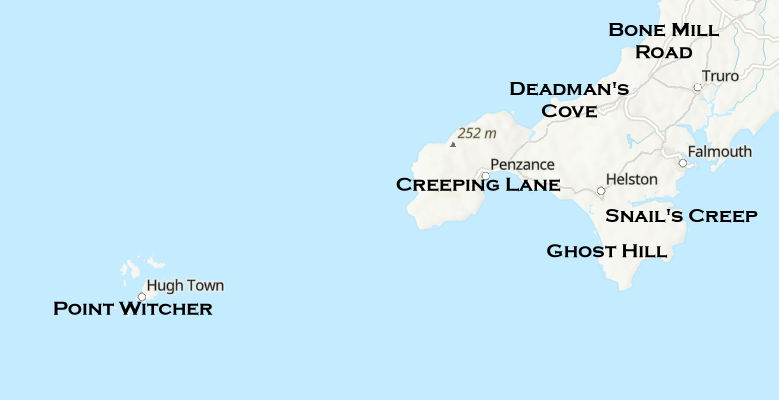
An initial look at the labelled map with names to give you chills.
Now for the fun part – let’s take this dataset and make it scary! First, we used pumpkins to symbolise our points and labelled each with a gothic, ghoulish font. To make this map really pop, we needed a basemap to highlight our customised symbology. Within the Living Atlas there are a wide range of basemaps available. We selected the OpenStreetMap Dark Gray Canvas basemap for its dark contrast against the orange features. Using the Vector Tile Style editor, a tool for creating custom basemap styles, we made our basemap even darker and added the names of a few key cities to help people navigate around the map.
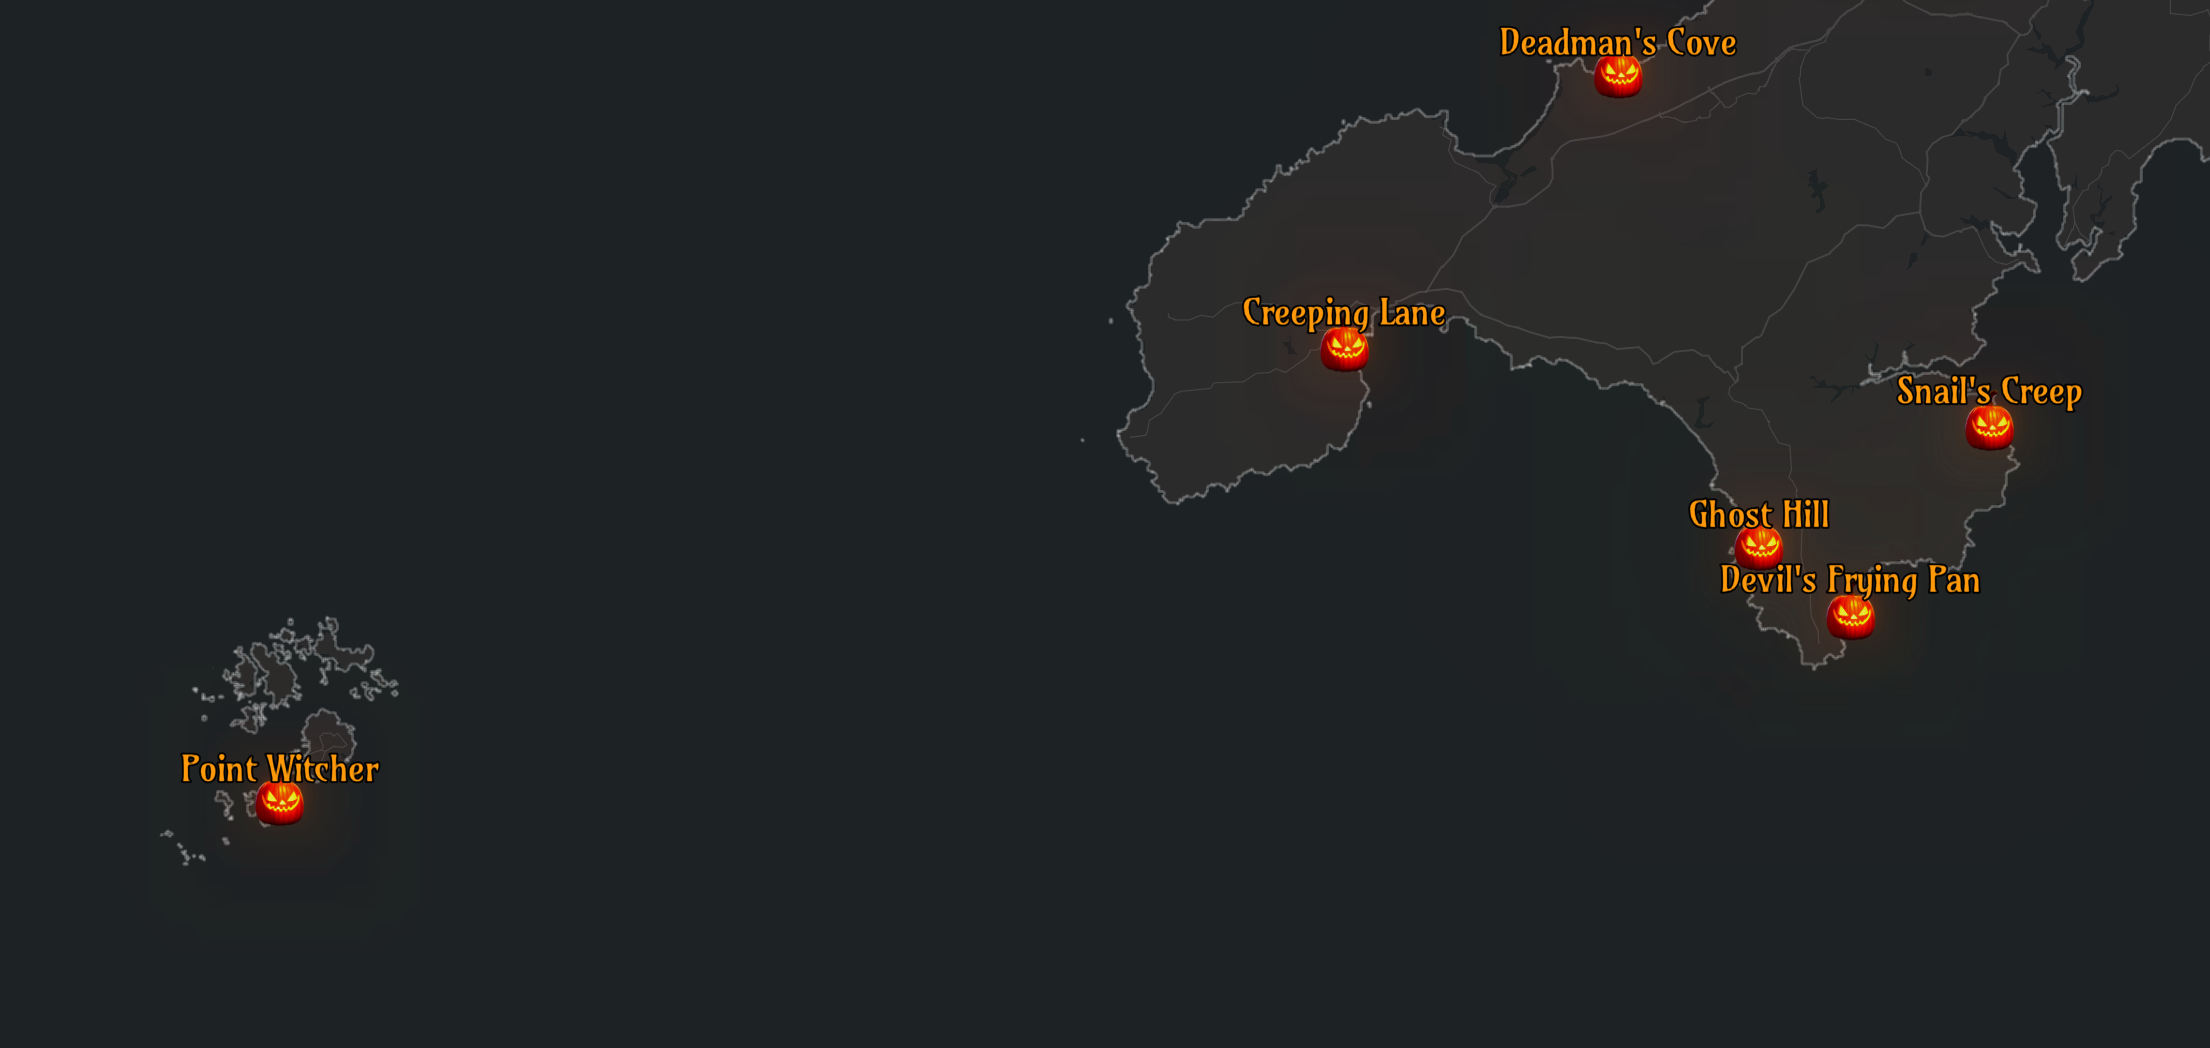
The dark and devilish map in ArcGIS Online’s Map Viewer.
Sharing your maps with apps
ArcGIS Experience Builder allows us to go a step further and create an interactive and fun way of exploring the underlying dataset. With this app builder, you can create a low or no code application that brings spatial and non-spatial components together. We’ve chosen to embed our map into the app, along with a widget to encourage end-users to interact with the data. One way to enhance your map with Experience Builder is to add a filter widget. This allows the user to quickly view a subset of the data, such as seeing where places with the words “devil,” “dead,” “witch” and “ghost” appear. To really take the design up a notch, you can also add images to your Experience Builder app. This is how we included the spooky font and creepy crawly spiders that make this Halloween map come alive…or maybe undead?
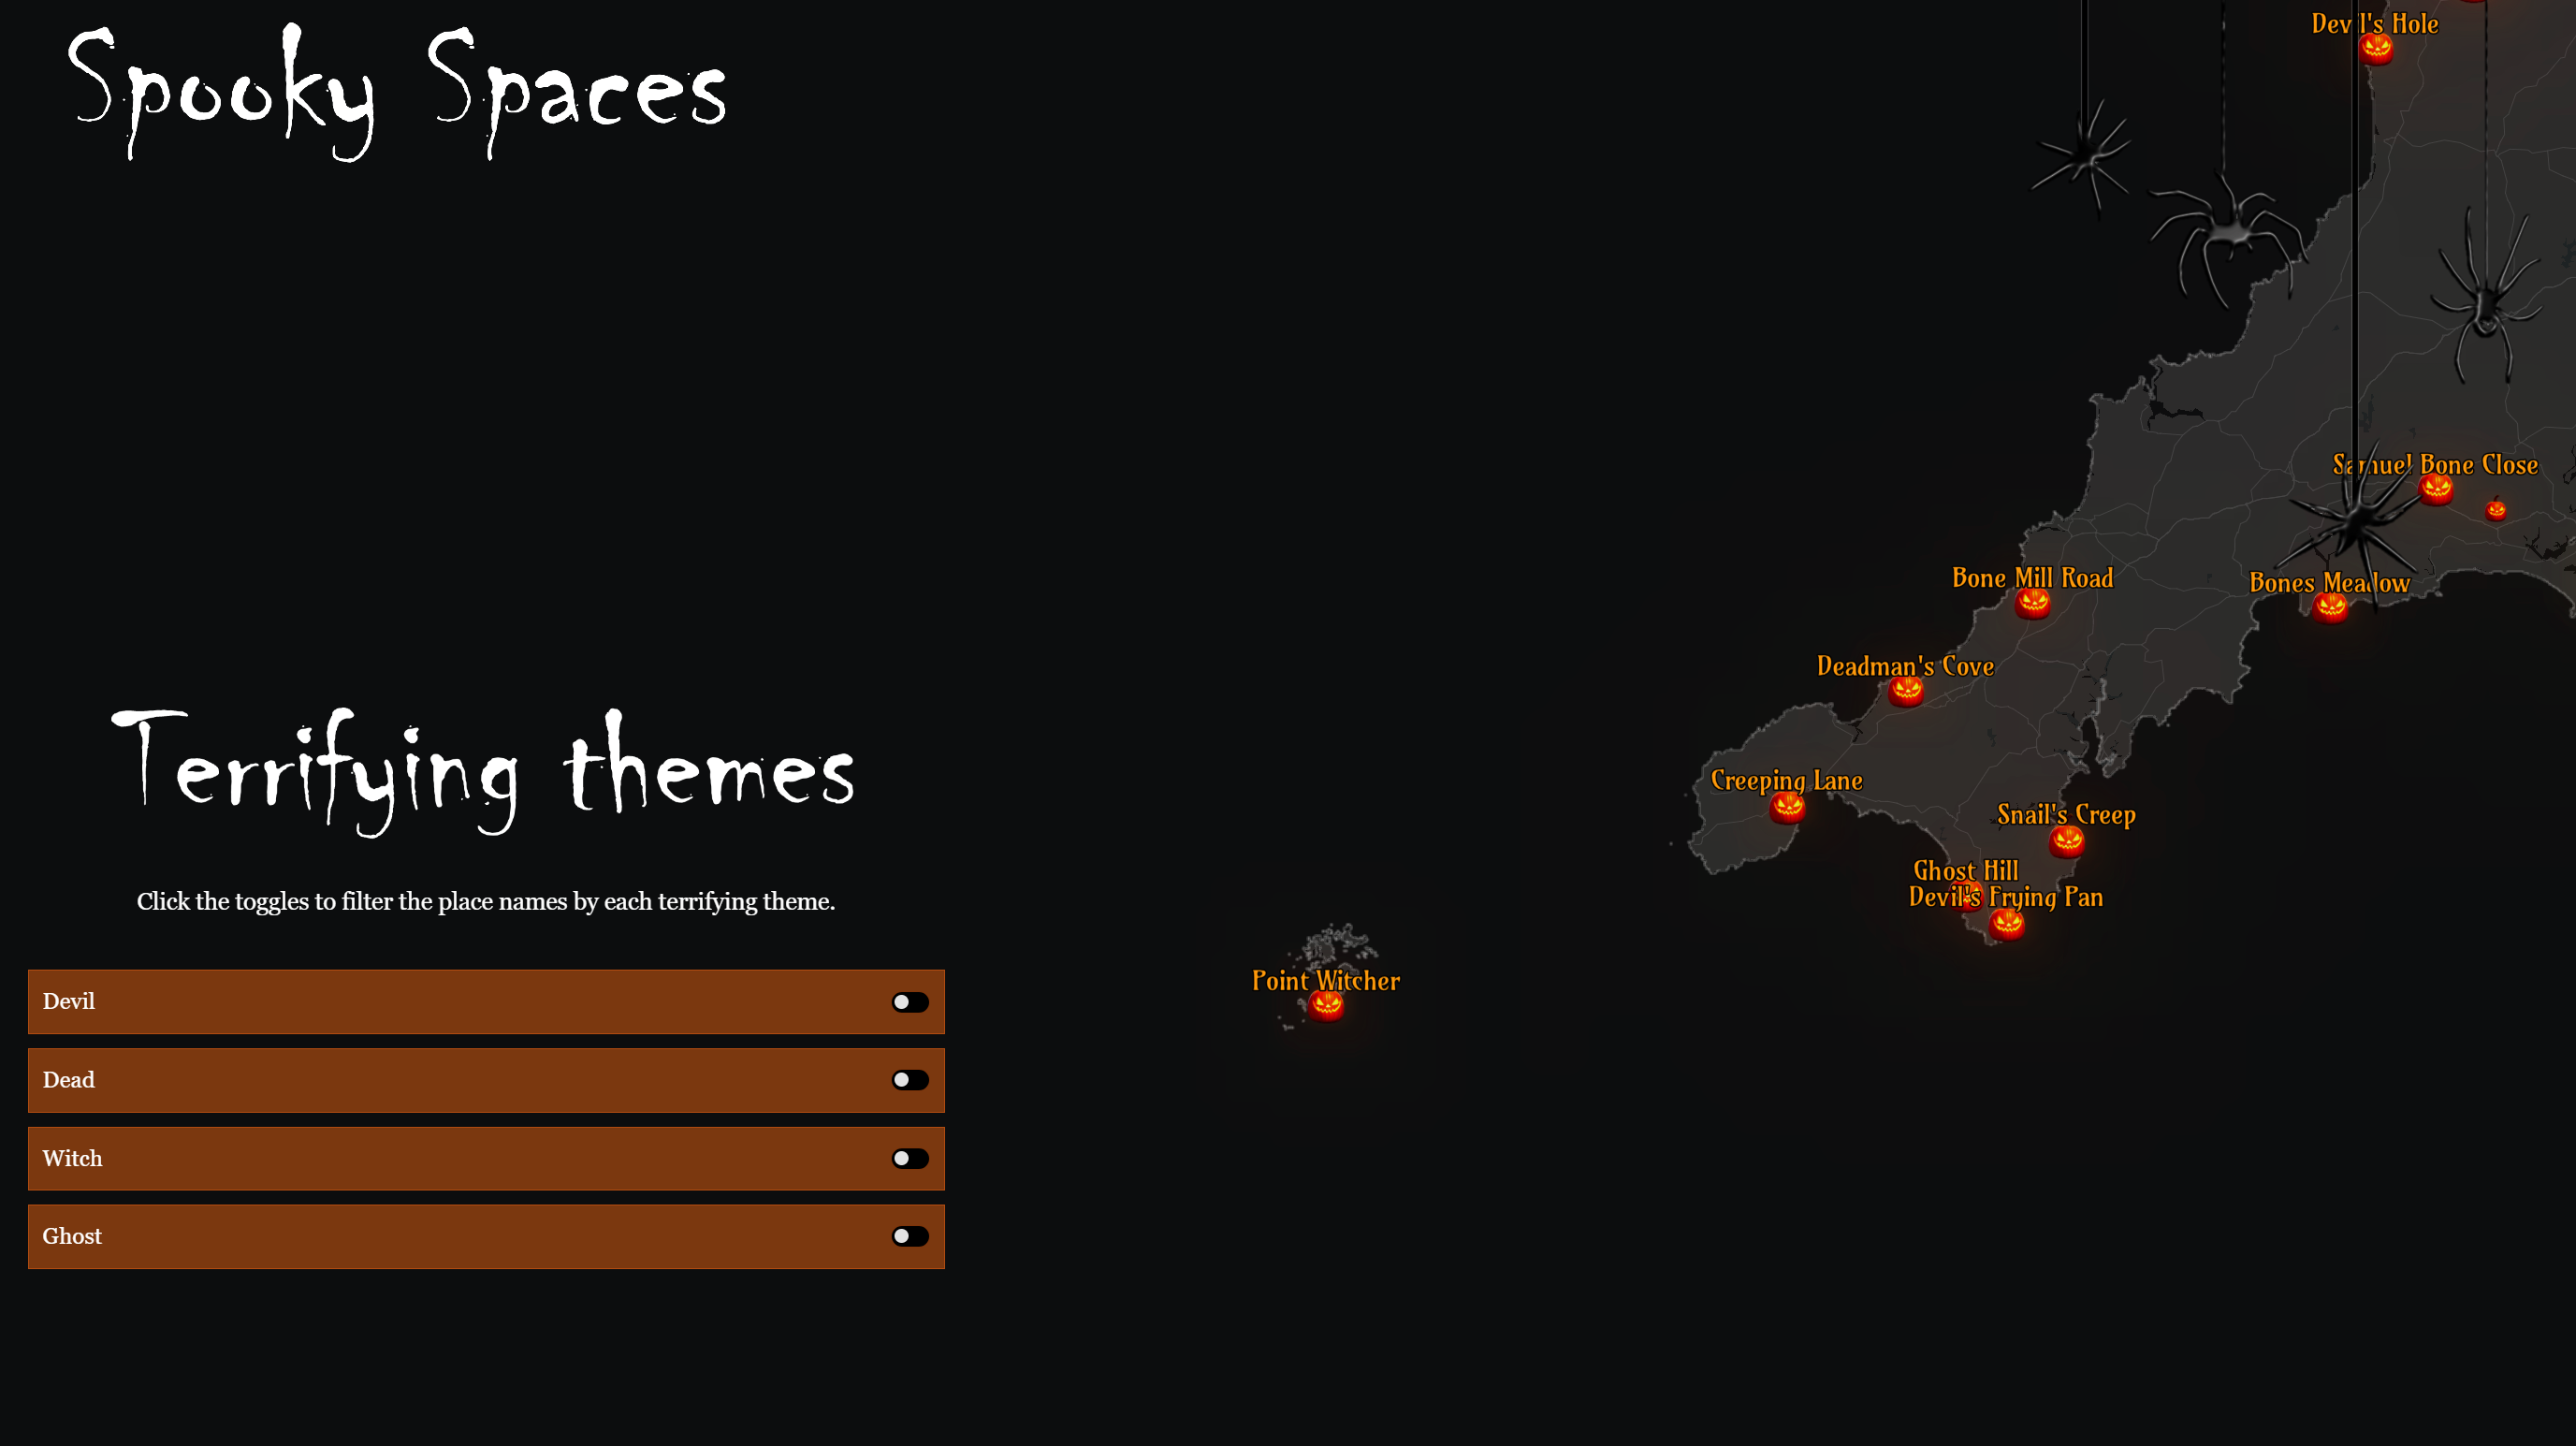
Adding the filters, spiders and scary text to complete the Spooky Spaces app.
Want to create your own Halloween map? Explore the Living Atlas and get started with this resource on ArcGIS Experience Builder.