Blog Archives
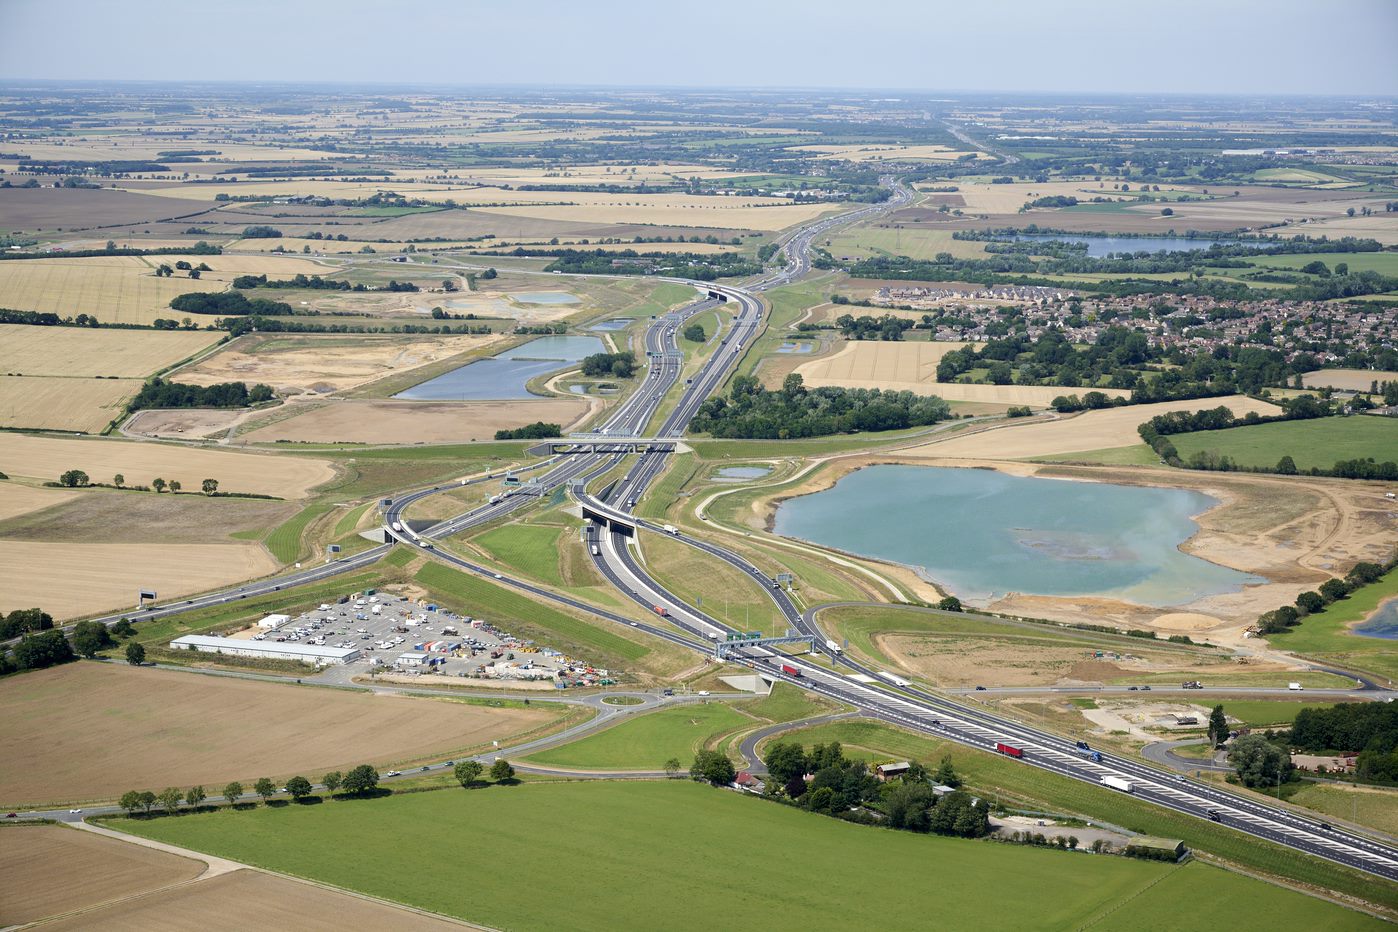
Costain
Our enterprise-wide deployment of ArcGIS is delivering substantial cost and time savings and enabling safer, faster, better, greener and more efficient programme delivery for our clients.
Costain uses ArcGIS as a strategic enterprise tool to help it deliver cost-effective and sustainable infrastructure projects. By making ArcGIS solutions available to all employees from engineers and environmentalists to asset inspectors and project managers, the organisation is making multi-million pound cost savings, accelerating processes and delivering pioneering biodiversity schemes.
All project information, including BIM and third party data is made accessible to teams via ArcGIS web apps
Environmental surveys and asset maintenance checks are carried out on mobile devices using ArcGIS field apps
Live data from the field is analysed and shared on ArcGIS Dashboards to improve decision making
The Challenge
Large infrastructure projects depend on large volumes of geospatial information. Designers, engineers, planners, environmentalists and project managers all need to be able to collect, analyse and share data on everything from the locations of assets to biodiversity on construction sites. Costain decided to expand its use of geographic information system (GIS) technology to put geospatial data at the heart of its business and use it even more effectively to enable safer, faster, better, greener and more efficient programme delivery.
“We estimate that we save millions of pounds by using ArcGIS across our large infrastructure projects, which enables us to make competitive bids and deliver even more cost-effective services for our clients.”
Sophie Stouki, Group Head of GIS, Costain
The Solution
Costain started by building a single portal for all geospatial information, for the entire organisation, using ArcGIS Enterprise. Then, it developed a series of ArcGIS web apps to provide specific groups of employees with the capabilities they need to access data pertinent to their contracts and perform their jobs.
Chief amongst these web apps is a solution called ‘Costain on a map’ that provides all employees with a gateway to the company’s growing reservoirs of geospatial data, as well as data from other systems, such as HR and Building Information Modelling (BIM), as well as remote sensors and unmanned aerial vehicles (UAVs). “The ability of ArcGIS to collate data from many internal and third party sources and make it available to lots of people via a web browser is really powerful,” says Sophie Stouki, Group Head of GIS at Costain.
Costain also developed a suite of ArcGIS field apps, for collecting and viewing data on mobile devices about everything from the locations of trees and archaeology to the condition of assets and the views of stakeholders.
This live data is then displayed on ArcGIS Dashboards, where it can be used for reporting and data analysis.
ArcGIS is currently used by around 1,200 employees including:
- Designers for visualising their designs in 2D and 3D in their geographic context
- Engineers for better understanding how schemes interact with the topology of the area
- Environmentalists for carrying out biodiversity and archaeology surveys in the field and analysing their findings
- Project managers for scheduling works in the field and understanding which assets will be where at each phase of the project
- Planners for improving their understanding of the implications of delayed deliveries or bad weather
- Road inspectors for managing 150,000 assets as part of a large highways and road maintenance contract
- Contact centre staff for responding to telephone queries, noting asset defects and passing on information to maintenance teams.
“ArcGIS allows us to be smarter in how we collect, analyse, and visualise environmental data, making the implementation of innovations that reduce environmental impacts more feasible on a larger scale.”
Katie Dawson, GIS Lead for Environment, Costain
Benefits
Multi-million pound cost savings
The enterprise-wide adoption of ArcGIS has eliminated the need for Costain to pay external contractors to create GIS apps. Furthermore, everyone in the organisation, from engineers to ecologists, has easy access to the live data they need to make better decisions and deliver quality projects, quickly and more cost effectively. “We estimate that we save millions of pounds by using ArcGIS across our large infrastructure projects, which enables us to make competitive bids and deliver even more cost-effective services for our clients,” says Stouki.
Substantial time savings
Throughout the business, teams are now able to work even more efficiently, both in the field and in the office. For instance, a team of ten environmental specialists has saved as many as 18 hours a week by using ArcGIS to gain rapid access to environmental data, reducing the duration of a key client project. One of Costain’s asset maintenance processes is significantly faster than before, due to the seamless integration and instant availability of data from the field. Furthermore, the use of ArcGIS apps, field-based solutions, dashboards and other geospatially-enabled systems has saved time in the delivery of key utility works.
More effective collaboration
ArcGIS significantly improves collaboration in large, multi-disciplinary teams by improving access to project data and facilitating communication. For example, Costain has used ArcGIS Survey123 to develop a form-based method of allowing teams to submit feedback on project designs. “Communication between project teams is now much faster than with paper-based processes,” Stouki says.
Smarter implementation of biodiversity schemes
Environmentalists use ArcGIS to collect habitat data in the field, model how the environment will be impacted by projects and devise plans to reinstate habitats once construction has been completed. “ArcGIS allows us to be smarter in how we collect, analyse, and visualise environmental data, making the implementation of innovations that reduce environmental impacts more feasible on a larger scale,” says Katie Dawson, GIS Lead for Environment at Costain.
Reduced risk of redesigns and delays
With the wealth of data that can be accessed and visualised through ArcGIS, designers can create feasible designs from the outset and, if needed, make timely changes along the way that do not impact project schedules and costs. Equally, planners can view live data on shipments and weather within ArcGIS to better plan the sequence of works. “The insight that ArcGIS provides helps us to mitigate the risks of additional design costs and project delays,” Stouki says.


NHS South, Central and West
The use of ArcGIS for geospatial analysis, temporal modelling and data sharing helped the NHS to plan and deliver a world-leading COVID-19 vaccination programme.
When the NHS faced the enormous challenge of vaccinating the entire UK population within an ambitious timescale, geospatial analysis brought clarity to the planning process. NHS South, Central and West (SCW) used ArcGIS to help it locate vaccination sites, allocate the supply of vaccines, avoid vaccine wastage and monitor vaccination up-take.
The best locations for vaccination sites were modelled using ArcGIS Pro and decisions were made using ArcGIS web apps
ArcGIS dashboards were created to highlight key information and statistics to decision-makers in a lightweight, easy to read format
The up-take of vaccinations in deprived areas or harder to reach communities is highlighted in ArcGIS Story Maps to inform targeted interventions
The Challenge
The COVID-19 pandemic was the biggest challenge faced by the NHS in its 70+ year history. Not only did the NHS need to treat high numbers of exceptionally ill patients with a highly infectious disease, but it also had to plan and implement a nationwide vaccination programme on a scale and at a pace never imagined before. The geographic information system (GIS) team at NHS South, Central and West (SCW) initially received a simple request to map potential vaccination sites in the South West, but this led to the realisation that GIS technology could do so much more.
“Through our use of ArcGIS, we have supported the NHS to deliver a massive, coordinated effort and vaccinate millions of people in the UK in a planned and efficient way.”
Trevor Foster, Associate Director, Geographic Intelligence and Mapping Service, NHS South, Central and West
The Solution
In what was its first year of using Esri’s ArcGIS system, SCW used ArcGIS Pro to conduct geospatial analyses and build and share sophisticated map-based models, showing the locations of potential vaccination sites, the number of people in the local population by age and travel times to vaccination sites. This analysis activity was quickly expanded to cover three NHS regions – the South West, East and South East – an area with a total population of over 21 million people.
SCW created an ArcGIS web app to allow NHS decision-makers in the three regions to view potential vaccination sites and test possible site combinations to see which options provided the best accessibility for the local population. Easy to use, this web app allowed decision-makers to make well-informed choices themselves, very quickly, without waiting for analyst support. The ArcGIS web app was used in live planning workshops, with multi-disciplinary teams, working at speed together to make key planning decisions based on robust and accurate analysis.
SCW also took advantage of the temporal modelling capabilities of ArcGIS to create demand and supply phasing models to calculate how much vaccine would be needed by each vaccination site, based on the number of people in the local population eligible for a vaccination, in each phase of the vaccination roll-out. The output of this temporal modelling was displayed in ArcGIS Story Maps and Dashboards, giving NHS managers clear visibility of the data they needed to allocate the supply of vaccine appropriately.
The use of ArcGIS expanded very rapidly during the pandemic and, within months, SCW was providing GIS analysis to support the NHS at a national level, as well as support healthcare professionals working locally in specific regions and ICS systems. Now, the organisation is building on its experience to help the NHS leverage geospatial analysis as part of ‘business as usual’ activities.
“The use of ArcGIS to plan house-bound vaccinations reduced vaccine wastage, but also made the whole process much more efficient, to avoid wasting the time of healthcare professionals.”
Ian Maxfield, Associate Head of Geographic Intelligence and Mapping, NHS South, Central and West
Benefits
Effective planning of vaccination roll-out
The use of geospatial analysis supported the NHS to plan a vaccination programme on an unprecedented scale. SCW modelled the optimum locations for vaccination sites and adjusted this model iteratively as the Government’s roll-out strategy evolved. It also worked at a national level, advising NHS England which people to invite for vaccinations, when and where to send them, based on individuals’ locations, ages, travel times to vaccination centres and the availability of vaccine. “Through our use of ArcGIS, we have supported the NHS to deliver a massive, coordinated effort and vaccinate millions of people in the UK in a planned and efficient way,” says Trevor Foster, Associate Director, Geographic Intelligence and Mapping Service at SCW
Reduced wastage in vaccine supply
SCW also modelled the optimum routes for vaccinating housebound people in Somerset, to allow district nurses and GPs to reach as many vulnerable housebound people as possible, as quickly as possible, while ensuring all available vaccines were used. “The use of ArcGIS to plan housebound vaccinations reduced vaccine wastage, but also made the whole process much more efficient, to avoid wasting the time of healthcare professionals,” notes Ian Maxfield, Associate Head of Geographic Intelligence and Mapping at SCW.
Targeted action to reduce health inequalities
SCW is currently using ArcGIS to analyse areas where there is low up-take of COVID-19 vaccinations. It shares this information in interactive ArcGIS Story Maps to help NHS decision-makers plan targeted interventions that will encourage more people to get vaccinated and prevent health inequalities. Reissued weekly with up-to-date data, the Story Map displays socio-economic data on areas of deprivation and highlights changes over time, so the NHS can monitor the impact of its interventions. ArcGIS and Story Maps will be used to support other similar health improvement schemes in the future.
Confident decision-making in NHS planning
Beyond the vaccination programme, SCW is using ArcGIS to support decision-making in the introduction of new health initiatives and the management of ongoing NHS services. For example, ArcGIS is being used to plan the logistics for a new saliva-based test for routine, asymptomatic COVID-19 testing at two hospital trusts in Devon and Cornwall. ArcGIS is also being used to help reallocate patients to alternate GP practices, following the closure or merger of practices, based on travel times. SCW has used ArcGIS Survey123 to collect patient preferences and will be introducing new dashboards to help NHS decision-makers make timely, confident decisions.
Sightsavers
We use the ArcGIS System to help locate communities at risk from preventable blindness, and treat them. We also share our findings and insights with multiple stakeholders through our Open Data Portal.
Nearly half of visual impairments can be treated or prevented. But many communities at risk of the neglected tropical disease (NTD), river blindness, are in highly inaccessible areas of sub-Saharan Africa. Since 1950, the charity Sightsavers has been preventing sight loss around the world. They are now using ArcGIS to locate and treat nomadic at-risk communities and share their findings with local government, humanitarian and medical organisations.
Satellite imagery is used with ArcGIS Pro and ArcGIS Explorer to inform more impactful treatment programmes.
Fieldworkers have access to identified routes to reach remote locations, allowing them to work more quickly and efficiently.
Transparency and knowledge sharing are made possible through ArcGIS Online and an Open Data Portal, configured with ArcGIS Hub.
The Challenge
NTDs are parasitic and bacterial infections, some of which can be a major cause of blindness. River blindness, or onchocerciasis, is an NTD spread by the bite of infected blackflies that breed in fast-flowing rivers. 205 million people are at risk of contracting river blindness which, if untreated can result in permanent loss of sight.
As well as pain, blindness and the associated stigma, river blindness causes people to move away from fertile river valleys; they end up struggling to find areas to farm or grow crops, pushing families and communities into poverty.
The flies that spread the disease become re-infected from untreated groups of people, bringing the disease back. Yet this disease is preventable, can be treated, and even eliminated.
More than 99% of those infected live in sub-Saharan Africa, often in conflict zones and rural, inaccessible areas. Of particular concern are previously unknown and unreachable nomadic communities who do not have the knowledge of or access to the treatments that can prevent irreversible blindness.
Sightsavers is determined to eliminate avoidable blindness and support equal opportunities for people with visual impairments and other disabilities. Finding the most efficient and reliable means of locating, reaching and offering nomadic communities the opportunity to participate in their treatment programme, is one of the charity’s biggest challenges.
“Taking an innovative approach to fighting disease is at the heart of our mission. Using ArcGIS has helped us to not only locate and treat those at risk in the field, but also monitor treatment progression and communicate our projects’ vital findings and success more widely.”
Alexandre Chailloux, Research Associate: Spatial Analysis, Sightsavers
The Solution
Sightsavers has worked with ArcGIS since 2013 and, having worked with Esri’s Professional Services team and undertaken a number of training courses, now uses GIS across multiple departments to solve different problems.
To address this specific challenge, the charity has developed a tailored approach to better reach these nomadic communities. This includes using nomadic guides and local drug distributors, creating materials in the local language, and exploiting satellite imagery to find where camps are located. Many of these camps are so remote they are only accessible by motorbike or by foot.
Access to hi-res imagery from Esri’s Living Atlas identifies the location of potential settlements which are categorised as “Probable” or “Less Probable”. Using ArcGIS Pro these findings are then compared with the most recent satellite imagery available to update the results.
Using ArcGIS Explorer, route locations to settlements are identified and downloaded onto mobile devices to help fieldworkers visualise where camps are located. Importantly, the App can be used even in areas where there is no network coverage. Dashboards visualise the movement of guides in the field to monitor the progression of treatment and ensure that all fieldworkers are safe.
This GIS-led approach has already helped Sightsavers to identify a number of nomadic settlements which were previously totally unknown to local guides. On one programme 85% of the “Probables” were identified as actual settlements, as were 29% of the “Less Probable”. These research findings in conjunction with local knowledge and expertise are now being used to refine the search criteria methodology to further enhance the accuracy of future initiatives.
Furthermore, Sightsavers is transforming how it is engaging and collaborating with staff, stakeholders and broader communities through its Open Data Portal. Configured using ArcGIS Hub, ‘MyPortal’ enables anyone interested in Sightsavers’ work with NTDs to download publicly accessible NTD data tools and resources, view its library of NTD StoryMaps, and explore an interactive map of its research activities.
“Out in the field we need to verify if camps previously identified by satellite imagery are actual camps where nomads live. With ArcGIS tools we can reach these communities more quickly, census the camps and then prepare people for treatment; we don’t want to leave anyone behind.”
Kareen Atekem, Research Coordinator, Sightsavers
Benefits
Effective planning
ArcGIS Pro enables the spatial analysis team to manipulate and assess satellite imagery to define the most probable areas where remote and previously unidentifiable communities are located. This can be quickly and efficiently achieved and, using ArcGIS Explorer, precise routes are downloaded to mobile devices, so fieldworkers can reach and treat those in need, more speedily.
Increased Efficiency for Fieldworkers
Despite often being offline fieldworkers have clear guidance and routes as to how they can reach isolated and often remote locations communities, as quickly as possible. Dashboards monitor their progress, back in the office, keeping everyone updated on progress.
Transparency and Knowledge Sharing
The Open Data Portal was easily configured using ArcGIS Hub and acts as a transparent community engagement platform. Communication and collaboration are maximised with stakeholders. Data and findings are more broadly shared, internally, and externally, helping to improve outcomes. Featured StoryMaps provide visually impactful, compelling stories which further extend outreach and advocacy and act as educational tools while delivering vital information in an easy to absorb manner.
Helping the Vulnerable
The use of GIS by humanitarian services helps organisations to work more efficiently and, for Sightsavers, deliver life-changing treatments to those at risk. Using satellite data to research different treatment areas and aligning results with treatment programmes, informs decision making and makes a positive impact on avoidable blindness.
Severn Trent
Through our use of ArcGIS Hub Premium, we have delivered a wastewater industry first, creating our DWMP Hub which is empowering stakeholders and organisations to digitally collaborate on the key challenges around wastewater and flooding
As our drainage and wastewater systems face ever increasing pressures they need to become more resilient. Whilst sewerage companies already carry out wastewater catchment planning to mitigate future risks, these wastewater assets interact with other drainage systems, which are the responsibility of other stakeholders. To support the development of long-term collaborative catchment strategies, sewerage companies are developing Drainage and Wastewater Management Plans (DWMP). In an industry first, Severn Trent has developed an innovative, digitised approach for multiple flood risk management stakeholders to work together, through an interactive, map-centric platform based on Esri’s ArcGIS Hub.
Digital engagement increases participation and drives collaboration
Solution was quick and easy to set up, a seamless extension of the existing GIS
Content is easily shared and published out to stakeholders supporting strategic decision-making
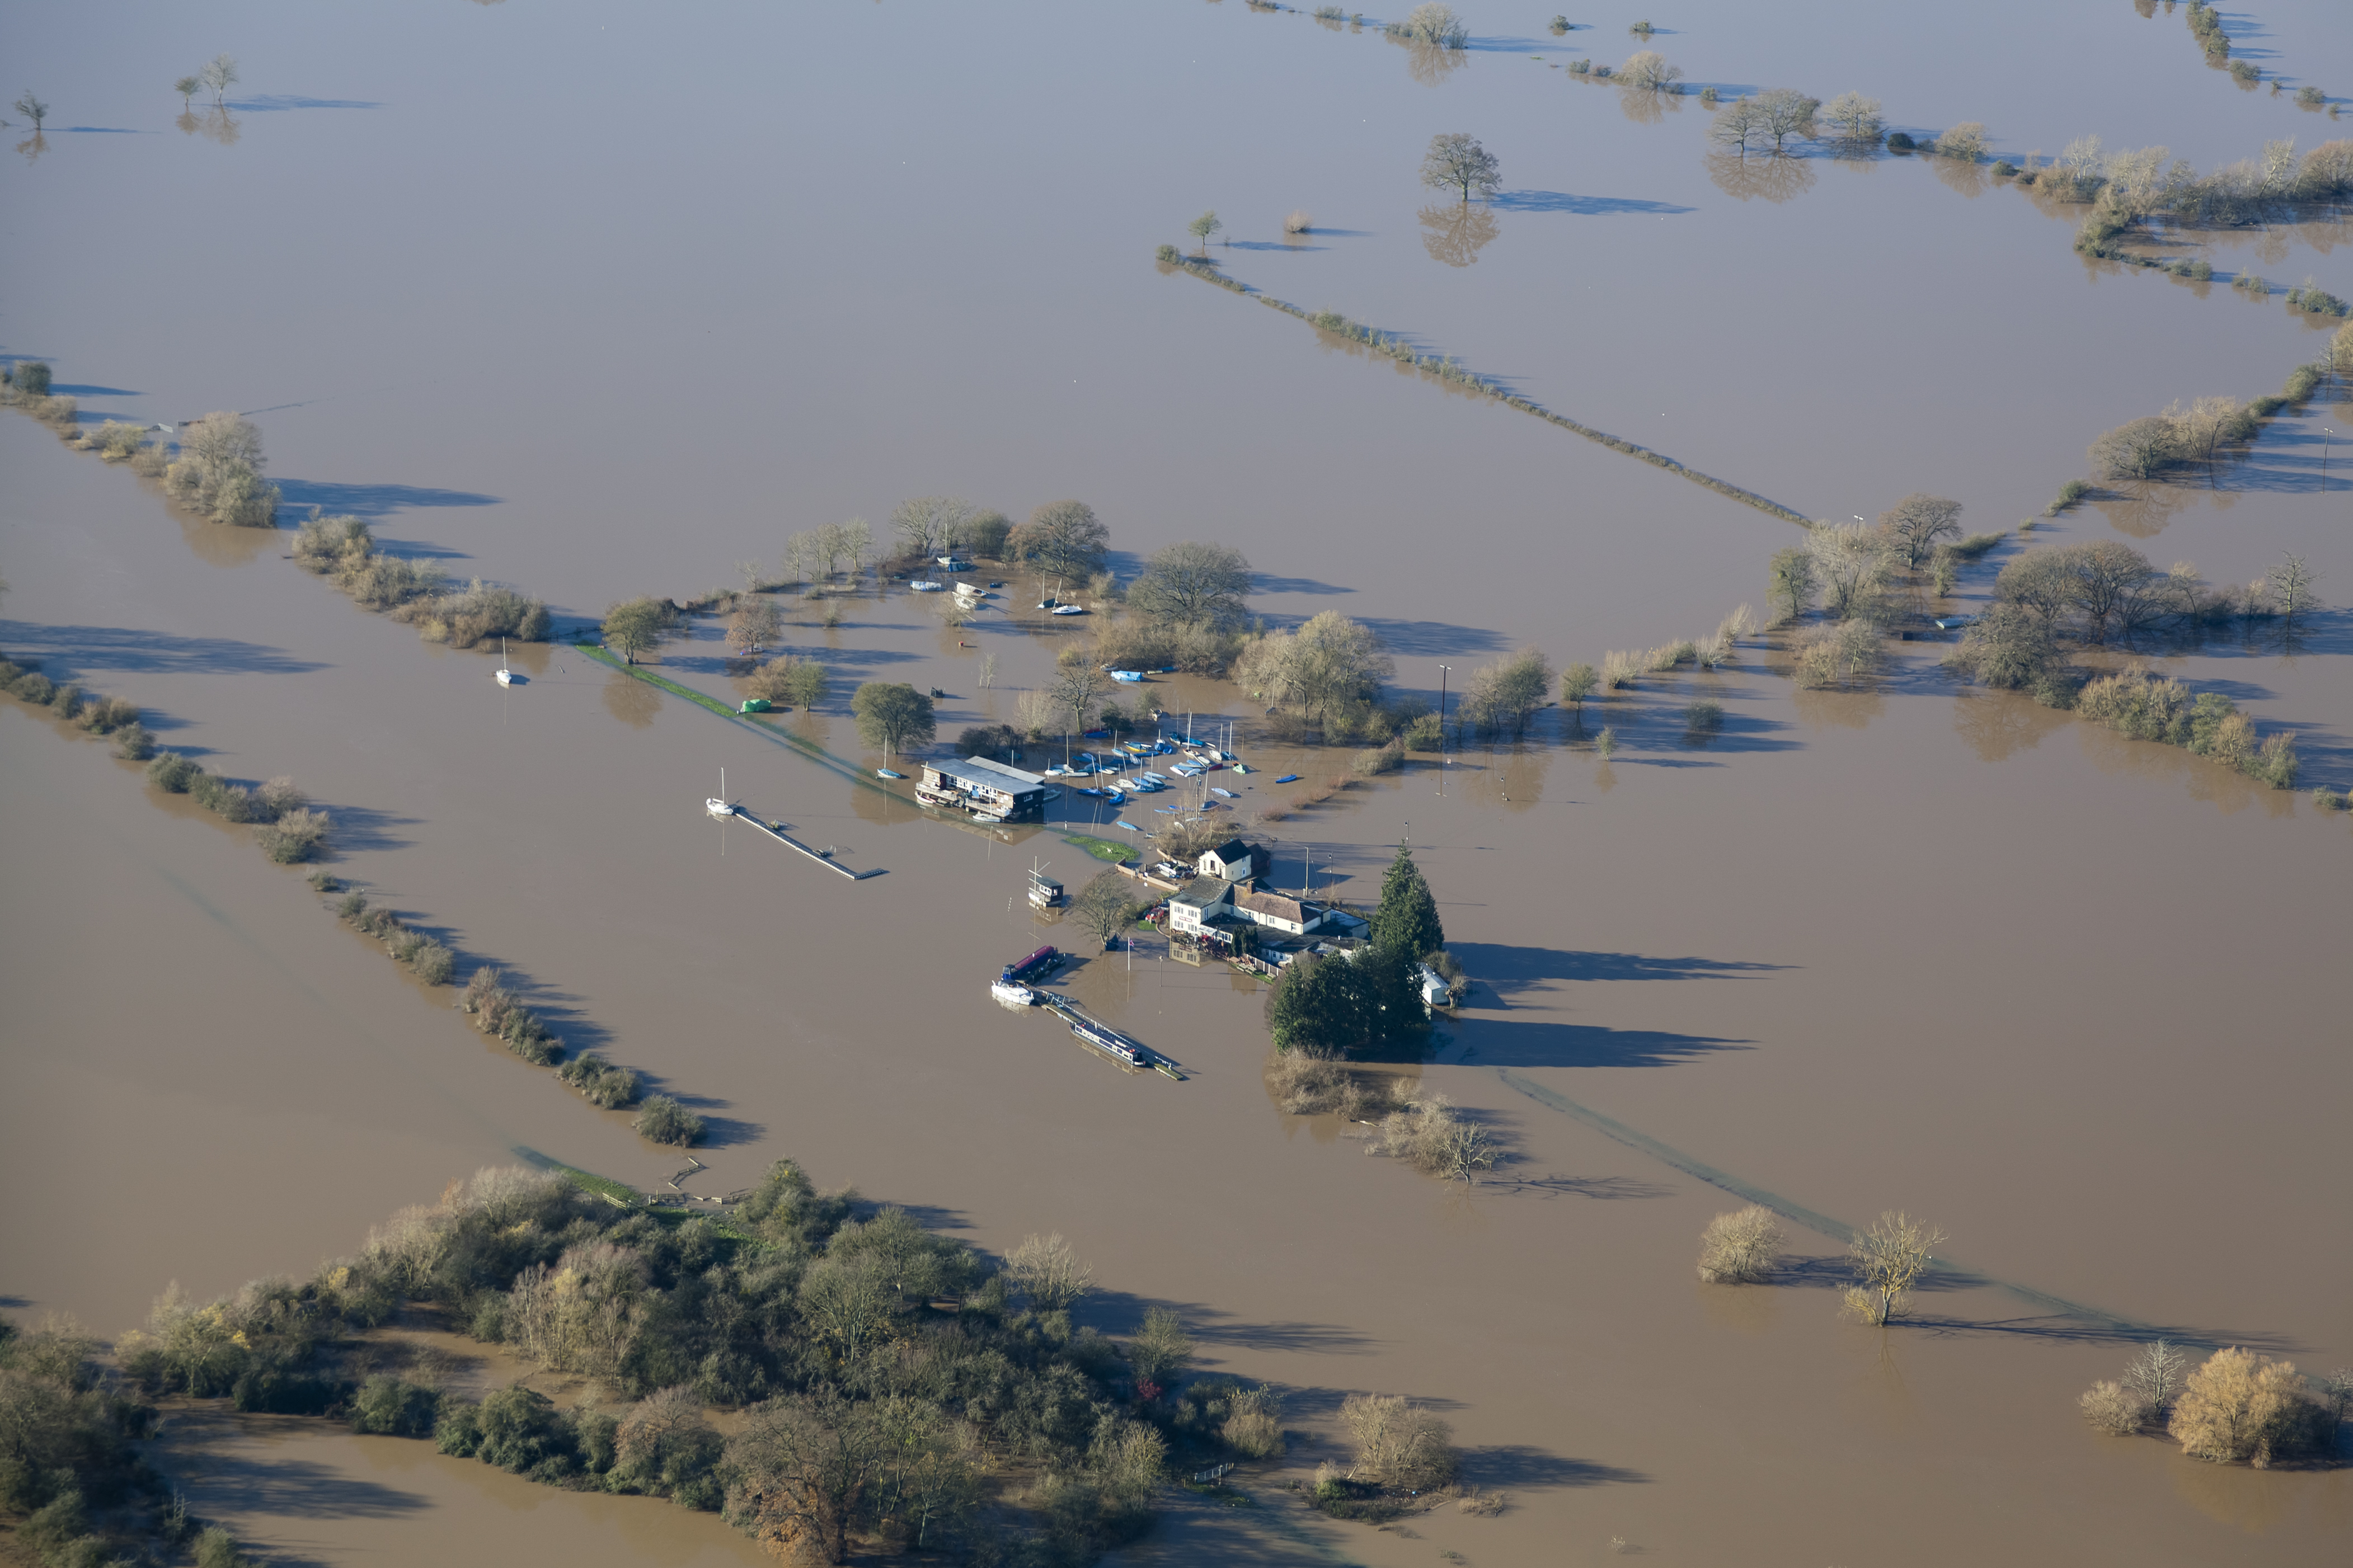
The Challenge
In May 2018, some areas of Birmingham and the West Midlands experienced over a month’s worth of rainfall in one hour. This was not an isolated event. As a result of climate change, extreme weather conditions are becoming more frequent and more intense, and the nation’s drainage systems need to adapt to cope.
The requirement for new housing to accommodate population growth is set to add even more water to the current systems, as well as the surface run-off from this new infrastructure. Ambitious Water Quality requirements for England’s rivers mean that wastewater will need to be treated to a higher standard. Customers and stakeholders also expect continuous improvement in the level of services that Severn Trent provides.
Responsibility for managing such intense rainfall events and surface run-off is split across several organisations, with Lead Local Flood Authorities responsible for water above ground, the Environment Agency responsible for main river flooding and the sewerage companies responsible for the rainfall which overloads wastewater capacity. All risk management and environmental organisations therefore need to look at collaborative ways to improve the development of catchment strategies and plans such as the DWMP.
Previously, Severn Trent would invite organisations and stakeholders across all areas of its wastewater network to attend a series of in-person, interactive workshops. The advent of COVID-19 lockdown restrictions meant that these meetings were no longer possible. What Severn Trent needed was a means to engage with its stakeholders in a socially distanced fashion, where they could provide their input in a structured way.
“Setting up the DWMP Engagement Platform with ArcGIS Hub has been great. It’s intuitive to work with and easy to set-up, visually engaging and easy to access. We can now get everyone in a room, digitally”
Jack Robinson, Strategic Catchment Planner, Severn Trent Water
The Solution
In an industry first, Severn Trent has developed the DWMP Stakeholder Engagement Hub, a multiple-party engagement platform. A seamless extension of its own in-house GIS system, the DWMP Stakeholder Engagement Hub is based on ArcGIS Online and ArcGIS Hub Premium, digitising the previous face-to-face approach.
The company has been a long-standing customer of Esri since 2007 and this latest advancement came about from discussions with Esri around the specific requirements of the DWMP, and how the business could present it to its stakeholders, engage with them and solicit their feedback before considering strategic options.
All or most of the data needing to be embedded in the DWMP already existed on premise or on GISSTOnline, Severn Trent’s ArcGIS Online platform. The team simply needed to configure the data into presentable information products, ie maps, dashboards and surveys, and embed it into their DWMP Hub initiative.
The Hub enables Severn Trent to engage with local stakeholders in a socially distanced fashion. Engagement with stakeholders is done in a very structured way and it has direct control over how stakeholders can access the DWMP information and how stakeholders can submit their input. The data presented in the Hub comes directly from the company’s core systems on top of the common geography, and the feedback comes in pre-defined forms which makes follow-up modelling much easier. Users simply log into the Hub and can make their input in as little as ten minutes.
Severn Trent was aware that other organisations are facing constant resource challenges which had been exacerbated by the ongoing pandemic and so wanted to ensure the Hub was simple to use, with flexibility to allow stakeholders to access the Hub at a time to suit their busy work schedule.
The uptake has already been significant, seen as an important marker of success, given there is no statutory obligation for stakeholders to respond. The first consultation was shared with over 200 stakeholders with an uptake of almost 50 per cent, an unprecedented figure. Previously, no more than 25 per cent of stakeholders would have attended a face-to-face meeting, meaning the company now has twice as much data from initiating this digital approach, which will ultimately enable Severn Trent to identify the most impactful options across all types of drainage.
“If we can work with organisations more collaboratively to identify how to solve possible flooding issues, then we can potentially solve other problems. Digitising the process with ArcGIS Hub has not only made this possible but has many other crossovers that it could lend itself for in the future.”
Paul Hurcombe, Strategic Asset Manager, Severn Trent Water
Benefits
Speedy set up
The DWMP Hub was quick to set up, as all or most of the data already existed in the company’s ArcGIS Online account. The data was easily configured into visually engaging maps and dashboards, its UI design being acknowledged as a key element in the Hub’s success.
Digitising data collection
Severn Trent has exact control over how stakeholders can access the DWMP Hub empowering feedback in a more structured way. Stakeholders can submit their feedback digitally, rather than having to travel to and attend meetings out of the office. Since inception, responses have more than doubled.
Sharing of Information
With feedback coming through in predefined forms, follow-up modelling by the Severn Trent team is much quicker. This content can then be presented as the Drainage and Wastewater Management Plan and published out to stakeholders and other parties including Ofwat. It is Severn Trent’s intention that this Hub platform will ultimately be used to share the findings of the DWMP process, with the draft being published for consultation in Summer 2022.
Collaborative approach
Bringing together invested stakeholders digitally and identifying ways in which to solve flooding and wastewater issues, drives participation and engagement. Presenting information via charts and maps makes it easier for everyone to have a shared understanding of the goal, which can pave the way to action and potentially solving other problems.
Natural Resources Wales
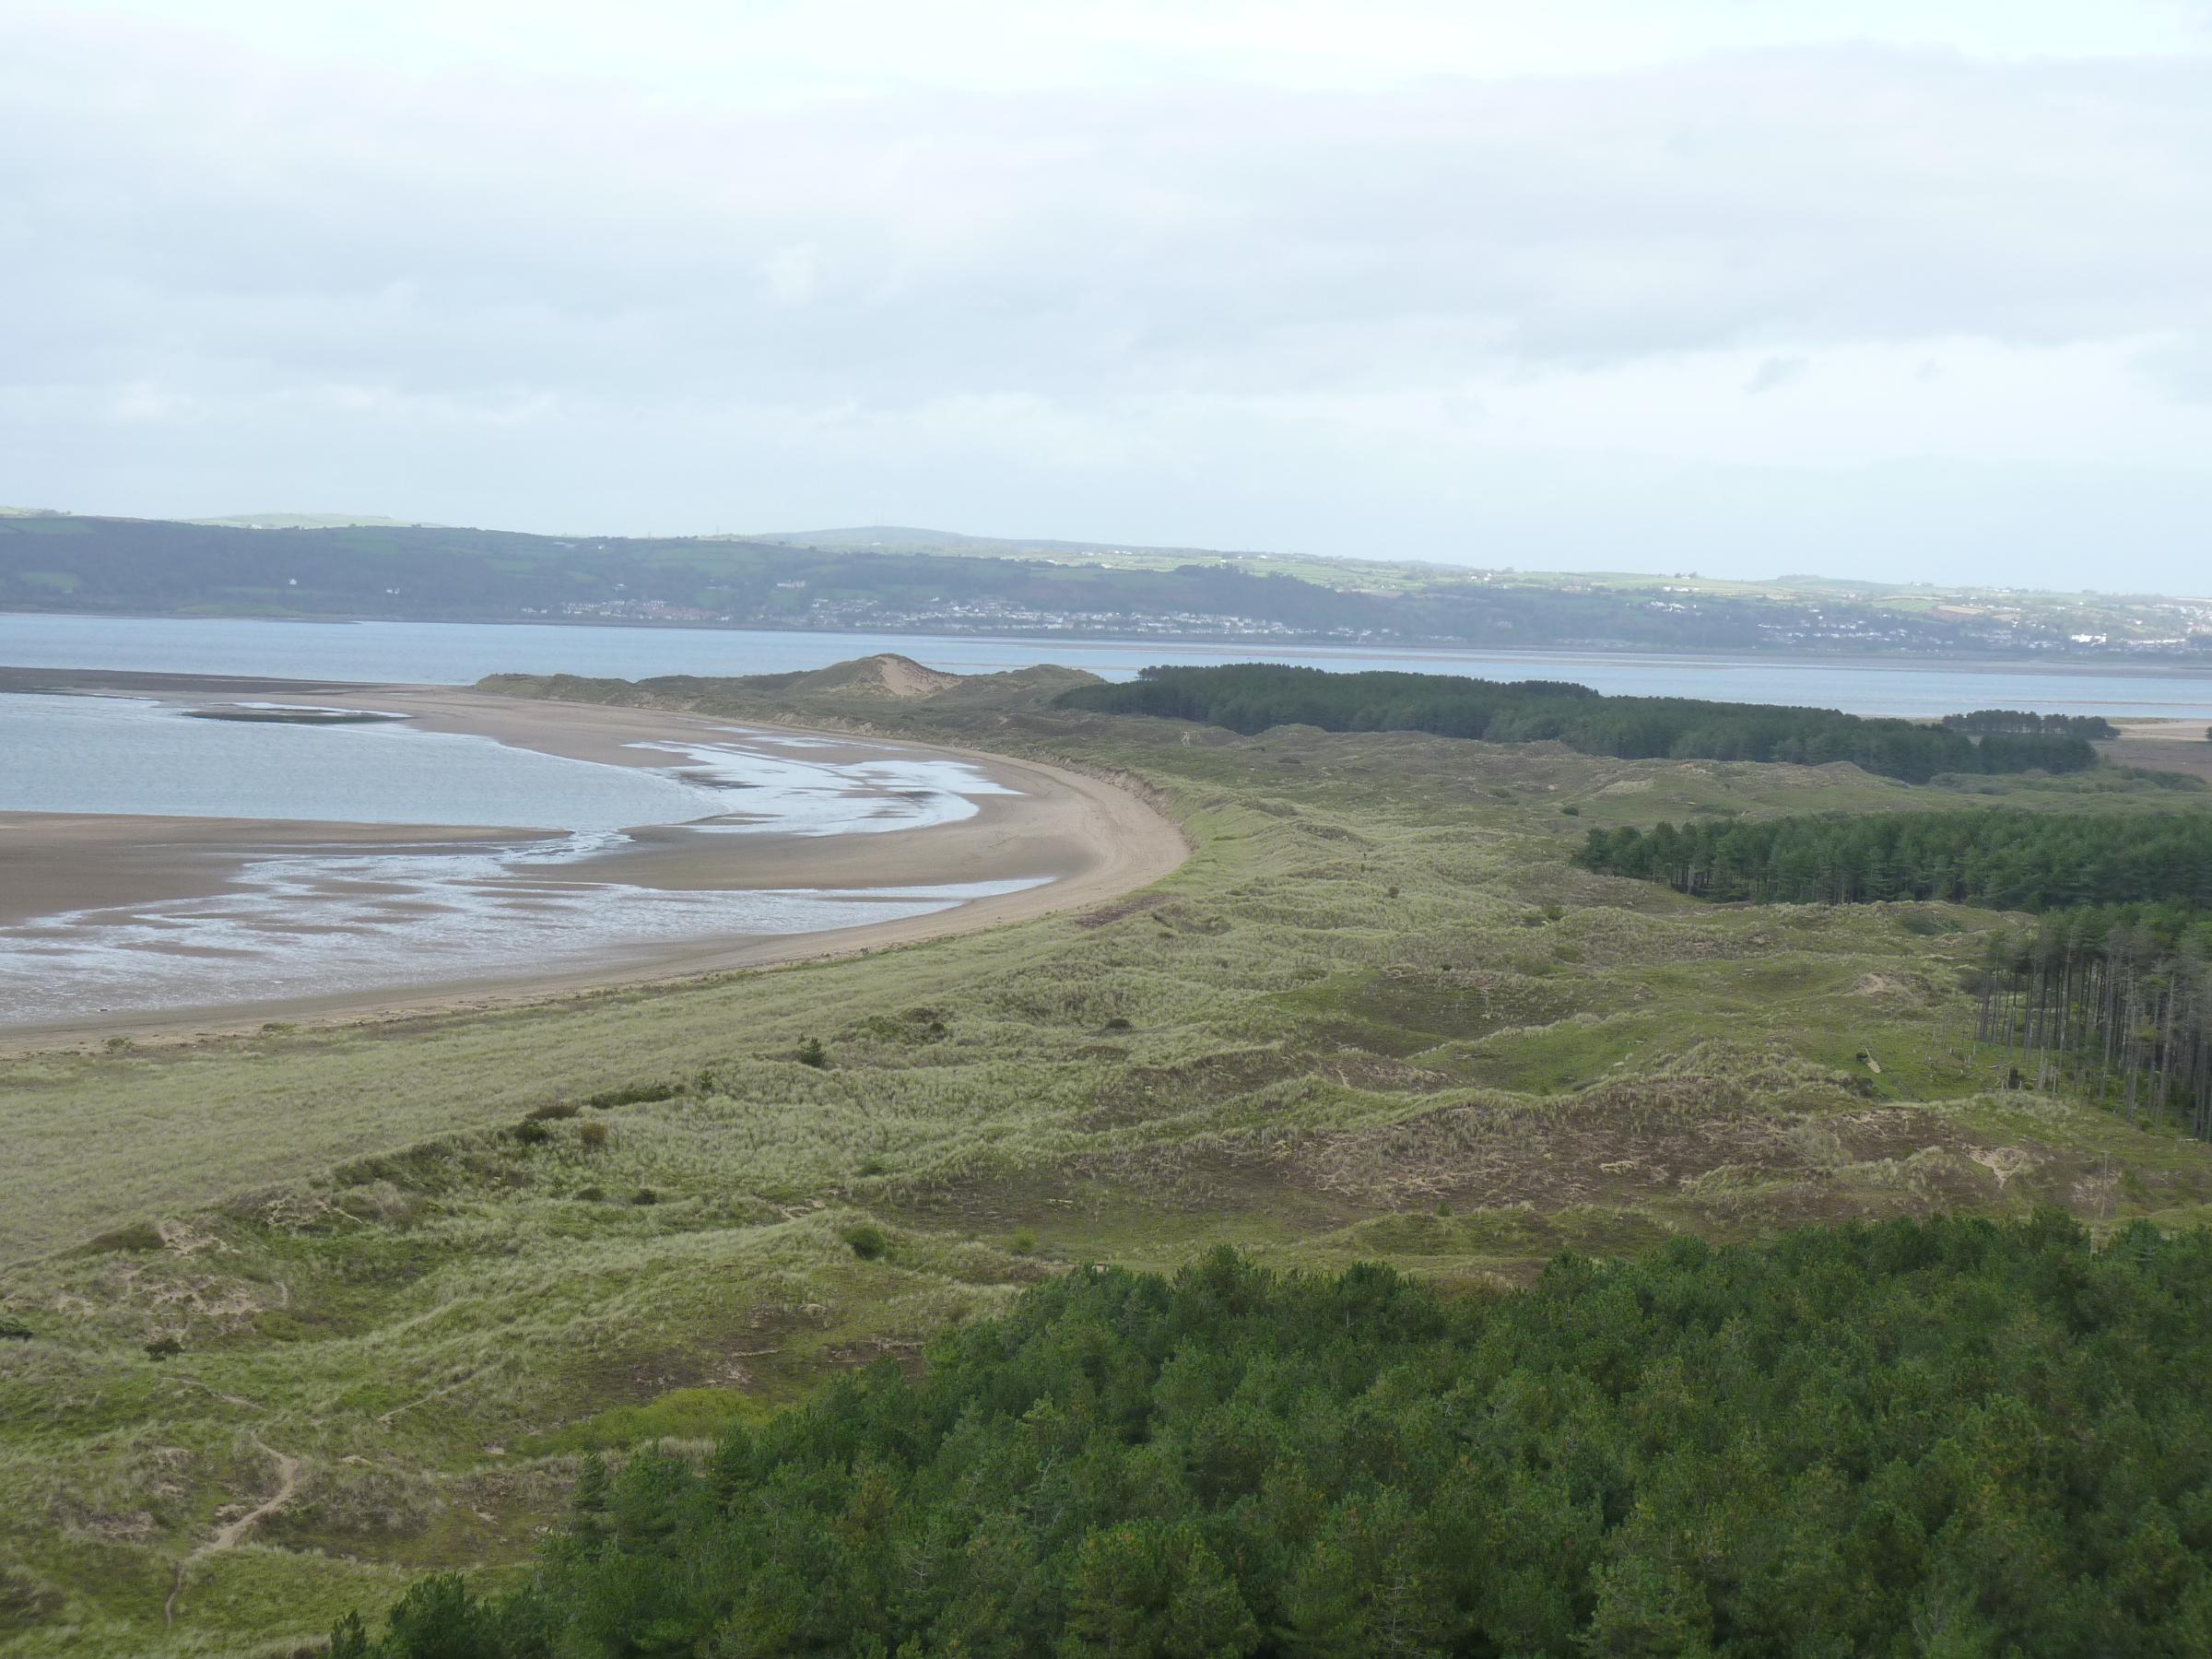
We can now capture detailed, accurate data with drones and analyse it to better monitor environmental changes and improve the sustainable management of Wales’ natural resources.
Many of the most picturesque and precious natural environments in Wales are vast in size, hard to reach and therefore incredibly difficult to survey. To enable accurate evidence about environmental changes and conservation projects to be collected cost-effectively and quickly at these remote locations, Natural Resources Wales now uses ArcGIS Drone2Map.
Drone2Map simplifies the processing of drone images and creates a single orthomosaic aerial image
Employees use ArcGIS web apps to view and analyse orthomosaic images at their desks and in the field
New insight into environmental changes and issues is shared internally and externally in ArcGIS Story Maps
The Challenge
Natural Resources Wales is responsible for ensuring that the environment and natural resources of Wales are maintained, protected and used in a sustainable way. One of the organisation’s key roles is to gather and share evidence about the environment, which can then be used to inform vitally important decisions about conservation projects, land management and government policy.
Capturing this evidence is, however, not always easy. Some mountainous and coastal areas of Wales are very hard to reach, while others are so vast that they are too big to survey on the ground using traditional methods. Natural Resources Wales wanted be able to capture evidence efficiently at these large, remote sites, as well as find a more effective way to monitor environmental changes over time.
“Drone2Map enables us to gain high quality evidence about a wide range of different environments, very quickly, which leads to better management of natural resources.”
Adam Burke, Lead Specialist Advisor, Geospatial, Natural Resources Wales
The Solution
Fortunately for Natural Resources Wales, a cost-effective solution was at hand. The organisation already had a number of drones and Civil Aviation Authority (CAA) approved drone pilots, who previously had just taken imagery for promotional materials. It also had access to Esri’s ArcGIS Drone2Map solution, through its ArcGIS Enterprise license, and over eight years’ experience of using ArcGIS solutions. “It made sense to make better use of the skilled resources, equipment and software that we already had,” says Adam Burke, Lead Specialist Advisor, Geospatial, at Natural Resources Wales.
Following a successful pilot at Whiteford Bay, Natural Resources Wales now makes extensive use of drones to capture evidence at coastal and upland sites right across Wales. Drone2Map enables Natural Resources Wales to stitch its drone-captured pictures together, very quickly and precisely, creating an orthomosaic image of vast landscapes. The organisation can then easily analyse the data captured in the orthomosaic image, along with base mapping and other data, using ArcGIS Pro and ArcGIS Online, to monitor change and gain fresh insight into environmental issues.
The tight integration of Drone2Map with other ArcGIS solutions also makes it very easy for Natural Resources Wales to make its newly-captured environmental evidence available both internally and externally. For example, the organisation uses ArcGIS Online to create Story Maps that embed drone-captured images, enabling it to engage with the public in a new way. It also creates ArcGIS web apps that provide employees with simple tools for analysing and exploring orthomosaic images, from their desks or on mobile devices while in the field.
“We could respond quickly to the storm damage, because we had rapid access to the most accurate, up-to-date imagery of the environment.”
Adam Burke, Lead Specialist Advisor, Geospatial, Natural Resources Wales
Benefits
Well-informed decisions about managing natural resources
Through its use of Drone2Map, Natural Resources Wales has been able to introduce a brand new method of gathering reliable evidence that can be used to inform environmental decisions. Drone2Map is, for example, now playing a key role in Wales’ first national peatland action programme, where it is being used to gather data about upland peat bogs that are hard to reach on foot. New evidence about erosion and drainage is being amassed that will help to inform sustainable management and restoration plans for blanket and lowland peats. Burke says, “Drone2Map enables us to gain high quality evidence about a wide range of different environments, very quickly, which leads to better management of natural resources.”
Enhanced understanding of changes in the environment
Natural Resources Wales gains significant benefits from being able to capture drone footage of the same site at regular intervals and then analyse the data to detect and better understand changes in the environment over time. This is particularly important for the Sands of Life project, a £4 million conservation scheme to restore sand dunes that are constantly shifting due to the movement of the wind and tides. Drones can be used to survey hundreds of hectares of dunes on a regular basis, helping environmentalists to identify which dunes are retreating fastest and where best to introduce intervention measures such as fences and trenches.
Rapid responses to environmental events
If something unexpected occurs, Natural Resources Wales can now use its drones and Drone2Map to collect data about the incident very quickly, rather than having to engage an external contractor to complete a drone survey and wait weeks for the report. When storms caused unexpected erosion at Whiteford, the organisation used Drone2Map to see how much had been lost on the frontal dunes.” “We could respond quickly to the storm damage, because we had rapid access to the most accurate, up-to-date imagery of the environment,” says Burke. “When the conditions are right, we can achieve near real-time data capture.”
Cost efficient monitoring of intervention programmes
Because the new method of collecting evidence is highly cost efficient, it can be used in a broad range of projects, including monitoring the success of intervention programmes. At Pontarddulais near Swansea, Drone2Map has been used to help Natural Resources Wales monitor the construction of a flood storage reservoir and the installation of new habitats, including a wetlands area, over 3000 trees and shrubs, a pond and improved grassland. The organisation will continue to use Drone2Map at this site to monitor the ongoing development of the new natural environment and measure the success of the scheme in improving biodiversity, while reducing flood risks.

42 Engineer Regiment
At a time of national emergency, 42 Engineer Regiment used GIS to help the Government make critical decisions
Throughout the coronavirus pandemic, 42 Engineer Regiment (Geographic) provided a single source of trusted data about all aspects of the national healthcare crisis, as well as specialist geospatial data analysis services. In fulfilling this role the Regiment helped the Government, local authorities and healthcare organisations to make the best possible decisions to protect the NHS and save lives.
Planners at multiple agencies and organisations collaborate using a common web-based GIS data viewer
Military teams survey potential sites for NHS Nightingale Hospitals and COVID-19 test centres using a mobile GIS app
Geospatial experts and novices alike undertake data analysis and create maps for public communications
The Challenge
When COVID-19 reached the UK in early 2020, there was a pressing need for shared data to inform critical decisions. 42 Engineer Regiment (Geographic) was therefore deployed to provide policy makers with a Common Operating Picture (COP) of the rapidly evolving healthcare emergency.
Over a thousand people were involved in planning the UK’s response to the pandemic – from the Cabinet Office and national government, healthcare agencies, local authorities, the police and military. 42 Engineer Regiment needed to provide a platform for sharing a single, trusted version of the truth across all these agencies. It also had to be able to analyse this vast reservoir of data, to help the Government make the best possible decisions, including where to set up NHS Nightingale Hospitals and COVID-19 testing centres.
“The online GIS platform helped lots of different organisations to work together to make the big decisions about how the UK responded to the pandemic.”
Captain Luke Parker, Strategic Command
The Solution
Building on its experience of using geospatial information system (GIS) technology in humanitarian efforts, 42 Engineer Regiment created a secure, web-based data viewer using Esri’s ArcGIS Online solution. The skilled team of geospatial analysts identified key data sets to share via the viewer and liaised with numerous organisations to unblock access to additional data, previously not available in the public domain.
Using this invaluable resource, 42 Engineer Regiment then began undertaking a vast amount of multi-criteria decision analysis (MCDA) to give Government policy makers the information they urgently needed to help them make decisions. In particular, the Regiment identified potential sites for COVID-19 testing centres, taking into account local population figures, car parking, transportation access, the size of the site and distance from residential areas. It also evaluated the optimal locations for NHS Nightingale Hospitals, how best to evacuate COVID-19 patients from remote areas such as the Outer Hebrides and how to move mobile testing teams around the country as quickly as possible.
In tandem, the Regiment used Esri’s mobile survey solution, Survey123 for ArcGIS, to enable accurate, consistent data to be rapidly collected in the field. Military Assessment Teams (MATs), comprising engineers, medics and logistics experts, used the app when visiting potential sites for Nightingale Hospitals to collect information on everything from potential bed capacity to the feasibility of laying oxygen pipes. All the data was uploaded immediately and automatically from the field to the central viewer, giving planners instant access to the information they needed to make rapid decisions about whether or not to use this site.
42 Engineer Regiment also provided vital geospatial analysis support to the Joint Biosecurity Centre and used Esri’s ArcGIS Pro to produce maps showing regional variations in COVID-19 cases and deaths. These maps were used in national COVID-19 briefings and pioneered the use of a colour palate that was suitable for people with colour blindness.
“Using a mobile GIS app for data collection was an effective way for us to confirm the situation on the ground and share this information rapidly.”
Sergeant Scott Vickery, 42 Engineer Regiment
Benefits
Effective multi-agency collaboration
42 Engineer Regiment succeeded in creating the UK military’s first ever national data platform for sharing real-time, on-demand situational awareness and analysis across multiple agencies. Used by over 1,000 people from the Cabinet Office, local and national government, police, fire service and military, the data viewer improved collaboration and created a single source of data that everyone could trust during the national emergency. According to Captain Luke Parker, a geospatial intelligence expert from Strategic Command, “The online GIS platform helped lots of different organisations to work together to make the big decisions about how the UK responded to the pandemic.”
Well-informed, objective decision making
The multi-criteria decision analysis (MCDA) that 42 Engineer Regiment was able to carry out proved critical to the process of shortlisting the most viable and appropriate sites for NHS Nightingale Hospitals and COVID-19 test centres. The Regiment’s geospatial analysts were able to accurately pinpoint the locations that would serve the largest proportion of the population, with the required transport access and resources. “Our approach enabled us to provide a data-driven and auditable way of picking the best sites for NHS Nightingale Hospitals and COVID-19 testing centres, based on an objective assessment of the location, facilities and potential of each site,” Captain Parker says.
Rapid data collection in the field
The use of a mobile data collection app significantly sped up the process of verifying the suitability of shortlisted locations for NHS Nightingale Hospitals and COVID-19 testing centres, as well as potential overflow morgues. Data collected in the field was instantly visible to everyone, across all agencies involved, within minutes. This speed supported faster decision making and enabled the construction of hospitals to commence with utmost haste, at a time when COVID-19 cases were rising at an exceptional rate. “Using a mobile GIS app for data collection was an effective way for us to confirm the situation on the ground and share this information rapidly,” says Staff Sergeant Scott Vickery, 42 Engineer Regiment.
Accurate information for government communications
Trusted by Government, the data viewer was used to produce a wide range of maps for communicating with the general public. Many of the analysis maps created by 42 Engineer Regiment were shared in the media and used on television as part of local and national briefings. 42 Engineer Regiment was, for example, able to conduct research and identify that 96% of the UK population are within 10 miles of a vaccine site. This information was shared by the Government, reassuring people that they would be able to access a vaccine, when they become eligible.
Arcadis
In a ground-breaking project, Arcadis has used solutions from Esri’s ArcGIS to collaborate effectively with its client and deliver a new way of working.
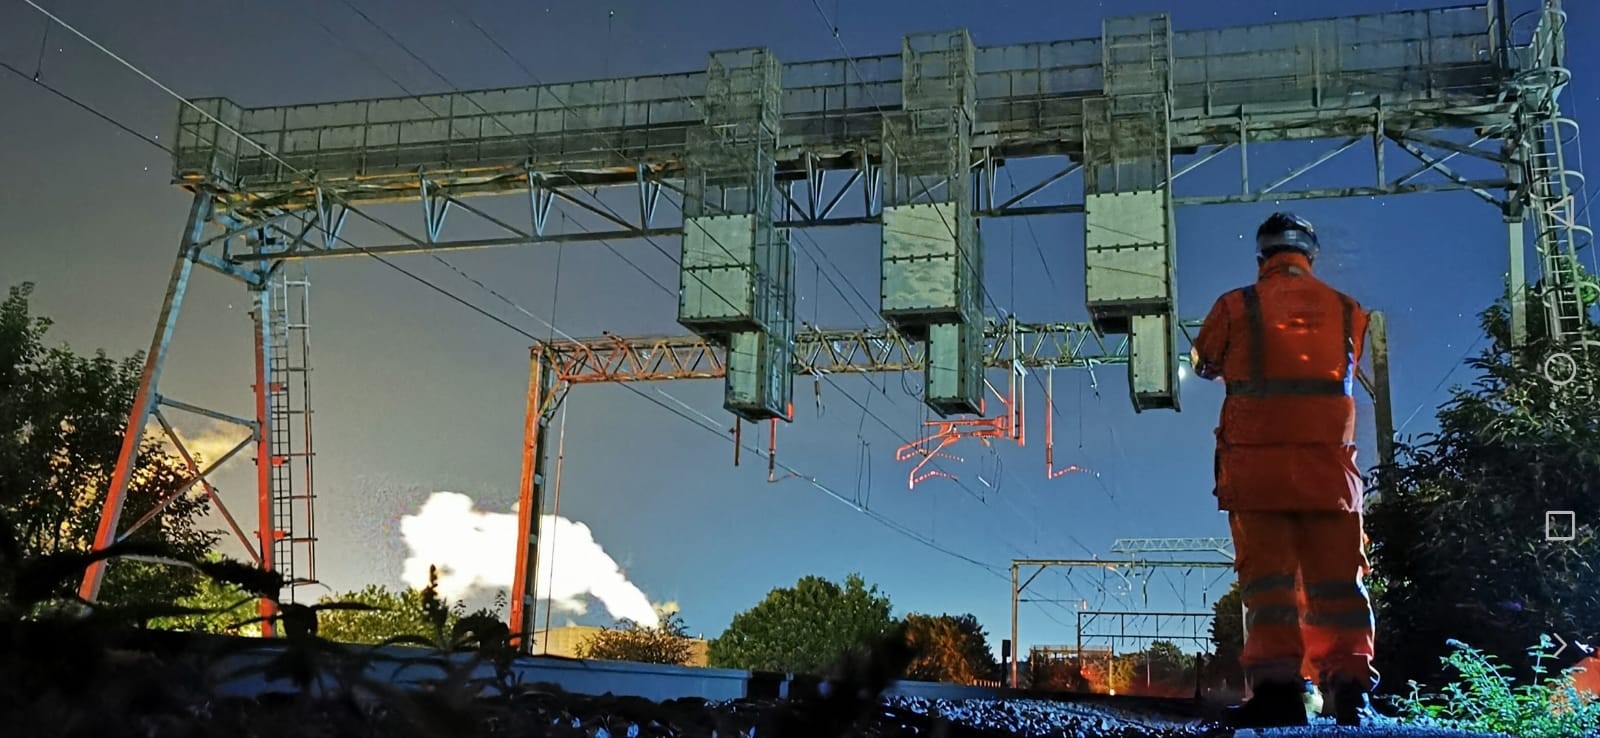
In a ground-breaking project, Arcadis has used solutions from Esri’s ArcGIS to collaborate effectively with its client and deliver a new way of working. Accurate data captured efficiently in a live rail environment is shared with the client in real-time and integrated with BIM in one seamless, automated digital workflow.
Around 50,000 electrical assets along a 400-mile network are being surveyed in the field using ArcGIS Survey123
Survey progress and key performance indicators are monitored by the project manager and client, in real-time, using ArcGIS Dashboards
All project documentation, dashboards and data are shared securely by employees from three organisations using ArcGIS HUB
The Challenge
A leading global design and consultancy firm, Arcadis is used to managing and delivering very large, complex projects. However, when it was approached by a major rail industry client and engaged to survey 400 miles of railway lines in the UK, it realised that it needed to create a new digital way of working. As part of the project, Arcadis had to capture extensive data about up to 50,000 electrical assets, ensure safe working within a live rail environment and deliver an accurate building information modelling (BIM) masterplan to support the operation and maintenance of the electrified infrastructure across the regional rail network.
“Right from the beginning, we established a vision combining our GIS, engineering and BIM expertise to transform the way we undertake these projects and deliver an efficient, high quality service for our client.”
Gideon Simons, Principal GIS and Geospatial Consultant, Arcadis
The Solution
Arcadis had been using a suite of desktop, web-based and mobile solutions from Esri’s ArcGIS for many years and instantly recognised the key role that GIS could play in the rail project. “Right from the beginning, we established a vision combining our GIS, engineering and BIM expertise to transform the way we undertake these projects and deliver an efficient, high quality service for our client,” says Gideon Simons, Principal GIS and Geospatial Consultant at Arcadis.
In the new digital workflow that Arcadis subsequently developed, engineers use ArcGIS Survey123 to capture accurate, geo-located data in the field about electrical assets, their condition and compliance with standards. Survey123 draws on high-end GPS data from EOS Arrows to ensure sub-metre accuracy for the locations of assets in the field.
In addition, Survey123 integrates with Microsoft Power Automate, allowing alerts and emails to be sent automatically from the field. If engineers observe a safety issue, such as an exposed wire, they can generate a real-time alert from within Survey123, which is sent directly to the Health & Safety Manager. The data collected with Survey123 is automatically backed up and automatically generates regular reports.
Arcadis uses a range of ArcGIS Dashboards to provide real-time visibility of the project. One provides an overview of the survey progress for the Project Manager, allowing them to effectively monitor the contractor’s time on site, track survey progress and drill down into records to see emerging health & safety issues. Another dashboard allows Arcadis to share real-time data with the client and the contractor, with highlighted metrics linked to key performance indicators (KPIs) for the project.
Meanwhile, engineers at Arcadis use a specially-developed ArcGIS web app to view and quality assure all the data collected in the field. This GIS data is automatically converted into BIM format, to client standards, and transferred into the BIM model, with no manual intervention at all, using interoperability software (Safe Software FME).
The last ArcGIS component in the digital workflow is ArcGIS HUB which enables Arcadis, the contractor and the client to securely share information via a project delivery website. ArcGIS HUB effectively provides a secure portal to all documentation, dashboards, plans and other resources relating to the project, creating a seamless, shared experience for everyone involved in the project, from three organisations.
“By using a data centric approach across GIS and BIM, we can provide our client with a more cost effective method of planning future works on the rail network to improve the performance of the railway and the passenger experience.”
Gideon Simons, Principal GIS and Geospatial Consultant, Arcadis
Benefits
Efficient delivery of a large survey project
Arcadis has been able to use multiple solutions from ArcGIS to create a seamless, end-to-end digital workflow for managing the survey project for its client, improving efficiency. In the first six months alone, Arcadis successfully surveyed over 9,000 assets across 130 miles. The use of the mobile ArcGIS solution delivered a 10% time saving in asset data capture on site, while the seamless digital workflow improved project management efficiencies by up to 150%. The automated flow of data has also halved the effort from the design team to produce the final deliverables for the client.
Successful collaboration with client and contractor
Together, the use of ArcGIS HUB and the ArcGIS Dashboards have helped Arcadis to collaborate successfully with the client and contractor. Everyone has real-time access to the same information, and the client can monitor Arcadis’ performance against KPIs at a glance, on demand. “The dashboard is also very useful in meetings,” explains Simons. “It promotes good discussions, makes our meetings more interactive and enables increased engagement with our client.”
Rapid response to health & safety concerns
Critically, the ArcGIS-driven digital workflow allows potential health & safety concerns to be highlighted and resolved more quickly, to reduce the risk to all rail staff and contractors working along the railway lines – now and in the future. If a potential hazard is observed – whether it relates to an electrical fault, fly tipping or damaged fences – it is logged to update the system in real time and indicate where immediate actions can be taken if deemed necessary by the client and contractors.
Resilience through digital transformation
The seamless flow of data from ArcGIS to the BIM ensures the quality of the BIM model and saves a huge amount of time for designers and engineers, by eliminating many manual data handling processes. “We call this resilience,” Simons says. “By using a data centric approach across GIS and BIM, we can provide our client with a more cost effective method of planning future works on the rail network to improve the performance of the railway and the passenger experience. This approach also provides the potential to leverage 4D (schedule), 5D (budget) and Digital Twins to enhance insight and ultimately effect a positive change in how rail work is carried out in the future."
Alcis
Using the Deep Learning tools in ArcGIS Pro, Alcis has trained a segmentation model capable of accurately identifying tent numbers in IDP camps, helping aid agencies to deliver aid more effectively.
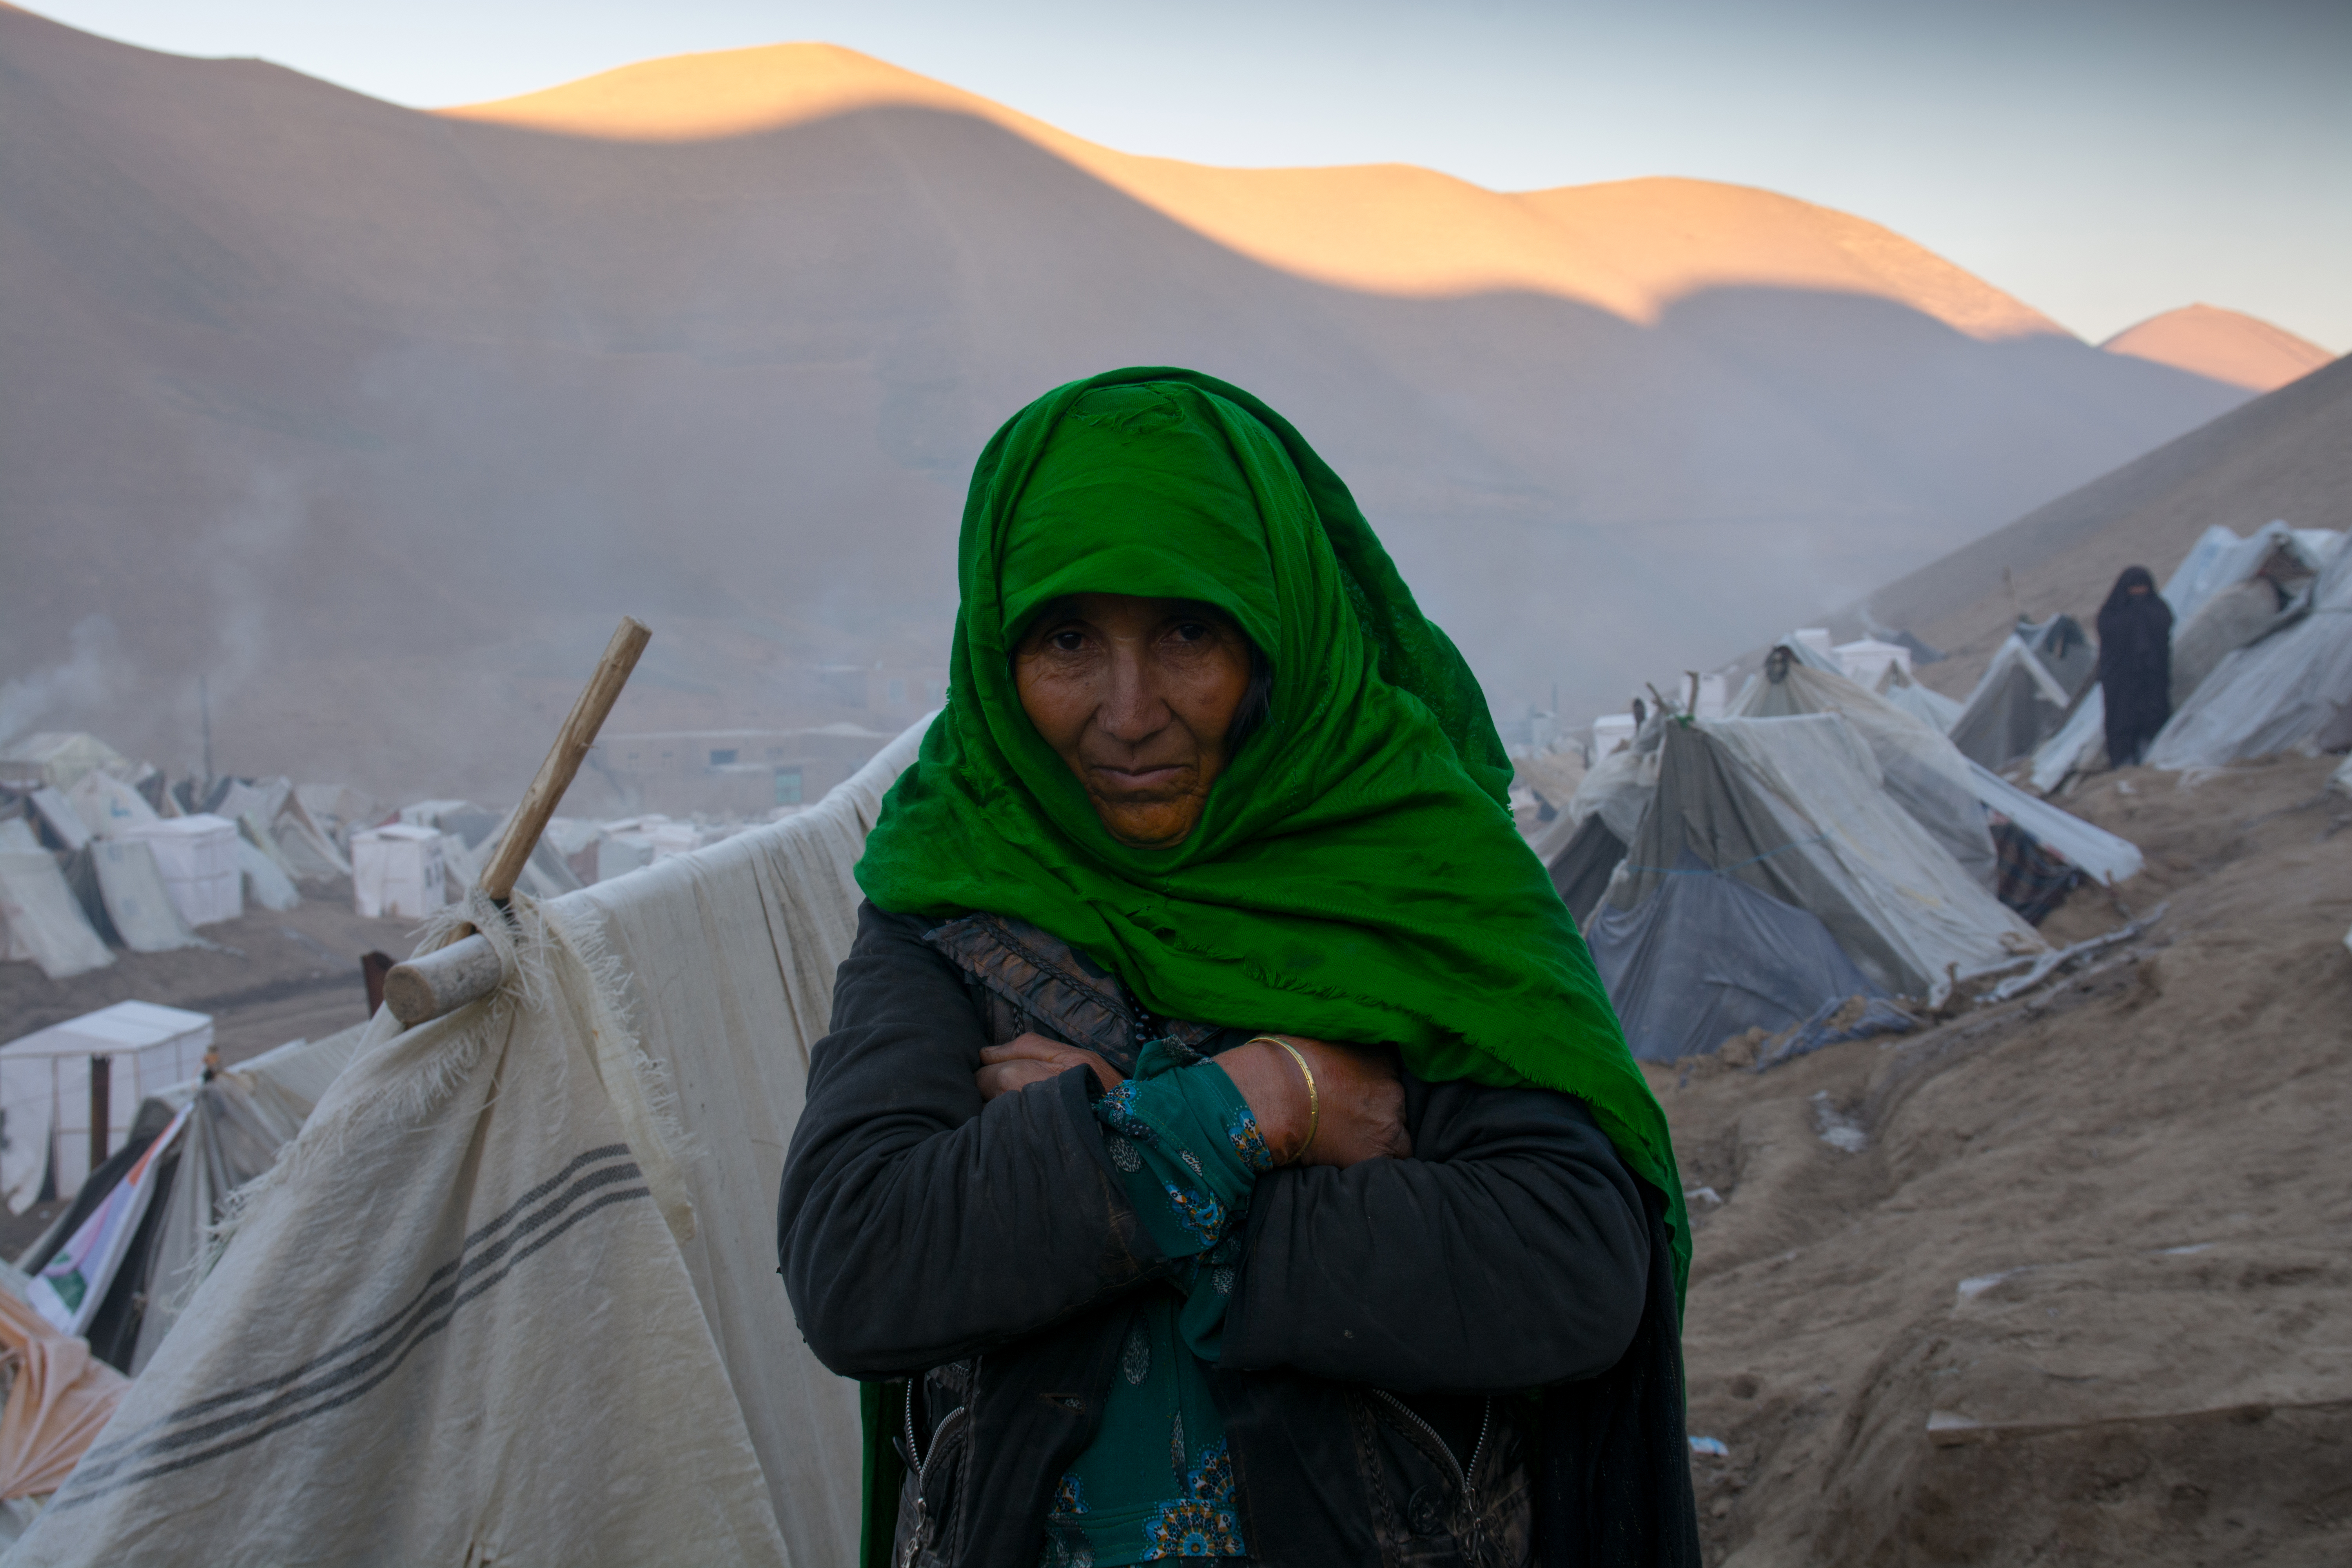
As the number of Internally Displaced People (IDPs) continues to increase, humanitarian aid organisations are looking for more effective ways to support the most vulnerable people in the world. In Afghanistan, the Norwegian Refugee Council (NRC) needed to find a better technique to analyse the number, flow and concentrations of humanitarian shelters. By integrating Deep Learning with ArcGIS, Alcis developed a tent-counting methodology to give the NRC the knowledge and insight required to make more informed decisions around the delivery of emergency aid to IDPs.
Powerful visualisations help decision makers make better decisions
Out-of-the-box advanced spatial analytics can be quickly deployed
Users deliver more accurate results, with greater ease and efficiency
The Challenge
In Afghanistan there are more than 2.5million Internally Displaced People (IDPs) who have been forced to flee their own homes, in their own country, because of conflict, violence, persecution, human rights violations as well as natural emergencies including drought. Many end up in tented camps, often in areas that are difficult for aid agencies to reach, with nothing to show but the clothes on their backs. For this reason, the UN describes IDPs as “amongst the most vulnerable in the world.”
Making assumptions based on data by counting tents, is one way of helping the humanitarian community to monitor the movement of IDPs and identify and deliver the help they need. But the rapid development of tented camps and the high rate of change within them makes manual counting inefficient.
The Norwegian Refugee Council (NRC) provides vital humanitarian aid across 31 countries. Initially, in Afghanistan, they did not have a clear view of the number of IPDs in tented camps. It therefore became imperative to find a more efficient methodology of counting tents and estimating IDP numbers, to help the NRC to deliver the timely and appropriate humanitarian support required.
“Esri tools and software help visualise data in such a compelling way, it’s easy for lay people to understand. There are no language barriers to 3D maps, and there’s no need to read through 500-page reports. Presenting data in such a captivating way simply drives more informed and timely decision-making.”
Alison Hall MBE, Charity Founder, Seeds for Development
The Solution
Alcis has worked in Afghanistan since 2004, using GIS and spatial analysis combined with satellite imagery to help aid organisations and NGOs, amongst others, to identify the most effective policies in order to implement appropriate programmes, that create lasting and positive outcomes in fragile and complex environments.
An initial project involved Alcis tracking monthly rainfall and looking at impacted agricultural areas and the greatest impact on the population, from the developing drought. The 2017 drought led to the displacement of more than 250,000 people who ended up in IDP camps. Given the lack of available data on the ground as to the distribution and volumes of IDPs in camps, NRC asked Alcis to help find a solution for tent counting.
Alcis recognised that using satellite imagery and GIS data could provide a better method than manual counting. Satellite data was acquired of selected sites, providing a clear picture of what was happening on the ground and a baseline from which to determine the optimal approach to counting the tents. This initial methodology, while enjoying some success, did not deliver the acceptable standard hoped for.
This led to a Deep Learning approach which utilised a heavily specialised Neural Network. In the absence of a pre-trained model, Alcis employed the Deep Learning tools within ArcGIS Pro to train an image segmentation model capable of identifying the unique signature of each tent outline.
The algorithm was run against satellite imagery achieving predictions circa 99%, with very few false positives. The corresponding results were converted into a feature layer so this could be overlaid onto imagery and visualised within a 3D scene.
“Using this Deep Learning approach with Esri ArcGIS software has helped people from multiple backgrounds, with multiple languages, to help make the best decisions to support the most vulnerable people in the world.”
Tim Buckley, Chief Operating Officer, Alcis
Benefits
Power of visualisation
Taking multiple, complex data sets and visualising them into 3D interactive apps appeals to even the most non-technical of individuals, quickly communicating the scale of a humanitarian aid emergency on the ground. Decision-makers can then make more insightful decisions based on identified IDP numbers, rather than from ad-hoc surveys in the field.
Out-of-the-box solution
The end-to-end Deep Learning workflow available in ArcGIS Pro 2.5 (onwards), gives users access to unrivalled geoprocessing tools, supported by richer visualisation capabilities including tables, images and charts. Extruding locations in 3D and attributing columns of different lengths to visually represent variability in the data, highlight critical findings such as the impact on local populations by drought.
Speed of delivery
ArcGIS Pro delivers much faster results, requiring minimal post-processing, and is considerably easier to use than a bespoke neural network without significantly reducing the accuracy of the results. It only takes a few lines of code to do the whole training, compared to numerous lines using the traditional workflow. There is no need to develop an app for exporting training datasets and no post processing such as Georeferencing is required.
Advanced analysis
Spatial analysis can now be undertaken at much higher levels using Deep Learning tools. For the NRC this meant, in one location, identifying 6,535 tents believed to be temporary homes for over 30,700 displaced people. This invaluable information helps provide the humanitarian aid needed on the ground, more quickly and efficiently, allowing the NRC to improve the lives of those who need help the most.

Forestry & Land Scotland
With ArcGIS we have delivered one of the Government’s first digital mapping services, replacing an outdated system with a user-friendly service that efficiently manages the marine planning and licensing service.
Forestry and Land Scotland is using ArcGIS to survey the condition of ash trees on its land and analyse the impact of the devastating Ash Dieback disease over time. The organisation can now clearly see where it needs to take action to limit the risk of falling trees and branches, which helps it to maintain the safety of people visiting, living and working in Scotland’s countryside.
Accurate, consistent data is collected by 60+ staff across all areas of Scotland using Survey123
The near real-time visibility of survey results allows rapid action to be taken to maintain public safety
Simple analysis graphs and reports created automatically in ArcGIS Online improve the management of risks
The Challenge
Ash trees are a familiar feature of Scotland’s landscape, forests and woodlands, but their survival is seriously threatened. A fungal disease commonly known as Ash Dieback (or ‘Chalara’) is spreading fast and could lead to the death of 70-85% of native ash trees over the next decade.
Responsible for the management of 640,000 hectares of national forest and land, Forestry and Land Scotland needed to establish how many ash trees are on the public estate and where they are in relation to paths, roads and properties. Most importantly, it needed a way to monitor the condition and gradual deterioration of ash trees, so that it could take action to reduce the risk of diseased branches and dead trees falling and causing injuries or deaths, while at the same time trying to retain as many ash trees as possible in safer locations because of their high biodiversity value.
“Completed tree surveys are visible back in the office in near real-time, so we can build up an immediate picture of the risks to public safety from diseased trees, locally, regionally and nationally.”
Shona Sutherland, GIS Support Officer, Forestry and Land Scotland
The Solution
Having used solutions from Esri’s ArcGIS platform previously for other initiatives, Forestry and Land Scotland realised that it could implement an effective survey process for ash trees using Esri’s ArcGIS Survey123. It created its survey solution iteratively in just two weeks in a project involving a small number of users working directly with a GIS developer.
The mobile Ash Dieback survey solution created allows users to record data about ash trees on their mobile phones, while out and about in the countryside and woodlands. The app has a series of dropdown boxes, tree images and tick lists, which make it as easy as possible for users to input accurate, consistent data in the field. All the data collected is uploaded immediately, if the user has Internet access, or stored and uploaded as soon as an Internet connection is found, if the user is working in a particularly remote location.
The data collected is then analysed in a range of ready-made Esri dashboards containing graphs and charts in ArcGIS Online that enable Forestry and Land Scotland to easily see and monitor trends. For example, trees that are in a serious condition are highlighted in red. These ArcGIS Online analysis charts and graphs are used in meetings and reports for senior managers, to explain trends and clarify the scale of the Ash Dieback issue. Finally, Forestry and Land Scotland incorporates its Ash Dieback survey data into its central ArcGIS platform, called Forester Web, so all 800 employees can view it, on demand.
“ArcGIS provides the clear insight we need to make informed decisions about how best to tackle Ash Dieback and plan the level of investment that will be needed in the future to manage diseased trees and maintain public safety.”
Alan Gale, Climate Change Adaptation Programme Manager at Forestry and Land Scotland
Benefits
Clear understanding of Ash Dieback risks
The ArcGIS survey process provides Forestry and Land Scotland with detailed, accurate information about Ash Dieback risks that can easily inform its Risk Register. Significantly, the use of ArcGIS Online will enable Forestry and Land Scotland to monitor the change of condition in specific trees over time and therefore gain an improved understanding of how fast trees with Ash Dieback deteriorate. “ArcGIS provides the clear insight we need to make informed decisions about how best to tackle Ash Dieback and plan the level of investment that will be needed in the future to manage diseased trees and maintain public safety,” says Alan Gale, Climate Change Adaptation Programme Manager at Forestry and Land Scotland.
Focused action to help maintain public safety
With near-instant visibility of data collected in the field, Forestry and Land Scotland can make faster, well informed decisions to help protect the public from harm. It can easily see ‘hot spot’ areas where there are large numbers of particularly badly diseased trees or weakened branches in close proximity to high risk areas such as public roads and paths. Then it can make rapid, informed decisions about where to prioritise its resources, to remove branches, fell trees and help maintain public safety. “By taking the right action to tackle Ash Dieback, we can help to save lives and prevent injuries, while at the same time retain dead or dying ash trees for their biodiversity value where it is safe to do so,” Gale says.
Efficient data collection in a coronavirus pandemic
In the first two months, Forestry and Land Scotland undertook 2,100 surveys of 6,600 ash trees, despite the additional challenges and restrictions of introducing a new programme and surveying during the COVID-19 pandemic. In 2021 and in subsequent years, it will revisit these trees to compare scores over time, as well as survey thousands of additional trees. “Survey123 provides a far more efficient and cost-effective process than traditional spreadsheet and paper-based survey methods,” says Shona Sutherland, GIS Support Officer at Forestry and Land Scotland. “Completed tree surveys are visible back in the office in near real-time, so we can build up an immediate picture of the risks to public safety from diseased trees, locally, regionally and nationally.”
A scalable and intuitive survey process
Around 60 employees currently use Survey123 to survey ash trees during the course of their usual jobs, whether they are harvesting timber, undertaking maintenance on a recreation route or working on a water vole project. The app can be used on any smart phone, so can potentially be used in the future by any of the organisation’s 800 employees, as well as contractors and partners, to gradually increase the number and frequency of tree surveys. “You don’t need to be tech-minded to use it,” Sutherland says. “Feedback from staff is that the app is intuitive, quick, and easy to use.”

Marine Management Organisation
With ArcGIS we have delivered one of the Government’s first digital mapping services, replacing an outdated system with a user-friendly service that efficiently manages the marine planning and licensing service.
As the Non-Departmental Public Body with delegated authority for preparing and implementing marine plans, providing users access to up-to-date data is a key responsibility of the Marine Management Organisation (MMO). Users had been frustrated by navigating complex sets of hard-copy documents with static maps, which are quickly out-of-date. The MMO needed to replace this outdated system with a Government Digital Service compliant one, giving users access to up-to-date information, which would support implementation of marine plans in the English marine area.
Visualising data on an interactive map with immediate access to relevant policy materials, makes for a more enjoyable and intuitive user experience.
Quicker access to up-to-date data drives faster decision-making, enabling users to progress their planned initiatives more promptly.
Effective data management speeds up internal processes delivering time savings, freeing up time for internal users to focus on other business requirements.
The Challenges
England’s seas are getting busier. Commercial shipping activity is increasing; offshore wind is expanding as a renewable energy source, while carbon capture and storage is a growing industry. Fishing remains a vital source of employment for many while recreational activities, from sailing to surfing, support the tourism sector and provide seaside enjoyment for millions. All these activities mean that the England’s diverse marine life competes with the building of new turbines, pipelines, power cables and even submarines.
As the manager and independent regulator of England’s seas, the Marine Management Organisation (MMO) plays a unique role in delivering a trusted marine planning, licensing and regulatory framework supporting environmental, societal, and economic progress.
Access to and being able to provide up-to-date information on marine planning for users, has always been a challenge for the MMO. As a Non-Departmental Public Body, customer service is paramount so that users can progress their activity or get their businesses off the ground as quickly as possible.
Previously, users accessed plans and related policy documents which are long, hard-copy reports, containing static maps. Mapped data were often out of date as soon as the documents were published, and it was a lengthy process for the MMO and its users to access the information they required.
What was needed was a user-friendly, efficient and trusted map-first service that would assist anyone needing to use or apply marine plan policies. This service needed to help the user quickly understand the best location for their planned activities, including where new developments may be appropriate, while ensuring coastal habitats and recreational activities remain protected.
“Having everything in one place in an integrated application makes marine planning and licensing a much simpler process. It’s a win, win, as ArcGIS enables us to leverage the experience we have internally while meeting the needs of the user.”
James Lawson, Senior Marine Manager, Marine Management Organisation
The Solution
The Explore Marine Plans web service was one of the first interactive web mapping applications developed by the MMO for use on GOV.UK. Users are now presented with a map-first approach, minimising the upfront volume of information, allowing them to self-serve. Their whole end-to-end user journey takes place entirely within the interactive map and even those without access to GIS software can interrogate data generated by the MMO.
There are two simple components to the service: access to data and policy search. Applicants and their consultants seeking development consent from the MMO can guide themselves by drawing a polygon on the map covering their area of interest, and then pull-down related policy information. For example, users may interrogate a ‘live’ version of the marine licence dataset, allowing them to easily identify planned activities that may have an impact on their proposal.
“Having everything in one place in an integrated application makes access to and implementation of marine plans a much simpler process. It’s a win, win for us, as ArcGIS enables us to leverage some of the experience we have internally, while meeting the needs of the user,” says James Lawson, Senior Marine Planner at MMO.
A consultant from Esri UK’s Professional Services team worked collaboratively with the MMO and its digital transformation provider, who were responsible for the Content Management System (CMS), to deliver this vital interactive, web-mapping component. Backed by the CMS, complex marine planning information now sits in an application built around the ArcGIS software development kit so data can be quickly and easily updated. Importantly, this can be done without having to return to hard copy documents to update static maps, which might trigger complex sign-off processes.
Since Explore Marine Plans was launched there has been a notable increase in the average session duration, increasing from approximately 30 seconds to around three minutes. This was initially higher but has now stabilised as people are becoming more familiar with how to use the service.
“By embedding the mapping component in this one, integrated service, users stay within the GOV.UK environment and enjoy a better experience, with a much-improved user interface”
Paul Gilliland, Head of Marine Planning, Marine Management Organisation
Benefits
Better Customer Service
With a single point of entry on GOV.UK, information is easily accessed enabling users to retrieve the data and policy information they require more quickly. An effective user experience is a vital component for any Government digital offering and, now, users of Explore Marine Plans can take the decisions they need to take appropriate action to ensure compliance with marine plan policies.
Intuitive User Experience
Visualising data on an interactive map makes for a much more enjoyable and intuitive user experience. Information can be analysed more efficiently than with hard-copy reports and static maps, and immediate access to up-to-date policy data further enhances the efficacy of the service.
Time Savings
More effective digital data management has made internal processes faster and increased efficiencies. Improved data management processes and integration with internal GIS services has increased efficiency and data accuracy.
Data-driven Decisions
Visual navigation makes it easier for users to identify their areas of interest, and then pull down and interrogate the relevant marine plan policies. Layers of information can be shown or hidden at the click of a button and users have access to the most up-to-date version of the datasets and licensing data, simplifying and accelerating decision-making processes.