Blog Archives
Atkins
We are cutting the cost and duration of road works and reducing disruption for road users by giving utilities and local authorities the shared insight they need to collaborate more effectively.
A new collaboration strategy is now available to utilities and local authorities to help them coordinate road works, dig fewer holes and cause less traffic disruption. With a methodology developed by Atkins and partners, the solution is already delivering multi-million pound savings, reducing the duration of road works by 50% and delivering a range of socio-economic and environmental benefits.
Multiple departments in a single organisation can gain improved visibility of opportunities to align activities and make efficiency savings
Different organisations can share their plans and work collaboratively to achieve their goals more cost effectively with less disruption for road users
The ArcGIS-based solution creates the foundation for a BIM-compatible digital twin for Britain’s subsurface assets
The Challenge
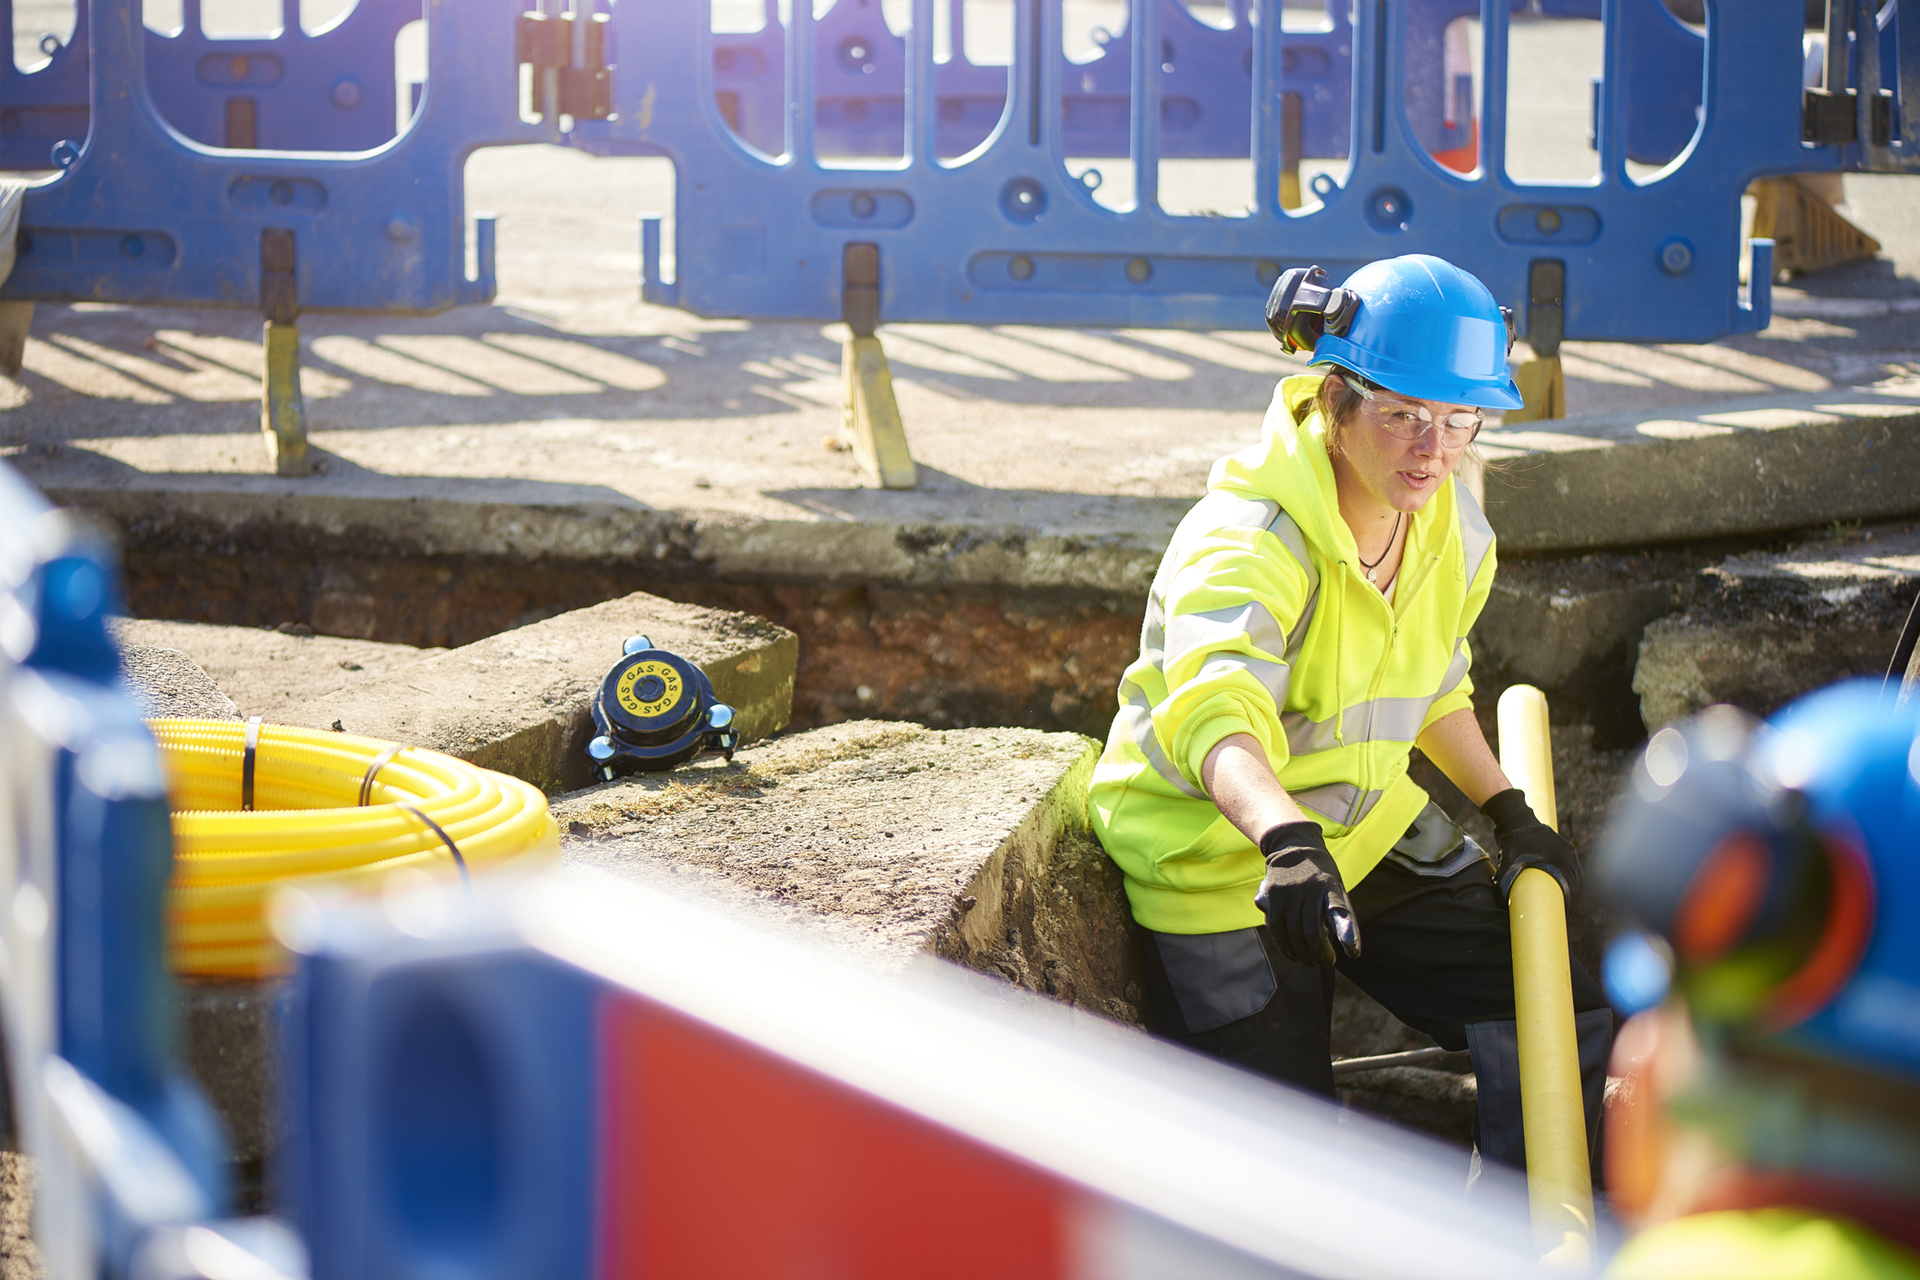
Every time a road is dug up – whether to maintain a gas pipe, repair a water mains, lay new broadband cable or undertake routine resurfacing – there can be huge disruption for local residents and road users. At the same time, there are substantial costs involved, not only from actually digging the holes, but also from operating temporary lights, communicating with residents and applying for licenses. So wouldn’t it be better if utilities and local authorities could plan roadworks more collaboratively to both reduce inconvenience for road users and save money?
“Atkins has estimated that the cost of providing services for a new housing development or commercial premises could reduce by 57% per new connection, if utilities collaborate.”
Geoff Waite, Geospatial Director, Atkins
The Solution
The respected design, engineering and project management consultancy Atkins was convinced that if different departments and organisations could share data more effectively, they could coordinate their activities and significantly cut the number and duration of road works. In partnership with Thames Water and Croydon Council, Atkins deployed a borough-level methodology that aligned with an emerging consensus from the Mayor of London's Infrastructure Group of the need to more efficiently coordinate infrastructure delivery. The methodology leveraged Esri’s ArcGIS solution to develop a secure and trusted platform to enable organisations to visualise their sub-surface assets and those of other departments or external organisations.
Called Connect, the ArcGIS-based methodology allows collaborating organisations to see the ‘as is’ picture of all the assets that currently exist below roads and a ‘future’ view of all the projects planned, in each location, by each participating partner. Users can query the data and ask ‘what’s near’ a particular gas pipe to see all other subsurface assets like water mains that could be maintained in parallel in the same scheduled road works.
Atkins and its partners developed the Connect methodology using ArcGIS Online and the ArcGIS Web AppBuilder, with the support of the Greater London Authority’s Infrastructure Mapping Application, and ensured that all data entered was compliant with Building Information Management (BIM) best practices. Using an agile project methodology to support collaboration, Atkins then sought input into the project from utilities and local authorities and also conducted workshops with members of the public to solicit their views. This collaborative approach informed the development of the data-sharing methodology and helped Atkins and its partners to overcome organisations’ initial resistance to sharing commercial information.
In order to scale across the London metro area, the Connect methodology has benefitted from the Esri-based Greater London Authority’s Infrastructure Mapping Application, funded by industry and providing a multi-utility data repository facilitated by non-disclosure data agreements.
“This ArcGIS-based methodology solves a huge problem for our clients, utilities, local authorities and large commercial sites, such as airports,” says Geoff Waite, Geospatial Director at Atkins. “It allows better quality data to be shared and visualized and is a large step forwards for creating a BIM-compatible digital twin for Britain’s subsurface assets.”
“This ArcGIS-based methodology […] allows better quality data to be shared and visualised and is a large step forwards for creating a BIM-compatible digital twin for Britain’s subsurface assets.”
Geoff Waite, Geospatial Director, Atkins
Benefits
£5.2 million in savings from fewer road works
By using the Connect methodology to improve data sharing between different departments, Atkins’ client Thames Water was able to detect more than 120 km of road where two projects such as mains replacement and new connections could be planned to take place simultaneously. The organisation was then able to renegotiate contracts with road digging contractors and identify ways to save a predicted £5.2 million and remove 3,900 days of construction through its programme.
50% reduction in days of traffic disruption
Continuing to use the Connect methodology, Thames Water, Southern Gas Networks and the London Borough of Croydon were able to coordinate plans to carry out routine maintenance on the road surface, gas pipes and water mains along the busy Epsom Road in Croydon. If the planned jobs had been undertaken separately, construction work would have taken 30 weeks, but it was reduced to 15 weeks through use of the ArcGIS-based Connect platform. Furthermore, the collaborative approach is estimated to have saved around £240,000 for the gas and water utility providers involved.
Reduced socio-economic & environmental impacts from congestion
In the Epsom Road project described above, Atkins estimates that the use of the Connect methodology contributed to socio-economic and environmental benefits of £670,000 from reduced congestion, fewer delayed journeys, improved air quality and less fuel consumption. “1,200 residents live along the Epson Road and thousands of drivers, pedestrians and cyclists use it every day,” says Waite. “Reducing the duration of the road works had a positive impact on the lives of all these people.”
57% cut in the cost of new connections
Using the Connect methodology, it is now possible for utilities to collaborate more effectively to save money when providing water, gas and broadband connections for new housing developments and commercial property developments. They can share the cost of digging the hole, obtaining road closure permissions, suspending parking bays and resurfacing the road. According to Waite, “Atkins has estimated that the cost of providing services for a new housing development or commercial premises could reduce by 57% per new connection, if utilities collaborate.”
More efficient long term maintenance planning
Atkins anticipates that use of the Connect methodology will prevent a lot of time from being wasted planning maintenance activities that have to be cancelled. Currently, utilities often have to abandon months of planning if they discover that the road has been resurfaced, because section 58 of the Highways Act stipulates that roads cannot be dug up again for five years except in case of emergency. If utilities and local authorities collaborate, maintenance works can be undertaken before the roads are resurfaced, reducing the risk of future, costly emergency works and unsightly patches on roads.


Humberside Fire & Rescue Service
ArcGIS gives us the real-time data and insight we need to save lives, create safer communities and collaborate with other organisations in emergency situations.
The migration to new ArcGIS at Humberside Fire & Rescue Service ignited plans to make interactive mapping and accurate data accessible in real-time to firefighters and other staff. Now almost 1,000 employees depend on ArcGIS-based solutions to help them respond rapidly and effectively to emergencies and build safer communities in Humberside.
Firefighters are better prepared for emergencies as they can view interactive maps and data in fire engines on route to incidents
Senior managers can plan fire prevention campaigns more strategically, using analysis to identify households at greatest risk of fire
Fire prevention officers can carry out home safety visits more efficiently, by planning their schedules to reduce travel time and fuel
The Challenge
In the Fire Service today, good quality data is arguably just as important as a well-equipped fire engine. Fire and rescue crews need access to information about incident areas to enable them to make the best decisions, as quickly as possible, and save lives. Equally, other members of staff need accurate data to inform fire prevention and protection activities that reduce fire risks in the community.
At Humberside Fire & Rescue Service, the growing demand for up-to-date data was creating challenges. The small data analysis team was swamped with requests for data and reports, including many different variations of the same report, with just a few parameters changed. Important data was spread across different systems, making it hard for key decision makers to find the information they needed, and staff couldn’t always access information quickly enough, whether they were developing fire prevention and protection strategies or responding to emergencies.
“ArcGIS gives Humberside Fire & Rescue Service instant access to the data it needs to make the right decisions and save lives in emergencies.”
Jo Mann, Risk and Intelligence Manager, Public Safety, Humberside Fire and Rescue Service
The Solution
Humberside Fire & Rescue Service has been using solutions from Esri’s ArcGIS for over ten years. Its recent migration to Esri’s ArcGIS Enterprise solution provided the catalyst for the development of a growing suite of new cloud-based GIS services for up to 1,000 employees. The organisation called upon the support of Esri UK’s Professional Services team to support the migration, but its portfolio of solutions was built largely in-house by its ICT Development and Projects team.
Chief amongst the new solutions is a self-service mapping application, called Intelimap, that brings disparate datasets together in one place for the first time. Developed using the ArcGIS Web AppBuilder tool, it allows members of staff to create custom reports, perform analysis and gain instant access to accurate location information at any time, using any device, from any location.
Key decision makers within the organisation also have access to a range of Esri dashboards that present live information in an easily-understood format. There are dashboards for different topics, such as prevention, and dashboards for different levels within the organisation, such as managers and front line firefighters. All of the data that is available via the dashboards and Intelimap is stored, catalogued, curated and secured centrally in ArcGIS Enterprise.
No longer overwhelmed by requests for reports and data, the analysis team now uses ArcGIS Insights to undertake sophisticated geospatial analysis on historic incidents and social-economic factors to reveal previously unidentified high risk locations. The team then uses Story Map templates in ArcGIS Enterprise to create interactive reports for senior decision makers, highlighting where fire prevention and protection activities are most needed. The flexibility of ArcGIS allows the analysis team to create ad hoc solutions at speed, to meet new requirements as they emerge.
“ArcGIS gave us the ability to create and launch a mobile volunteering solution within a matter of days and collaborate effectively with other emergency service providers and community groups to support vulnerable people at the height of the pandemic.”
Martyn Shields, ICT Development and Projects Manager, Humberside Fire & Rescue Service
Benefits
Improved decision making in life-threatening situations
As they are pulling on their helmets in the back of fire engines, firefighters have access to Intelimap on tablet devices and can view data about the location they are heading towards. Meanwhile, their colleagues in the control room use Intelimap to check historical data, find the nearest water hydrant and direct firefighters to risk critical information. “ArcGIS gives Humberside Fire & Rescue Service instant access to the data it needs to make the right decisions and save lives in emergencies,” says Jo Mann, Risk and Intelligence Manager, Public Safety at Humberside Fire and Rescue Service
Strategic planning of fire prevention activities
Humberside Fire & Rescue Service now uses ArcGIS to more accurately plan where to carry out fire prevention and protection campaigns, based on a better understanding of where there are hotspots of people with high risk factors such as elderly people, living alone who smoke or have limited mobility. “ArcGIS has enabled a more data-driven approach to fire prevention and protection activities,” says Martyn Shields, ICT Development and Projects Manager at Humberside Fire & Rescue Service. “We now have tools to present which areas to focus on, using the rich data that Intelimap provides, and help create safer communities.”
More efficient fire safety visits
Fire prevention officers at Humberside Fire & Rescue Service can now carry out fire safety visits more efficiently, by using Intelimap to group nearby properties together and visit them on the same day to save time and fuel. Furthermore, they can access accurate information, from their mobile devices, to help them assess risks in different locations and recommend the most appropriate fire safety measures. “For the first time, almost all front line employees at Humberside Fire & Rescue Service have access to up-to-date information in the field, which enables them to work efficiently and make the best decisions,” Shields says.
Effective collaboration during COVID-19 lockdown
When the UK went into lockdown during the COVID-19 pandemic, Humberside Fire & Rescue Service launched an ArcGIS solution to coordinate the delivery of food and medicine to vulnerable people. Volunteers used an ArcGIS Survey123 app on their mobile devices to record data about parcels delivered and all of the information was visible to the fire service, police, NHS and other voluntary groups on a dedicated ArcGIS Online dashboard. Shields says, “ArcGIS gave us the ability to create and launch a mobile volunteering solution within a matter of days and collaborate effectively with other emergency service providers and community groups to support vulnerable people at the height of the pandemic.”

Business2Schools
As a charity, we rely on ArcGIS to help us allocate and deliver donated laptops, technology and office furniture to schools all around the country.
For far too long, used office furniture and business equipment has ended up in landfills. Now an inspirational young charity is using ArcGIS to enable businesses to donate their unwanted items to local schools, helping to close the digital divide, reinvigorate pupils’ learning and reduce unnecessary waste.
Over 4,000 schools in the UK and Ireland have registered for donations online via an intuitive ArcGIS web app.
Over 14,000 devices have been donated and allocated to the most appropriate schools using ArcGIS analysis.
Thousands of laptop donations to schools have been facilitated through an ArcGIS web app and BBC campaign.
The Challenge
Whenever large businesses refresh their offices or move to new premises, they dispose of hundreds of desks, chairs, computers and other items that are far superior in quality to those used by schools just a few miles away. Many organisations also replace their laptops every three to five years, discarding devices that are significantly more powerful and versatile than the out-dated computers in schools. Business2Schools wanted to address this imbalance, by diverting perfectly good furniture and technology away from landfills and into classrooms.
“If schools do not have to invest in furniture and technology, so much more can be invested in teaching.”
Lindsey Parslow, CEO, Business2Schools
The Solution
Business2Schools’ CEO Lindsey Parslow contacted Esri UK for advice when the charity was little more than a good idea. Recognising the huge potential of the initiative, Esri UK helped Parslow to embed GIS into core operating procedures so that the embryonic organisation’s vision could be realised as efficiently as possible. “Esri UK has been invaluable,” Parslow says. “Without Esri UK’s support and the ArcGIS technology, I don’t think we would be where we are today.”
ArcGIS fulfils four vitally important roles at Business2Schools. Firstly, an ArcGIS web app, embedded in the charity’s website, allows schools to register online and create a wish list for the furniture and technology that they would love to receive. All the relevant data is collated automatically by ArcGIS in a single spatial database, without any manual data handling.
Next, ArcGIS is used to locate the registered schools that are nearest to the organisations that have equipment to donate. When the postcode of the business is entered, the charity can immediately see how many registered schools are in the vicinity and expand or shrink the catchment zone to include more or fewer schools depending on the quantity of equipment available. Once the catchment zone is set, ArcGIS exports the email addresses of all head teachers in the zone, so that the charity can easily send them the inventory of available equipment.
Business2Schools also uses ArcGIS to undertake analysis to help it determine the best way to allocate high-demand items, based on need and location. For example, when Business2Schools is donated height-adjustable desks, it uses ArcGIS to find nearby special schools that cater for the needs of large numbers of students who use wheelchairs.
Finally, the charity’s website offers an ArcGIS web app allowing individuals and small businesses to find their nearest school and contact them direct to offer them small amounts of equipment or individual laptops. This web app was promoted by the BBC during the first national COVID-19 lockdown, as part of its ‘Make a Difference Appeal’, facilitating the donation of thousands of laptops nationwide to help pupils study from home.
“We simply couldn’t run this charity without ArcGIS.”
Lindsey Parslow, CEO, Business2Schools
Benefits
Rapid donation of unwanted furniture and equipment
The use of ArcGIS allows Business2Schools to allocate unwanted technology and office equipment to nearby schools very quickly. “When we were donated all the furniture and equipment from a 500-person office in Westminster, we were able to re-home it all at twenty nearby schools within just two days,” says Parslow. “If we had to physically register all the schools, work out which are closest to donated goods, manually look up contact details and ring around, it would just take too long. We simply couldn’t run this charity without ArcGIS.”
Reduced impact on the environment from local distribution
Critically, ArcGIS allows Business2Schools to plan the distribution of goods in the UK and Ireland, to minimise the environmental impact of deliveries. For example, it recently conducted spatial analysis to find a pocket of schools in the Croydon area and arrange the delivery of 100 office chairs to a number of schools, from one lorry, in one round trip. “The environment and waste reduction is at the heart of what we do, so we don’t want our deliveries to contribute to pollution,” Parslow explains. “Donating locally also provides a very tangible way to teach children about sustainability and helps businesses show that they care about their communities.”
Prioritisation of schools with greatest need
Using ArcGIS, Business2Schools can ensure that donated technology and furniture is sent to the schools with the greatest need. It recently undertook spatial analysis to identify schools in social mobility ‘cold spots’ and prioritise them for donated IT equipment. “If schools do not have to invest in furniture and technology, so much more can be invested in teaching,” Parslow says. “A primary school that received thirty computers from a financial services company eighteen months ago was able to buy new English and Maths software – and then exceeded the national average for its SATS results for the first time the following year.”
Collaborative action to lessen the digital divide
The ‘Find Your Nearest School’ web map opened the door for Business2Schools to collaborate with the BBC to help lessen the digital divide between pupils who did and did not have access to technology during the pandemic. The app stopped the BBC from being inundated with calls and freed up Business2Schools to concentrate on big corporate donations. A secondary school that received 100 old laptops from Esri UK managed to get almost all its pupils online during lockdown, enabling the children to engage effectively with learning at home.

Homes England
Through our use of ArcGIS Experience Builder we are improving awareness of the availability of development land and helping the Government to achieve its target of 300,000 new homes per year.
Homes England is supporting the delivery of much needed homes in England with a trailblazing web app built using Esri’s new ArcGIS Experience Builder. Called Land Hub, the solution provides instant access to detailed information about the development plots that Homes England wants to sell, enabling housing developers to make faster, well informed investment decisions and accelerate the supply of new homes.
ArcGIS Experience Builder provides all the flexibility of an ArcGIS StoryMap, with additional search and querying capabilities
Usage of Homes England’s Land Hub app increased by 365% after it was redeveloped using ArcGIS Experience Builder
Land Hub has led to a reduction in email enquiries of up to 65%, improving the efficiency of Homes England’s customer services
The Challenge
Homes England has a vital role to play in helping the UK Government to achieve the ambitious target of 300,000 new homes per year, by the mid-2020s. As part of its mission to accelerate housing supply and create a more resilient, diverse housing market, the organisation facilitates the sale of publicly owned land, supporting the delivery of new homes and generating returns for the public purse. It used to produce a list, twice a year, of development plots that were for sale, but this basic document didn’t provide the level of information that developers needed to make informed decisions about what could be multi-million pound investments.
“Land Hub accelerates the supply of new homes by making information about development sites more accessible and transparent, and enabling house builders to make faster, well informed plans for new housing developments.”
Fiona Clowes, Head of Geospatial Environment, Homes England
The Solution
Using Esri’s ArcGIS, Homes England developed an online, interactive solution called Land Hub that makes information about potential development sites very easy for developers to find and explore. Initially, Land Hub was published in an ArcGIS StoryMap template. Then, twelve months later, Homes England redeveloped the solution using ArcGIS Experience Builder, becoming one of the first organisations in the world to take advantage of this versatile new app creation tool.
“We really liked the StoryMap approach as it gave us the ability to customise our site information and incorporate our own corporate style,” explains Fiona Clowes, Head of Geospatial Environment at Homes England. “However, when we found out about the new ArcGIS Experience Builder we were really excited about its potential and keen to put it to use. It offers all the components of a StoryMap that we like, but also gives us the ability to include more querying and searching capabilities.”
Available for anyone to use, on desktops and mobile devices, the latest version of Land Hub allows people to see all development sites on an interactive map and search for sites by local authority area or status (such as being marketed or in the pipeline). Once they click on a specific parcel of land, users can then view relevant information, such as the locations of flood alert areas and local authority green belts, local transport hubs and drone footage, all of which helps them to make an informed decision about whether or not to bid for the land.
Developers can also download data from Land Hub directly into their own GIS systems, so that they can analyse it in conjunction with their own data. Whereas Homes England’s original property list was only updated biannually, data in the Land Hub is currently updated quarterly, and Homes England plans to introduce monthly updates in the near future.
“Over the last twelve months, average usage of Land Hub has increased by 365% from 107 to 392 views a week, which demonstrates the value it adds for developers.”
Jimmy Overill, Development Manager, Homes England
Benefits
Rapid insight into development opportunities
The ArcGIS-based Land Hub solution gives developers faster and deeper insight into development opportunities across England, helping them to build more homes, more quickly. As Clowes says, “Land Hub accelerates the supply of new homes by making information about development sites more accessible and transparent, and enabling house builders to make faster, well informed plans for new housing developments.”
Cost and time savings for developers
The quality of the data that is available via Land Hub often removes the need for site visits and additional surveys, enabling developers to save time and money. For example, whereas an aerial image of a site might just show a large tree canopy, the drone imagery available via Land Hub allows users to peer beneath the branches and see the whole site, from multiple angles, without obstructions. Jimmy Overill, Development Manager at Homes England, says: “Over the last twelve months, average usage of Land Hub has increased by 365% from 107 to 392 views a week, which demonstrates the value it adds for developers.”
More efficient customer services
Using Land Hub, Homes England can now channel enquiries from developers to the right members of staff, depending on the plot of land they are interested in, and respond to them more quickly. In the past, the organisation used to receive over 100 emails each week, often asking the same questions, and it could take 2-4 weeks to respond. Now the organisation receives just 35-40 enquiries a week, because the answers to questions are already on Land Hub, and it can research and respond to more complex enquiries in just 4-5 days.
Confident bids for development sites
By making information about sites available much earlier, Land Hub enables housing developers to bid for sites with greater confidence. The platform allows Homes England to advertise sites that it is bringing to market up to nine months in advance of inviting tenders, which gives housing developers early sight of plots they may want to secure. Developers consequently have more time to thoroughly investigate sites and get all the information they require, such as Homes England’s requirements to use Modern Methods of Construction or to build the site out at pace.
An effective way to showcase success
In addition to advertising available land, Homes England also uses Land Hub to showcase the diverse range of sites that it has been able to make available, over time, which is suitable for developers of different sizes and different types of housing. “It is not just a marketing tool; it’s also a story board for how we’re working to diversify the market,” Overill says.

Thames Estuary Partnership
ArcGIS enables us to clearly demonstrate the damaging impact of barriers on migrating fish in the Thames and share data effectively with the stakeholders who can work with us to improve the Thames ecosystem.
Thames Estuary Partnership wants to create a more sustainable future for the 125 fish species that live in the River Thames. The not-for-profit organisation is using ArcGIS to encourage stakeholders to improve the quality of riverside habitats and reopen fish migratory routes that have been blocked for decades.
An interactive web app allows users to explore data on fish migratory routes, river barriers and habitats along the Thames and its tributaries
An engaging Story Map provides people with an interactive tour of the Thames, incorporating maps, images, video and information
Esri training resources and free online courses enabled Thames Estuary Partnership to optimise its use of ArcGIS with no external support
The Challenge
Flowing through the most densely populated city in Europe, the Thames is one of the world’s most famous rivers. Yet few people realise that this iconic and historic waterway is home to more than 125 species of fish, as well as marine mammals and migrating birds.
Thames Estuary Partnership was formed to provide a forum for stakeholders working in and around the Thames and engage with them to improve the natural environment of the estuary. To communicate the results of one of its in-house projects, the organisation needed a better way to share data about the river ecosystem and raise awareness of the importance of reopening fish migratory routes.
“Using our ArcGIS Story Map, everyone can tour the Thames in their own way, visiting just the locations they are interested in, or travelling all along the river from Teddington to the North Sea.”
Wanda Bodnar, Project Officer, Thames Estuary Partnership
The Solution
Thames Estuary Partnership evaluated a number of potential solutions before selecting Esri’s ArcGIS platform. “Usability and interactivity were the two critical requirements,” explains Wanda Bodnar, the organisation’s Fish Migration Roadmap Project Officer. “We discovered that ArcGIS makes it very easy for people to learn more about our projects.”
The organisation used ArcGIS Desktop to create an interactive ‘roadmap’ of the Greater Thames Estuary, combining data on fish migrations, habitat quality, artificial river barriers, flood areas and riverside developments. It then created a website using ArcGIS Hub to display the web map and made it publicly available online. Now anyone can explore the Greater Thames Estuary Fish Migration Roadmap to see the sections and tributaries of the Thames that are accessible to migrating fish, or blocked by artificial barriers, and access the quality of the river habitat in different locations.
Thames Estuary Partnership also used Esri’s Story Map template to create an interactive tour of the Thames called The Tidal Thames, to replace its annual boat trip which was cancelled due to the COVID-19 pandemic. The Story Map provides a highly informative, interactive and engaging description of different parts of the Thames. People can simply click on a point along the river course to go directly to a particular location and see images, play video clips and read interesting facts. “People are not overwhelmed with information,” Bodnar says. “Using our ArcGIS Story Map, everyone can tour the Thames in their own way, visiting just the locations they are interested in, or travelling all along the river from Teddington to the North Sea.”
Bodnar led on the development of the Fish Migration Roadmap and Tidal Thames Tour Story Map herself, with no professional support, after taking advantage of the wide range of free training resources and Massive Open Online Courses (MOOCs) offered by Esri. “The online training gave me ideas and helped me to make the most of ArcGIS,” she says. “It’s a brilliant self-supporting system that makes even the most complex projects manageable.”
“Now stakeholders can prioritise the removal of barriers that restrict access to upstream areas where the habitats are good.”
Wanda Bodnar, Project Officer, Thames Estuary Partnership
Benefits
Raised awareness of the impact of barriers
The Fish Migration Roadmap has enabled Thames Estuary Partnership to clearly illustrate how artificial barriers, such as locks, sluice gates and weirs, are preventing key fish species from reaching high quality habitats and spawning grounds. People can, for example, see the obstructions faced by the European Eel, a critically endangered species that travels across the Atlantic Ocean to mature from glass eels into silver eels in the Thames. “We have seen from social media that our message is being heard,” Bodnar says. “People retweet our Roadmap and comment on how they didn’t know before that there were so many barriers to fish migration in the Thames. We are also receiving expressions of interests from other NGOs interested in getting involved and working together.”
Intelligence gathered to inform investment decisions
Thames Estuary Partnership is now collaborating with stakeholders and using the Fish Migration Roadmap to demonstrate which barriers should be removed or adapted first. It is now possible to make key investment decisions based on a clear understanding of where high quality habitats can be opened up, by the adaptation of specific barriers. “Barriers used to be removed or adapted in an opportunistic way,” explains Bodnar. “Now stakeholders can prioritise the removal of barriers that restrict access to upstream areas where the habitats are good.”
Clear data amassed to encourage more sustainable riverside developments
Through its Fish Migration Roadmap, Thames Estuary Partnership can now make easily-understood, authoritative information instantly available to all local authorities, landowners and riverside developers working in the Thames region. All these stakeholders can use the roadmap to help them make better-informed decisions about how to best develop and manage the river banks for the benefit of wildlife.
Improved knowledge of the Thames
Viewed over 1,000 times in the first three months alone, the Tidal Thames Story Map enables everyone to get a deeper appreciation of the Thames, regardless of where they live. During the COVID-19 pandemic, when travel is highly restricted, the online Story Map gives people from as far away as Japan and the USA the opportunity to learn about the river Thames. “Most visitors to London just look at the Thames as it flows under Tower Bridge,” Bodnar says. “The Story Map shows people the foreshore, tells them about the wildlife living in the river and helps them understand the importance of reed beds further along the river edge. It offers near limitless potential as an educational tool.”
Actavo
ArcGIS is the pivotal technology enabling us to design a high-speed fibre broadband network that will help to deliver connectivity to 1.1 million people in rural Ireland.
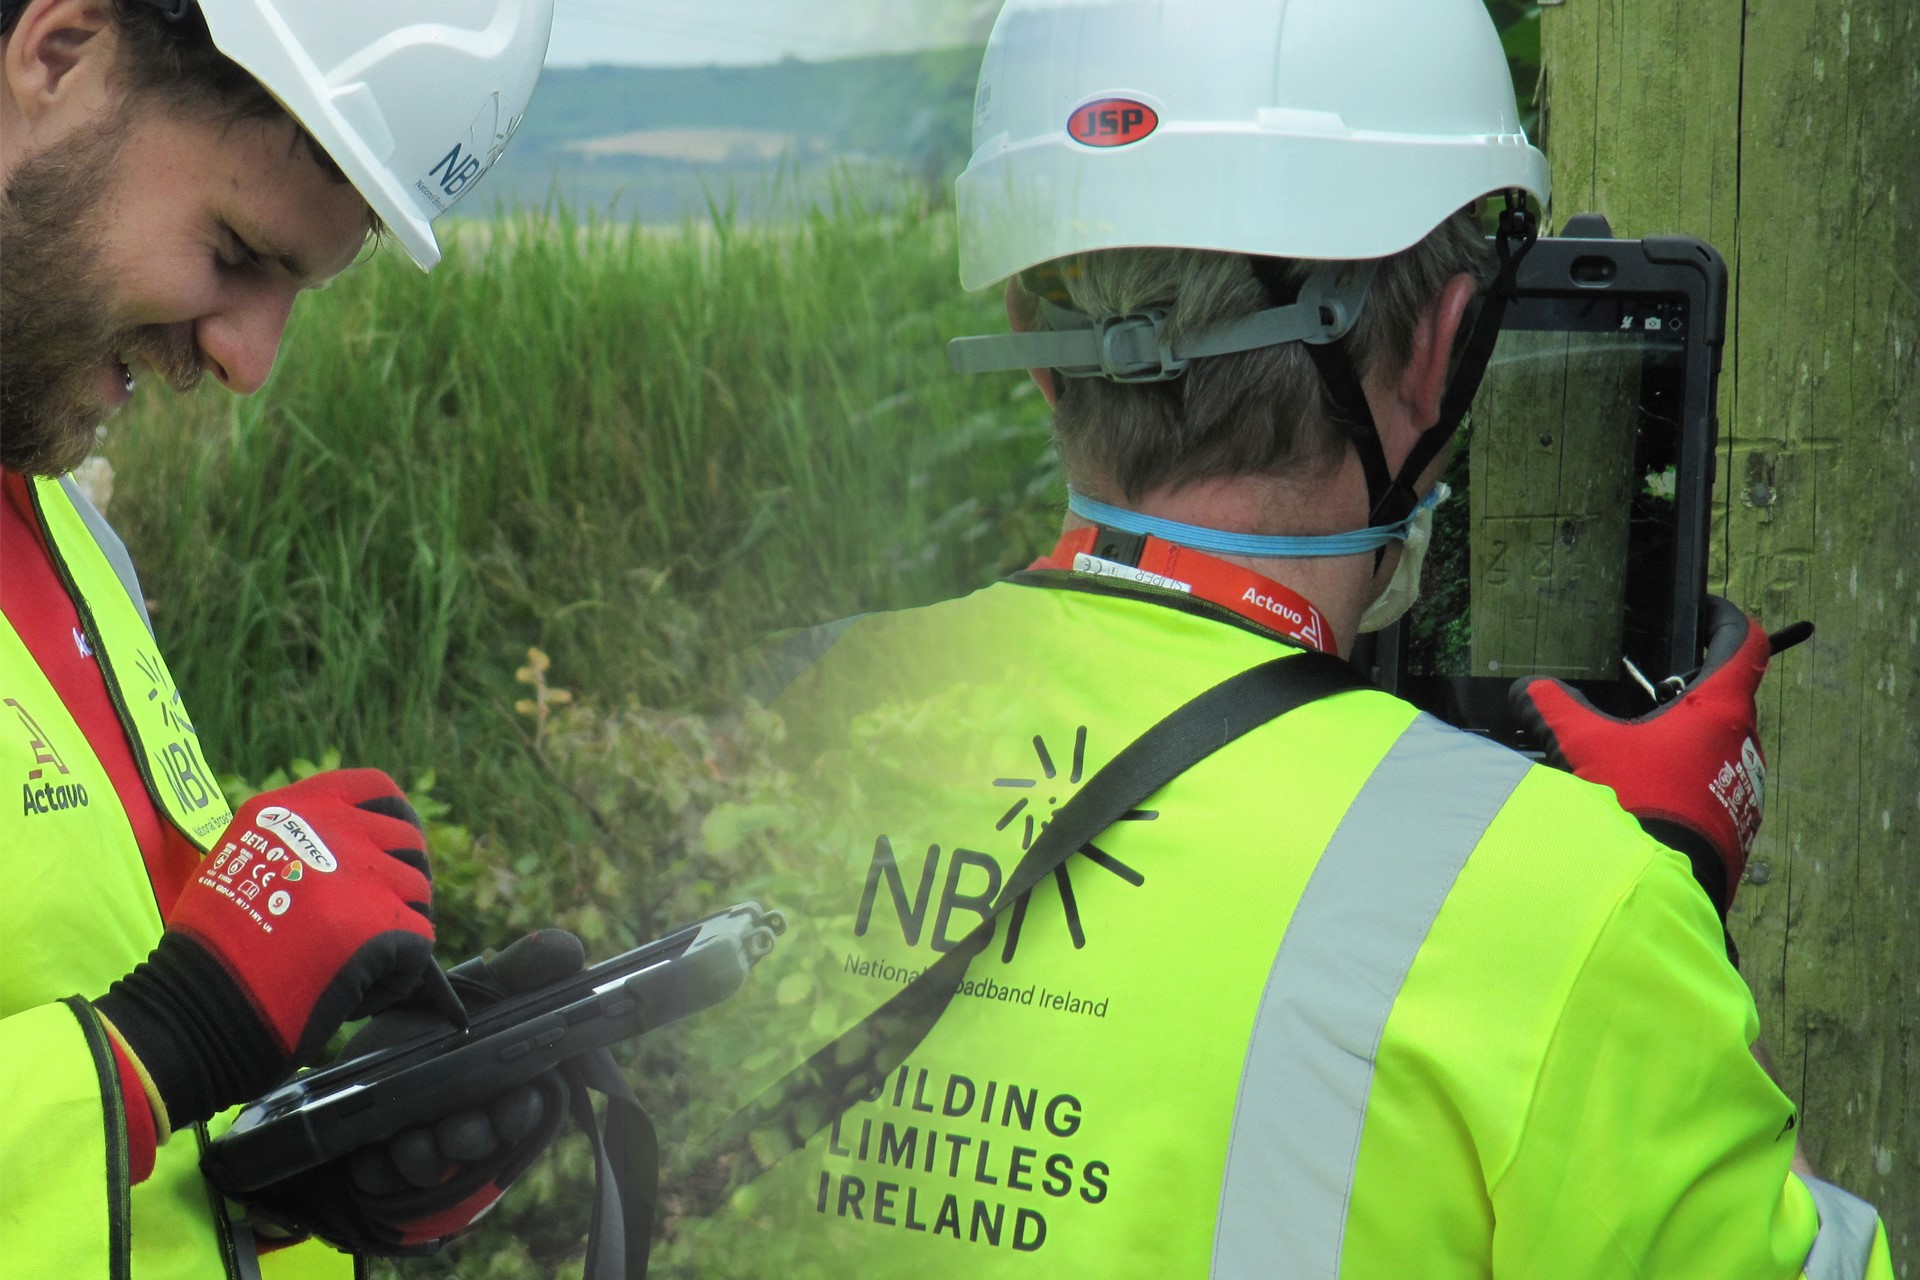
Actavo is a primary contractor for the largest and most significant telecommunications initiative ever undertaken by the Irish government. The organisation is using ArcGIS to help fulfil the requirements of its contract as efficiently as possible and design a state-of-the-art, high-speed fibre broadband network which will help transform the lives and livelihoods of 1.1 million people in rural Ireland.
25 surveyors use Collector and Survey123 for ArcGIS in the field to survey 800 poles and 40km of cable a day
Designers use automated functionality in ArcGIS Pro to accelerate the design of the broadband network
Managers use Esri dashboards to manage the project and monitor the progress of surveyors working nationwide
The Challenge
The National Broadband Ireland project aims to bridge the digital divide between cities and rural areas in Ireland. It will deliver high speed internet connectivity to 537,000 buildings, providing 1.1 million people with better opportunities to learn, work and engage with others. However, before 146,000 km of new fibre cable can be laid, Actavo, one of the primary contractors appointed to the National Broadband Plan project, needs to undertake surveys across the country. It then needs to design the new broadband network, taking into account the requirement to reuse as much of the existing telecommunications infrastructure as possible to ensure efficiencies in cost and build time.
ArcGIS Pro reduces the need for a high number of design resources to deliver such a huge project, creating significant annual cost savings.
Lindsay Rountree – Project Lead, Actavo
The Solution
The organisation engaged consultants from Esri Ireland to help it develop a suite of GIS solutions specifically for the National Broadband Ireland project using Esri’s ArcGIS platform. Using a workshop approach, the Actavo team and Esri Ireland consultants brainstormed concepts for solutions, which the Esri Ireland consultants then developed, tested and fine-tuned until they precisely met the needs of the business. “Esri Ireland was very quick to turn ideas into solutions,” recalls Lindsay Rountree, Project Lead at Actavo. “The consultants were very knowledgeable and excellent to work with.”
The following ArcGIS solutions are now pivotal for the ongoing implementation of the National Broadband Ireland contract:
- Planners use ArcGIS Online to review survey areas and plan survey routes, ensuring there is adequate access to poles and other assets that need to be surveyed.
- Surveyors use Collector and Survey123 for ArcGIS to complete map-based surveys on tablets in the field and upload survey data back to the central project office in Dublin.
- Specialist designers use ArcGIS Pro to design the broadband network, taking advantage of advanced programming functionality to automate many aspects of the design process.
- Managers use an Esri dashboard to view the status of surveys, monitor individual and team progress against surveying targets and gather data for client reporting.
According to Rountree, ArcGIS was the ideal technology platform for the National Broadband Ireland project. “ArcGIS is an internationally-recognised GIS solution, used across lots of industries and especially in the telecommunications sector. This makes it easier for us to recruit staff with the required GIS experience and skills for the National Broadband Ireland project.”
ArcGIS works well offline, syncs when online and is very reliable.
Marshall Myhan - Survey and Design Manager, Actavo
The Benefits
Highly efficient nationwide surveys
The use of Collector and Survey123, together with the creative thinking of Actavo’s survey team, has resulted in a mobile survey process that is highly efficient. Indeed, in just one day, 25 surveyors can survey 800 poles and more than 40km of overhead cable, collecting high quality data, which can be verified centrally immediately. Brian Kelly, Group CEO of Actavo, says: “Actavo is delighted to be involved as one of the primary contractors designing and building the new high speed broadband network in Rural Ireland. National Broadband Ireland is an incredibly important initiative that will connect communities and stimulate the economy of Ireland.”
Significant annual cost savings
Actavo’s designers can produce accurate network designs very quickly, because ArcGIS Pro uses programming scripts to automate much of the design process. Designers only have to focus on any exceptions and advanced design tasks to produce the final product. Furthermore, if the client requests a change to the broadband network design, the existing design can be adjusted in ArcGIS Pro without starting from scratch. According to Rountree, “ArcGIS Pro reduces the need for a high number of design resources to deliver such a huge project, creating significant annual cost savings.”
No technology barriers for new surveyors
The field-based surveying method is very intuitive for surveyors, meaning that new employees can get up and running very quickly. This is a key benefit as it enables surveyors to work efficiently and mobilise nationwide to deliver quality surveys from day one. “The ArcGIS mobile solution is very easy for people to pick up, use and follow which survey task to carry out next,” Rountree says.
Reliable data collection everywhere in Ireland
As Actavo needs to survey very rural areas, where there is often poor or no mobile connectivity, it is a huge advantage that Esri’s mobile solutions work effectively both online and offline. “I have been on plenty of projects in the past where we have had challenges retaining data or syncing when working in rural areas with poor connectivity,” says Marshall Myhan, Survey and Design Manager at Actavo. “ArcGIS works well offline, syncs when online and is very reliable.”
Clear visibility of project performance
The ArcGIS platform and the Esri dashboard in particular provide Actavo with detailed information that it can use to monitor the status of surveys and provide reports to its client about the overall productivity of the project. As Rountree points out, this visibility was particularly valuable during the COVID-19 crisis. “I could log in from home, see the status of the project and monitor how individual surveyors and teams were performing,” he says.

Severn Trent Water
While Britain was in lockdown, our employees were using their daily exercise time to survey properties near their homes with an ArcGIS app and help us tackle water leakage.
When its offices closed and employees were forced to work from home during the COVID-19 lockdown, Severn Trent Water launched an innovative crowdsourcing app to help it tackle the challenge of water leakage. Used by 200 employees, the ArcGIS-based solution enabled the company to improve the accuracy of its water leakage data, increase the effectiveness of its leakage detection activities and target significant increases in revenue.
Collector App for ArcGIS allows employees to easily find void properties and complete walk-by surveys
Esri’s Operations Dashboard provides a real-time, visual overview of surveys completed and the data collected
The solution was created by Severn Trent Water’s in-house GIS team in just a few days
The Challenge
Around three billion litres of water are lost from the water network in England and Wales every single day. Consequently, the water industry regulator, Ofwat, has asked all water companies to commit to reducing leakage by at least 16% between 2020 and 2025. Most leakage occurs when aging pipes deteriorate or burst, but a significant amount of the water that is recorded as lost has actually been consumed by properties incorrectly listed as being unoccupied.
In one of many activities to tackle the leakage challenge, Severn Trent Water previously asked employees to visit properties listed as unoccupied (or ‘void’) near where they lived or worked and verify the occupancy status. However, equipped with paper print-outs of maps and using basic spreadsheets, the team of volunteers only managed to survey just over 1,500 properties during the three month project.
“In challenging business conditions, we made the most of our Esri software to deliver an app that added tremendous value for the organisation.”
Richard Walwyn, Head of Innovation and Asset Intelligence at Severn Trent Water
The Solution
When the UK went into lockdown, as a result of the COVID-19 pandemic, the majority of Severn Trent Water’s employees had to work from home. The organisation wanted to find a way to optimise employees’ time during this difficult period, by enabling them to volunteer to survey void properties in their permitted daily hour of exercise.
Using Esri’s ArcGIS Online and Collector App for ArcGIS, Severn Trent Water created a mobile app that allows employees to view the recorded locations of all void properties on an interactive map on their smartphones. Employees then use an edit function and drop down boxes to record whether each property is a) clearly occupied, b) clearly unoccupied or c) the occupancy status is unclear.
All of the data collected via the mobile app is uploaded in real-time to an Esri Dashboard, where managers can visualise the survey results. During lockdown, Severn Trent Water used Microsoft Yammer, a social media platform for workplaces, to share data from the Esri Dashboard privately with all of the company’s employees in regular updates. The organisation was able to gamify the use of the app by posting who had done the most surveys in a day or a week and who had covered the most distance.
Severn Trent Water built this ArcGIS solution within just a few days. “This is a great example of innovative thinking at Severn Trent Water,” says Richard Walwyn, Head of Innovation and Asset Intelligence at Severn Trent Water. “In challenging business conditions, we made the most of our Esri software to deliver an app that added tremendous value for the organisation.”
“ArcGIS has given us a better understanding of what is genuine leakage and what is not.”
Richard Powell, Asset Information and Insights Management Lead at Severn Trent Water
Benefits
550% increase in surveys undertaken
The introduction of the ArcGIS app has enabled Severn Trent Water to survey 550% more void properties in the same period as was possible using the prior paper-based approach. Over three months, 200 volunteers succeeded in surveying over 8,000 properties, whereas the company had only surveyed just over 1,500 properties in three months previously. The app is much easier to use than the paper-based survey method and eliminates the time-consuming manual task of typing up the data recorded on paper.
38% of ‘empty’ properties identified as occupied
Of the 8,255 void properties surveyed using the ArcGIS app, 3,141 – or 38% – were identified as being occupied. Severn Trent Water could therefore improve the accuracy of its leakage data and reduce the volume of water recorded as ‘lost’ that is actually being consumed by households or businesses at properties incorrectly listed as being empty.
More effective detection of genuine leaks
With more accurate information about void properties, Severn Trent Water can now improve the efficiency of its specialist leakage detection teams. Instead of wasting time looking for leaks that are in fact caused by household consumption, they can focus on detecting hard-to-find underground leaks. “ArcGIS has given us a better understanding of what is genuine leakage and what is not,” says Richard Powell, Asset Information and Insights Management Lead at Severn Trent Water. “We can then focus our resources in the right places to detect leaks more quickly and play our part in helping the water industry to reduce water wastage.”
Increased revenues of up to £1 million
While this was not the main driver for the initiative, Severn Trent Water has calculated that it could increase its revenues by £1 million, if all of the 3,141 properties identified as occupied start paying for their water. However, Severn Trent Water’s initial priority is to obtain the correct contact information for each property, so that the organisation knows who to contact in the event of a service interruption, water quality issue or other unforeseeable emergency. Severn Trent Water will also be able to support any households that might struggle to pay their water bills, through a range of schemes and trust funds.
Positive employee morale during the lockdown
Finally, it is important to note that employees enjoyed using the ArcGIS app and had fun participating in the initiative during what was very difficult time for many of them. “The initiative gave employees a purpose and encouraged them to go outside and get some exercise, helping to improve their mental health and wellbeing,” Powell says.
Walk Wheel Cycle Trust
ArcGIS empowers all our employees to work efficiently and deliver vital projects to create healthier places and happier people
The migration from legacy GIS solutions to Esri’s ArcGIS has completely transformed the way that the charity Walk Wheel Cycle Trust uses GIS and stimulated innovative new ways of working. In the first twelve months alone, employees created over 400 new GIS solutions, apps and web maps that are now helping Walk Wheel Cycle Trust to achieve its mission to make it easier for people to walk and cycle.
Project teams identify, plan and implement new strategic projects using a range of ArcGIS tools
Volunteers and members of the public submit information to Walk Wheel Cycle Trust using ArcGIS mobile solutions
Directors and senior leaders monitor the impact of projects effectively with ArcGIS Online dashboards
The Challenge
Walk Wheel Cycle Trust had a small GIS team but a big ambition. It wanted to make GIS capabilities and geospatial data much more accessible to employees throughout the organisation, as well as volunteers and stakeholders. This goal was, however, impeded by Walk Wheel Cycle Trust's aging and fragmented GIS systems landscape. The charity had seven different GIS solutions, which stored data in a variety of file formats, were hard to integrate and didn’t present a ‘single source of the truth.’ Some groups of users had to grapple with two or more of these complex legacy GIS systems to do their jobs, whilst the vast majority of employees didn’t have access to GIS at all.
“It wasn’t until we began the transition to ArcGIS that I began to understand just how transformational the solution would be. I realised that we would no longer be an organisation with a GIS team; we would be an organisation using GIS."
Ralph Hughes, GIS Manager, Walk Wheel Cycle Trust
The Solution
Walk Wheel Cycle Trust replaced its legacy systems with Esri’s ArcGIS and set about making geospatial data and GIS capabilities available to all employees throughout the organisation. “It wasn’t until we began the transition to ArcGIS that I began to understand just how transformational the solution would be,” says Ralph Hughes, GIS Manager at Walk Wheel Cycle Trust. “I realised that we would no longer be an organisation with a GIS team; we would be an organisation using GIS.”
More than a third of the organisation’s 650 employees now rely on ArcGIS regularly to:
- View, share and maintain the National Cycle Network dataset in ArcGIS Online
- Develop new cycling and walking routes using ArcGIS Online tools and ArcGIS Pro
- Plan and implement new projects, such as making existing paths on the National Cycle Network more accessible for everyone including people using wheelchairs and adapted cycles, with web apps developed with ArcGIS Web AppBuilder
- Collect information in the field about the condition of trees on Walk Wheel Cycle Trust’s property using Collector for ArcGIS
- Engage the help of volunteers to survey route signs using Survey123 for ArcGIS
- Present data on the charity’s impacts in a visual way to directors and senior leaders via ArcGIS Online Operations Dashboards
- Find the relevant information and details of regional staff to respond to public enquiries using an ArcGIS Online contacts app
- Share information with the general public and stakeholders in engaging and highly visual ArcGIS StoryMaps.
After just twelve months of using ArcGIS, Walk Wheel Cycle Trust employees had developed 401 GIS web apps, mobile apps, dashboards and story maps. “That’s all down to the intuitiveness and ease of use of ArcGIS Online,” says Hughes. “With a small GIS team and this very powerful GIS platform, Walk Wheel Cycle Trust can now do a huge amount and have a massive impact. It’s phenomenal how much colleagues have done in a short time with ArcGIS – and just how much more we can do.”
“With a small GIS team and this very powerful GIS platform, Walk Wheel Cycle Trust can now do a huge amount and have a massive impact. It’s phenomenal how much colleagues have done in a short time with ArcGIS – and just how much more we can do.”
Ralph Hughes, GIS Manager, Walk Wheel Cycle Trust
Benefits
Greater insight into new opportunities
ArcGIS has empowered Walk Wheel Cycle Trust employees with the tools to identify the best ways to achieve their dual strategic priorities of creating ‘Paths for everyone’ and ‘Liveable cities and towns for everyone’. For example, the organisation’s Research and Monitoring team has recently used ArcGIS Pro to identify potential routes for new ‘greenways’ in Scotland, that will create safe, accessible and attractive places for people using bikes, wheelchairs, mobility scooters and pushchairs.
Effective monitoring of the charity’s impact
Walk Wheel Cycle Trust directors and senior leaders can now more easily monitor the charity’s achievements, in line with its strategic priorities, using a range of ArcGIS Online visualisation tools and dashboards. One dashboard combines Walk Wheel Cycle Trust's own data with UK deprivation data to help the organisation understand what proportion of its projects are being carried out in deprived communities. Directors and senior leaders can also see a visual representation of the National Cycle Network showing ‘green’ sections that have been successfully adapted to make them more accessible and safer.
Substantial improvements in business efficiency
The migration from seven disparate GIS systems to a single enterprise GIS platform has led to substantial time savings across the organisation and improved the efficiency of key business processes. For example, it used to take the GIS team 30-40 minutes to make a single update to the National Cycle Network dataset and then it could take up to two days for this change to be replicated across all business systems. Now, the GIS team can make changes in ten minutes and the updates are visible to everyone in the organisation immediately, improving decision making.
Improved engagement with volunteers
In an exciting new initiative, Walk Wheel Cycle Trust has used Survey123 for ArcGIS to allow volunteers to identify wayfinding signs that need to be amended, following recent changes to the National Cycle Network. Data collected by volunteers on their smartphones is collated in real time in a central ArcGIS project management tool, giving the signage team the information they need to ensure that signage across the Network is as accurate as possible.
Clear communication with the public
Employees who had little or no experience of using GIS now use ArcGIS Online in a variety of ways to communicate information about key projects. In Scotland, for example, Walk Wheel Cycle Trust has created a well-received ArcGIS StoryMap to explain how proposed street improvements in the village of Killin will make the village centre a more wheelchair-accessible, attractive and sociable community space. The StoryMap embeds a Survey123 form, enabling the project team to capture feedback from the local community and plan the project in a collaborative way.

Land and Property Services
Government, public sector organisations, commercial businesses and citizens can all easily find and use geospatial data and maps for Northern Ireland using a data-sharing platform powered by ArcGIS.
Over more than a decade, Land & Property Services has built, enhanced and extended a versatile spatial data-sharing platform for Northern Ireland called Spatial NI. Powered by ArcGIS, the platform underpins the work of government departments and public sector organisations, enabling them to deliver more efficient and innovative public and commercial services.
24 million large-scale base mapping interactions are supported each month on Spatial NI
20,000 public sector employees have access to Spatial NI on their desktops
7,000 citizens access free services on Spatial NI each month, 50% of whom are new users
The Challenge
Land & Property Services (LPS) is responsible for collecting, processing and managing land and property information for Northern Ireland. In 2007, the organisation built an entirely new technical infrastructure for storing, managing and delivering maps and location-based data, called Spatial NI. Ever since then, it has striven to continually develop this platform and create a one-stop-shop for finding and using geospatial information about Northern Ireland.
In many ways, Spatial NI has been an enabler and a catalyst for innovation within government. Several government departments have used Spatial NI to deliver efficient new services for the public.
Jim Lennon – Chief Survey Officer, LPS
The Solution
Spatial NI is powered by Esri’s ArcGIS and has grown dramatically in size and scale since it was first launched. Initially, Spatial NI ran on just two servers; now there are over sixty, all load balanced to meet demand and ensure reliable performance for large numbers of users. Spatial NI currently handles 24 million large-scale base mapping interactions per month and 9 million address searches per year.
20,000 public sector employees have access to Spatial NI on their desktops through the Northern Ireland Mapping Agreement and can simply click on an icon to pull accurate geospatial data into their applications in a seamless way. Spatial NI currently comprises 213 LPS web services plus a further 118 external web services from other government bodies. In addition, there are over 30 active applications, driven by Spatial NI, that have been developed by six government departments.
Members of the public can also explore Spatial NI via a public viewer that is free to use. Each month, over 7,000 people use the pubic viewer, around 50% of whom are new users. Spatial NI gives everyone easy access to information on everything from flooding and the natural environment to winter gritting routes and computer scams. Following recent enhancements, the platform now provides Unique Geographic Identifiers within large-scale maps that make it easier for people to link up data sets and monitor changes in data.
Spatial NI facilitates an enterprise-standard exchange of near real-time spatial data, leading to a consistent, faster and more efficient service for all customers.
Sean O' Boyle - Asset Information Development Manager, Northern Ireland Water
The Benefits
Spatial NI is now widely used within local and central government in Northern Ireland, as well as by utilities, commercial businesses, not-for-profit organisations and the general public. It delivers a wide range of benefits including:
Substantial efficiency improvements
The Education Authority has built an application that utilises services hosted on Spatial NI, enabling parents and guardians to check to see if their children are eligible for school transport. 78% of all online applicants received an immediate decision on whether their child is eligible for school transport. Previously, the paper-based process took 3-6 weeks for parents and guardians to be informed of a decision. It frees up staff to focus on delivering other important educational services and provides fast, accurate information for parents and guardians.
More transparent government
The Department of Finance has used Spatial NI to communicate draft commercial property valuations to business owners in a far more transparent way than was previously possible. During Reval2020, business owners could use a dedicated web app to see their property valuation and compare their valuation to those of other similar business properties nearby. The solution improved customer service, by giving business owners the ability and the time to check their valuations and raise any queries with LPS before business rate charges were finalised.
Improved public services
The Department of Infrastructure has used the platform to develop a range of apps that allow citizens to report pot holes or broken street lights online and monitor the resolution of the fault. “In many ways, Spatial NI has been an enabler and a catalyst for innovation within government,” says Jim Lennon, Chief Survey Officer at LPS. “Several government departments have used Spatial NI to deliver efficient new services for the public.”
Agile responses to emergencies
As was demonstrated during the COVID-19 crisis, Spatial NI gives the government the ability to launch new public information services very quickly in an emergency. When the Department of Health needed to inform the public about local restrictions, it was able to launch an app on Spatial NI in under two days, showing restrictions by postcode. In the first three days alone, this public health app received 54,000 views, providing clear information about where local restrictions applied.
Effortless data management
Organisations in Northern Ireland can now consume up-to-date data directly from Spatial NI. For example, Northern Ireland Water uses Spatial NI to make accurate mapping, digital terrain model (DTM) data and aerial photography available to its office-based and mobile staff. According to Sean O’Boyle, Asset Information Development Manager at Northern Ireland Water, “Spatial NI facilitates an enterprise-standard exchange of near real-time spatial data, leading to a consistent, faster and more efficient service for all customers.”
Better access to public records
The Spatial NI public viewer helps to make government data more open and improves access to public records. Indeed, 26,000 users a year refer to the historic maps from the Public Records Office Northern Ireland on Spatial NI, with the platform supporting 54,000 sessions a year for historic maps alone. People can use this facility to trace their ancestry, better understand the history of their homes and help resolve boundary disputes.

Fera Science
ArcGIS will play a pivotal role in helping the Government and other landowners to protect Britain’s countryside and agriculture industry from a deadly plant disease.
Amid concerns about the possible emergence of a deadly new plant disease, Fera Science has created an ArcGIS app and dashboard to enable horticulturalists to coordinate thousands of plant and tree inspections nationwide. Use of this sophisticated solution is expected to help the Government contain the spread of the disease and safeguard Britain’s natural environment.
Inspectors will use an ArcGIS mobile solution to gather location-referenced plant samples, plant health data and images in the field
Government agencies and other stakeholders will trace the spread of the disease and monitor inspections on an Esri dashboard
Esri UK’s Professional Services group developed Python scripts to automate and streamline the complete test and trace process
The Challenge
One of the most damaging plant bacteria ever identified is spreading in countries around the world. Called xylella fastidiosa (Xf), it has been detected in France, Spain, Italy and Portugal and, if it were to gain a foothold in the UK, it could affect dozens of plant species, including elm, plane and oak trees.
Under current legislation, if Xf is detected in the UK, all host plants within 100 metres must be destroyed and host plants within a 5 km radius must be inspected and tested. This means that plant inspectors from the Animal and Plant Health Agency (APHA), an executive agency of the Department for Environment, Food and Rural Affairs (DEFRA), could need to inspect over 18,000 plants for each confirmed case of Xf, anywhere in the country.
With the number of confirmed cases of Xf in mainland Europe increasing all the time, APHA realised that it would need to find a fast and effective way to establish inspection zones around ailing plants, conduct and record host plant inspections on the ground and monitor the spread of Xf. The faster it could detect infected plants, the faster it could react to limit the potentially devastating impact of the disease.
“The ArcGIS-based system we have developed will help the Government to react quickly to detect, trace and contain the disease.”
Lee Butler, GIS Specialist, Fera Science
The Solution
Working with APHA, Fera Science has used Esri’s ArcGIS platform to develop a complete end-to-end solution to support plant inspections, including testing plant samples and tracing of the spread of the disease.
When a first case of Xf is detected in the UK, a geoprocessing model, developed using Esri’s ModelBuilder, will create the initial inspection zone around the plant, divided into 100 metre and 1 km grid squares. Inspectors will then use an intuitive app, created with Esri’s Collector for ArcGIS, to view interactive maps of their assigned inspection grids, on their mobile devices, and inspect up to 50 host plants in each square. They will collect a sample from each plant, put the sample into a bag with a barcode and use the Collector app to record the barcode, together with the location of the plant, plant health observations and pictures.
When laboratories test the samples, the results will be recorded against the barcodes and uploaded via a web portal to ArcGIS. Python scripts, developed by Esri UK’s Professional Services team, will combine the test results with the data collected in the field and categorise each plant as either diseased, free of disease or inconclusive test. All the data will then be visible on an Esri Operations Dashboard, enabling APHA, DEFRA and other key stakeholders to view the locations and health of each inspected plant in near real time. Whenever a new positive result is recorded, the surrounding inspection zones will be automatically created, allowing inspectors to start collecting new samples straight away.
“The ArcGIS solution can support hundreds of inspectors doing thousands of plant inspections each week.”
Lee Butler, GIS Specialist, Fera Science
Benefits
Rapid response to a potential disease
Using ArcGIS, Fera Science has been able to create, test and deliver a functioning solution for APHA very quickly that can be put into action as soon as it is needed. As yet, Xf is not thought to be present in the UK, but, if it is detected here, plant health inspectors will have the necessary tools to respond. Lee Butler, GIS Specialist at Fera Science, says, “The ArcGIS-based system we have developed will help the Government to react quickly to detect, trace and contain the disease.”
Fast, efficient inspections in the field
The ArcGIS-driven test and trace process is fast and highly efficient, compared to APHA’s previous paper-based method of doing plant inspections in the field. “In an Xf outbreak, regulations stipulate that as many as 18,960 new plant inspections need to be undertaken each time an infected plant is identified,” says Butler. “It would be very difficult for existing systems to record and handle this volume of data. The ArcGIS solution can support hundreds of inspectors doing thousands of plant inspections each week.”
Real-time data to trace the spread of disease
If Xf is detected in the UK, APHA will be able to see near real-time data on diseased plants and their locations, all around the UK. The ArcGIS dashboard presents the data in a spatial, map-based format that is simple to understand at a glance, enabling people to trace the spread of the disease very easily. Users can see which grid squares have been inspected, monitor the progress of inspections and identify where best to allocate resources based on the latest test results.
Effective collaboration of many stakeholders
The ArcGIS solution can be used by multiple stakeholders, not just APHA. Therefore, in the case of a major outbreak of Xf, inspectors from other organisations and landowners, such as the Forestry Commission, could use the Collector app on their own mobile devices to collect standardised data and samples in a coordinated approach. Other organisations can also be given access to the same Esri dashboard enabling them to collaborate more effectively with APHA and implement joined-up strategies to detect and eventually eradicate the disease from the UK completely.