Blog Archives

Serco
With the support of Esri UK’s Professional Services team, we have built a suite of ArcGIS mobile, desktop and web-based apps that are helping Peterborough City Council to realise substantial cost savings and efficiency improvements.
Serco is delivering tens of thousands of pounds in savings for Peterborough City Council, following the development of a suite of mobile, web-based and desktop ArcGIS solutions. Across multiple departments, council employees are now saving time, collaborating effectively and working more productively in the field to deliver high quality services for citizens.
Peterborough City Council saves money by sharing data more effectively across the organisation.
The council's field-based employees save time by collecting data electronically via mobile devices.
Serco develops tailored apps, drawing on new skills learned from Esri UK's Professional Services Team.
The Challenge
As Peterborough City Council’s appointed supplier for outsourced ICT services, Serco is constantly implementing new initiatives to improve the quality and cost efficiency of the council’s services for citizens. Many of these initiatives are focused on improving single business processes or introducing new services. However, when Serco decided to upgrade the council’s legacy geographic information system (GIS) technology, it quickly recognised that this particular IT project could deliver significant business improvements across the whole council.
At the time, Peterborough City Council used GIS in several departments, both for operational management and for strategic data analysis, but its existing GIS system didn’t have the flexibility to adapt easily to new requirements and could not be used on mobile devices. Notably, the legacy system could not be tailored to meet the needs of specific groups of users, so council employees often found it too complex and needed frequent support from the GIS team.
“Working with Esri UK’s Professional Services team put us a step ahead on our learning curve and enabled us to roll out a wide range of cost-saving applications for Peterborough City Council very quickly.”
Tim Newcombe, GIS Business Manager, Serco
The Solution
Working with Peterborough City Council’s GIS users, Serco drew up an extensive list of requirements and selected Esri’s ArcGIS platform following a detailed evaluation of competitive products. Then, Serco appointed Esri UK’s Professional Services team to undertake the implementation of ArcGIS, including setting up servers and integrating ArcGIS with property gazetteers. “Esri UK took on responsibility for getting the ArcGIS platform up and running, which gave us complete peace of mind,” says Tim Newcombe, GIS Business Manager at Serco. “With something as ubiquitous as GIS, everything has to be put together in the right order, in the right way, and this can take a considerable amount of time. Esri UK knows how to set it up in an optimum way and how to do it quickly.”
Serco subsequently also engaged two of Esri UK’s Embedded Product Specialists to provide hands-on assistance with building web apps and solution templates. “Working with Esri UK’s Professional Services team put us a step ahead on our learning curve and enabled us to roll out a wide range of cost-saving applications for Peterborough City Council very quickly,” Newcombe says. “Even when they weren’t on site, I could email the Embedded Product Specialists and they came back to us quickly with answers.”
Using the knowledge and skills it acquired from working alongside the Embedded Product Specialists, Serco delivered thirteen ArcGIS apps for Peterborough City Council in just twelve months. These apps included ArcGIS mobile, desktop and web-based solutions, which transformed processes in multiple council areas, ranging from managing demand for health services to recording drainage assets and analysing archaeological finds.
“Now we can give teams, and even individual employees, exactly the functionality they need to do their jobs, so they can work more productively.”
Tim Newcombe, GIS Business Manager, Serco
Benefits
£15,000 cost saving from just one app
The ArcGIS web apps that Serco has developed have automated manual tasks and streamlined processes to create significant cost savings for Peterborough City Council, estimated at tens of thousands of pounds. In one pivotal project, Serco has delivered an ArcGIS web app to improve the exchange of information between the land charges team and highways team. This ArcGIS-led process alone has removed over 15 hours of manual paperwork per week and is, as a consequence, expected to deliver annual savings of £15,000.
More efficient data collection in the field
Several of Serco’s ArcGIS apps have created tangible time savings for council employees working out and about in the city. For example, one app, based on Collector for ArcGIS, enables planners to gather detailed property information for the council’s Local Development Plan far more quickly, in the field, improving the efficiency of the local planning process. Another mobile ArcGIS app allows the council’s drainage team to check and edit the locations of culverts in the field, improving the accuracy of council data and removing the requirement for information to be transferred manually from paper to screen.
Improved collaboration with partners
The flexibility of ArcGIS allows Serco to create web apps to support specific projects and improve collaboration with partners. For example, it has created a web app that enables Peterborough City Council to share information about mineral and waste sites with the local county council, parish councils, landfill owners and waste services suppliers. Serco has also produced an Esri Story Map that presents opportunities to regenerate Peterborough, create a circular economy and improve sustainability. This Story Map will be shared with local businesses and citizens to help build a shared a vision for the future of the city.
Enhanced employee productivity
Most significantly, Serco has been able to improve the productivity of specific teams, by giving them access to web apps that are tailored precisely to their needs. “The ability to construct an app for a specific group of users, and roll it out quickly, is a real benefit of ArcGIS,” says Newcombe. “Before, there was one GIS system that did everything for everyone, but it was overwhelmingly difficult for most council employees to use. Now we can give teams, and even individual employees, exactly the functionality they need to do their jobs, so they can work more productively. We also have fewer support calls to the GIS team as a result, saving us as much as half a day a week.”


Highways England
We are saving money, creating operational efficiencies and delivering better customer experiences by using ArcGIS to share information between teams.
In less than two months, Highways England developed an Esri ArcGIS web app in-house that gives its 4,700 employees a clear visual picture of all current and planned roadworks. The solution is now creating cost savings and operational efficiency improvements for Highways England, while at the same time improving journeys for road users and providing more transparent information for partners.
Highways England improves its operational efficiency with better insights into planned works
Road users experience less travel disruption, leading to improvements in customer satisfaction
Partners collaborate more effectively on regional road improvement schemes
The Challenge
Every year, Highways England manages hundreds of separate projects along 4,300 miles of motorways and A-roads, ranging from day-to-day maintenance to major road widening, bridge strengthening and tunnelling schemes. These projects are managed and undertaken by different specialist teams across multiple directorates.
Employees typically had no visual overview of the road projects that teams in other directorates were planning and no easy way of discovering where and when these projects would take place. As a result, it was difficult for them to coordinate their activities and schedule roadworks optimally to take advantage of potential cost efficiencies, as well as minimise inconvenience for road users.
“We built the solution, by ourselves, without needing any expensive or time-consuming software development, and that is something that we are very proud of.”
Chris Spencer, South East Lead for Intelligence and Performance Analysis, Highways England
The Solution
To address this challenge, Highways England decided to develop a map-based app to display all current and planned roadwork projects, from all directorates and all six regions of England. Starting in the South East Region, the organisation used Esri’s ArcGIS Desktop solution to plot the locations of roadworks on interactive maps and include relevant project details. It also used ArcGIS Desktop to draw in roadworks along the actual curved shape of roads and added a time-slider function to allow users to view projects by date.
After developing this prototype solution, Highways England seconded one member of staff to the project from each of its six regions, for just one month, and the app was expanded to include all current and planned roadworks across all directorates for the whole of England. At the end of the month, the solution was published on ArcGIS Online using ArcGIS Web AppBuilder and made available to key teams in all regions. A simplified version of the app was also produced, with reduced functionality, and published on Highways England’s intranet using ArcGIS Enterprise where it can be viewed by all of the organisation’s 4,700 employees. The launch of the solution received very positive feedback, with one user commenting that, “It is probably the most useful thing I have received in eleven years at Highways England.”
Critically, the development of this solution was entirely cost neutral, as it was built in-house by Highways England’s own staff using the organisation’s existing ArcGIS license. “All the tools we needed for our solution were provided out-of-the-box as part of ArcGIS,” says Chris Spencer, South East Lead for Intelligence and Performance Analysis at Highways England. “We built the solution, by ourselves, without needing any expensive or time-consuming software development, and that is something that we are very proud of.”
“ArcGIS is transforming the way that Highways England shares information internally and creating opportunities for significant cost efficiencies.”
Chris Spencer, South East Lead for Intelligence and Performance Analysis, Highways England
Benefits
Multimillion pound cost savings
The ArcGIS web app gives Highways England a clear oversight of all current and proposed projects, across all directorates, for the first time, which enables teams to better understand the wider implications of different schemes. Using the solution, employees identified that planned works to improve technology on an A-road in Berkshire would be rendered unnecessary by other traffic management initiatives that were being introduced on other neighbouring roads by different teams. As a result, Highways England was able to cancel the technology project, making an internally-verified cost saving of £13 million.
Ongoing operational efficiencies
Highways England now expects to be able to make ongoing operational efficiencies by using the ArcGIS web app to schedule programmes of work much more effectively. For example, in one recent initiative, Highways England saved £250,000 by rescheduling line-painting on a section of the M4 so that it could take place when it was due to be resurfaced later that year. “ArcGIS is transforming the way that Highways England shares information internally and creating opportunities for significant cost efficiencies,” Spencer says.
Reduced disruption for road users
Use of the new ArcGIS web app is also proving instrumental in helping Highways England to minimise unnecessary disruption for road users. In the example above, the decision to reschedule line-painting on the M4 avoided the need for two sets of road works on the same stretch of motorway and therefore reduced inconvenience for customers. Spencer comments, “Many factors influence people’s experience on the roads, but I believe our use of this ArcGIS web app will contribute to improvements in the experience had by road users and, in time, improve Highways England’s KPIs for customer satisfaction.”
Effective collaboration with third parties
Highways England can now work more transparently and effectively with partners, by giving them access to its ArcGIS web solution. For instance, in the South East Region, Highways England is using the ArcGIS web app to share information with the Kent Corridor Coordination Group, a partnership with Kent County Council, Medway District Council and other local organisations. The partners use the app to take into account Highways England’s plans when scheduling smaller roadworks on nearby B roads or in urban areas and planning diversion routes to improve traffic flow around the local area.
Improved health and safety on the roads
Over time, Highways England expects its use of the ArcGIS web app to contribute to improvements in employee health and safety from fewer roadworks. “Safety is a number one priority for Highways England,” Spencer explains. “When we avoid the need for works or combine works together, we reduce the number of days when workers are exposed to danger on the road. When we reduce time on roads, we reduce risks.”

Dublin Airport
Our expanding use of ArcGIS throughout Dublin Airport is helping us to operate efficiently, improve the management of airfield risks, comply with aviation industry regulations and make better informed decisions to give passengers a safe and positive experience.
At the busiest airport in the Republic of Ireland, Esri’s ArcGIS is being deployed as part of a wide-ranging digital transformation initiative to enhance the passenger experience. The use of ArcGIS on mobile devices, on interactive management dashboards and for complex analysis is leading to improvements in operational efficiency, risk management and safety throughout the airport.
Field-based employees use ArcGIS mobile solutions to check the conditions of 1,700,000m² of airfield
Pavement managers use Esri dashboards to monitor maintenance activities in real time
Analysts use ArcGIS and AcrPro to gain a deeper understanding of critical issues, including runway usage
The Challenge
Dublin Airport is the busiest airport in the Republic of Ireland. Operated by daa, it welcomed 31.5 million passengers in 2018, and handled more than 2,300 flights every week. To provide a safe and positive experience for passengers, the airport’s employees need to work together to manage and maintain 35,000 assets, with a replacement value of €4 billion, as well as collect, share and analyse a vast amount of operational data.
“ArcGIS gave us the platform we needed to connect systems, give all our employees a single view of the truth and empower them to work more efficiently and flexibly all around the airport.”
Neil Moran, Head of Digital Asset Management & Transformation, Dublin Airport
The Solution
Dublin Airport decided to introduce geospatial information system (GIS) solutions and selected Esri’s ArcGIS following a successful pilot. It then began to roll out a succession of mobile, desktop and web-based GIS applications to transform processes and build incremental business value. “Our aim was to think big, start small and work fast,” says Neil Moran, Dublin Airport Head of Digital Asset Management & Transformation. “ArcGIS gave us the platform we needed to connect systems, give all our employees a single view of the truth and empower them to work more efficiently and flexibly all around the airport.”
Now, field-based employees use a range of ArcGIS mobile solutions to access, collect and upload information and photographs from mobile devices. Airfield inspectors use Collector for ArcGIS to check the condition of 1,700,000 m2 of airfield, while maintenance teams use ArcGIS Portal to access asset information and download repair manuals in the field, to help them rectify faults more quickly. Other airport workers use Survey 123 for ArcGIS to record safety incidents, such injuries to baggage handlers, and collect all pertinent details in real-time, on their mobile devices.
Dublin Airport also makes extensive use of Esri Dashboards to provide managers with a clear overview of the status of activities, in real-time. For example, pavement managers use an Esri Dashboard on which completed, scheduled and outstanding repairs are all displayed ‘live’ on a single screen, coloured coded in green, amber and red. “Esri Dashboards put real-time information into managers’ hands and provide valuable insight into the airport’s operations, risks and performance, which we can use to make faster, well-informed decisions,” says Morgan Crumlish, Dublin Airport Spatial Data Manager.
In addition, Dublin Airport uses Insight for ArcGIS and ArcPro to analyse data and gain deeper understanding of critical issues, including runway and taxiway usage and timings. These tools play a key role in supporting decision making on everything from the future expansion of the airfield to contingency planning. For example, ArcPro has recently been used to analyse ways to transport key members of staff to work following heavy snowfall, to improve the airport’s ability to remain operational during winter conditions.
“Esri Dashboards put real-time information into managers’ hands and provide valuable insight into the airport’s operations, risks and performance, which we can use to make faster, well-informed decisions.”
Morgan Crumlish, Spatial Data Manager, Dublin Airport
Benefits
Increased operational efficiency
The use of ArcGIS at Dublin Airport has created significant time savings, by making it easier for teams to collect, share, understand and act upon new information. When asset faults are identified on the airfield, detailed information and images can be collected swiftly using ArcGIS on mobile devices. The data is transferred instantly and digitally to the maintenance team, where jobs are prioritised and scheduled. Managers can then monitor outstanding and completed jobs on their Esri Dashboard, in what is an integrated and highly efficient end-to-end process.
Improved health and safety
Dublin Airport can now record safety incidents very promptly and utilise this information to drive health and safety improvements. For example, if an incident occurs on an escalator, employees can capture the relevant environment conditions and, where appropriate, add witness statements using Survey 123 for ArcGIS. This data can be analysed in ArcGIS, alongside historical data about previous incidents, to identify high risk areas, inform safety improvement opportunities and protect the company against erroneous claims.
Reduced risks in the airfield environment
Using ArcGIS, Dublin Airport is able to reduce risks on the airfield through better monitoring of potential hazards, like laser activity and wildlife incursions. For example, the airport is starting to track all wildlife incidents airside following learnings from colleagues using Esri technology for similar solutions across Europe. With this new insight, airport employees have been able to employ bird management techniques, such as hawk kites and eagle soundtracks, in precisely the right locations to improve safety for passengers.
Effective compliance with industry regulations
In a new initiative, Dublin Airport and third parties are using ArcGIS to develop solutions to assist in the monitoring of runway, taxiway and apron loading at the airport to ensure and demonstrate compliance with aviation industry regulations. When fully implemented, an ArcGIS Dashboard will display live data, indicating where sections of the airfield have been subjected to excessive loading, and alert managers when thresholds are reached, so that inspections can be prioritised.
Meaningful insight for future business planning
Using Insights for ArcGIS, managers can now undertake analysis of large volumes of data and gain accurate information with which to make better decisions about the future of Dublin Airport. Following passenger growth of 51% from 2013 to 2018, Dublin Airport plans to use ArcGIS to enhance passenger wayfinding, maximise route efficiency and present commercial opportunities, while minimising bottlenecks and improving the overall customer experience.
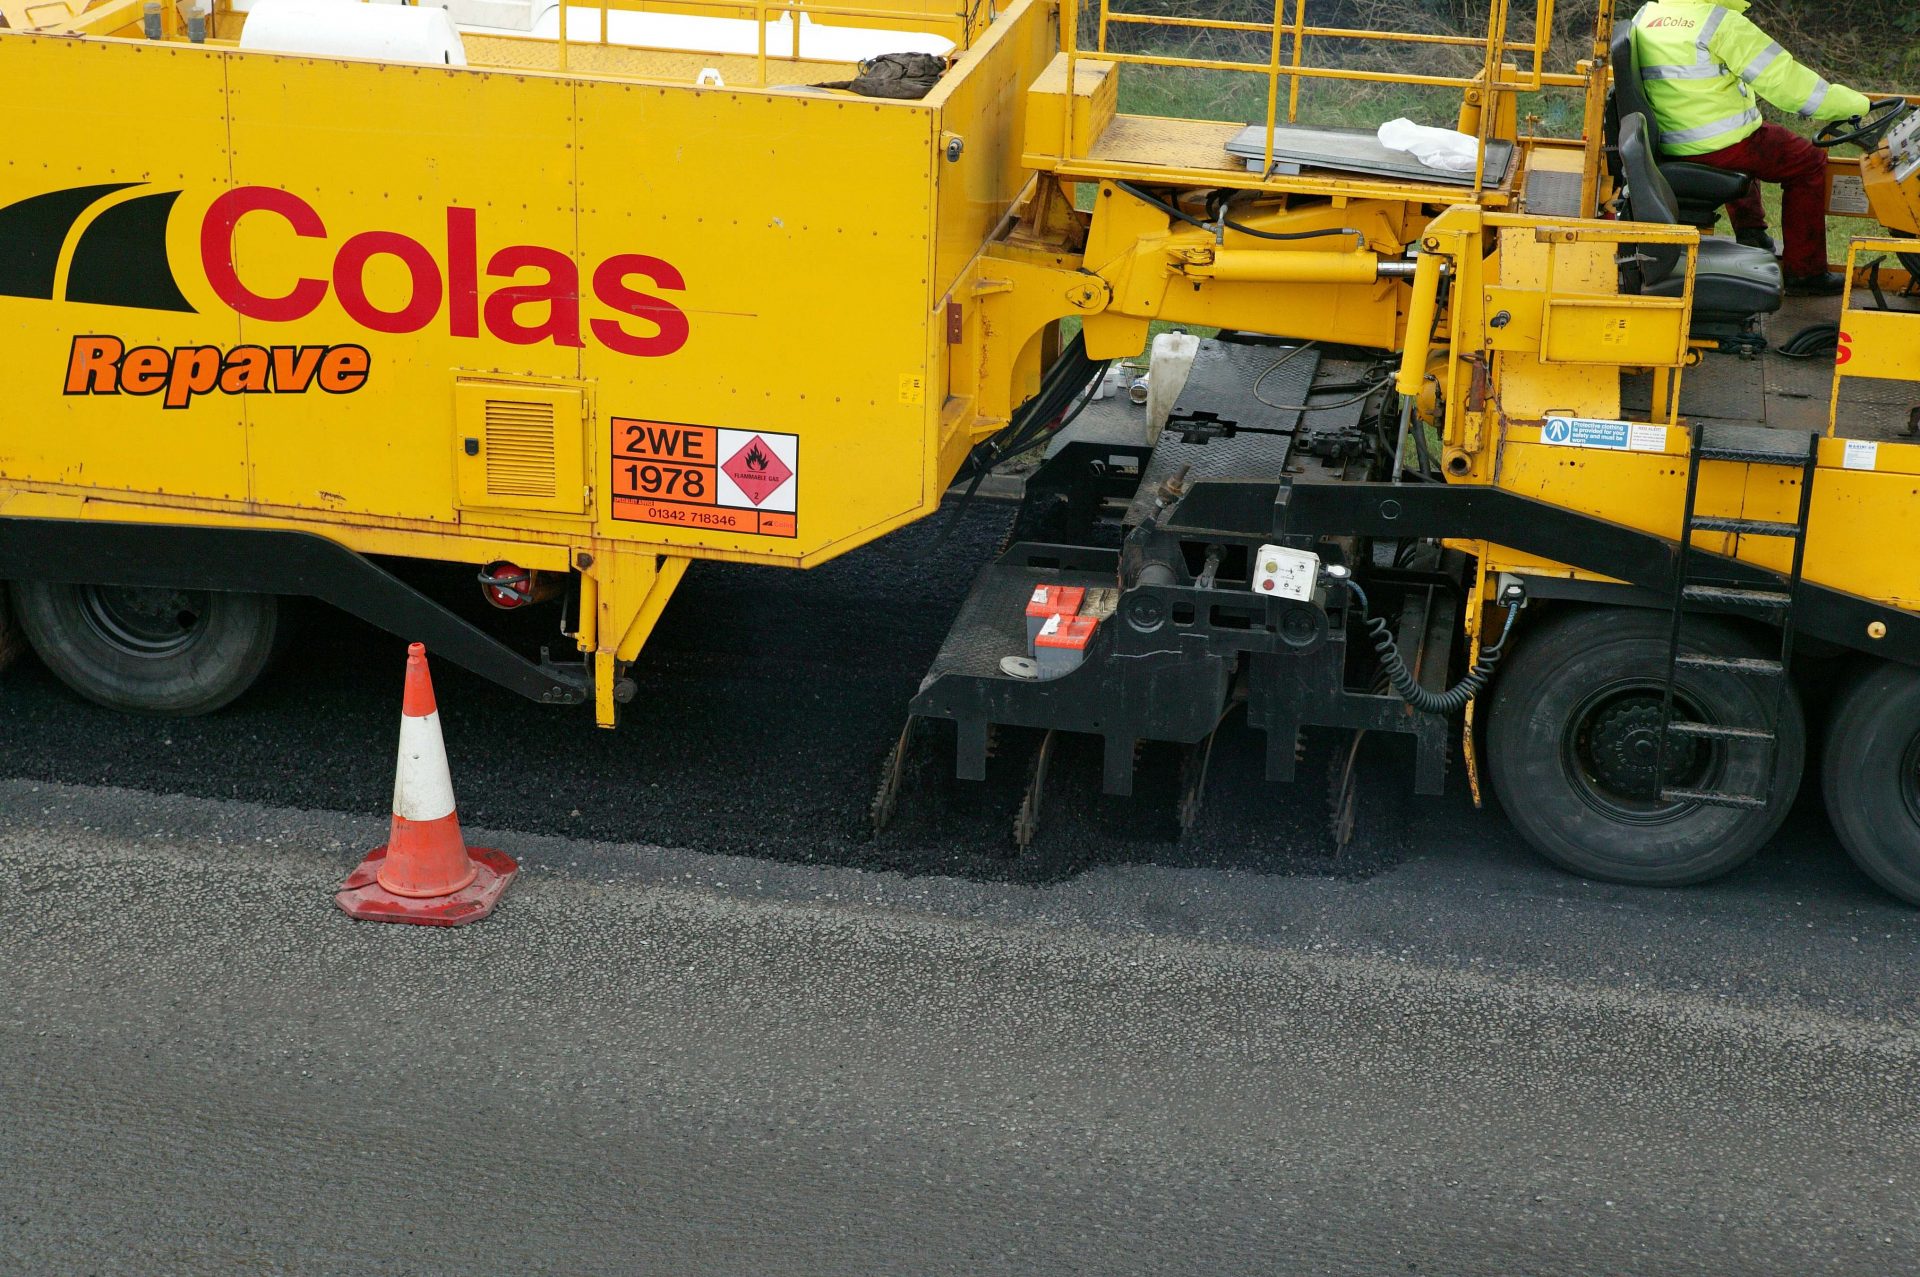
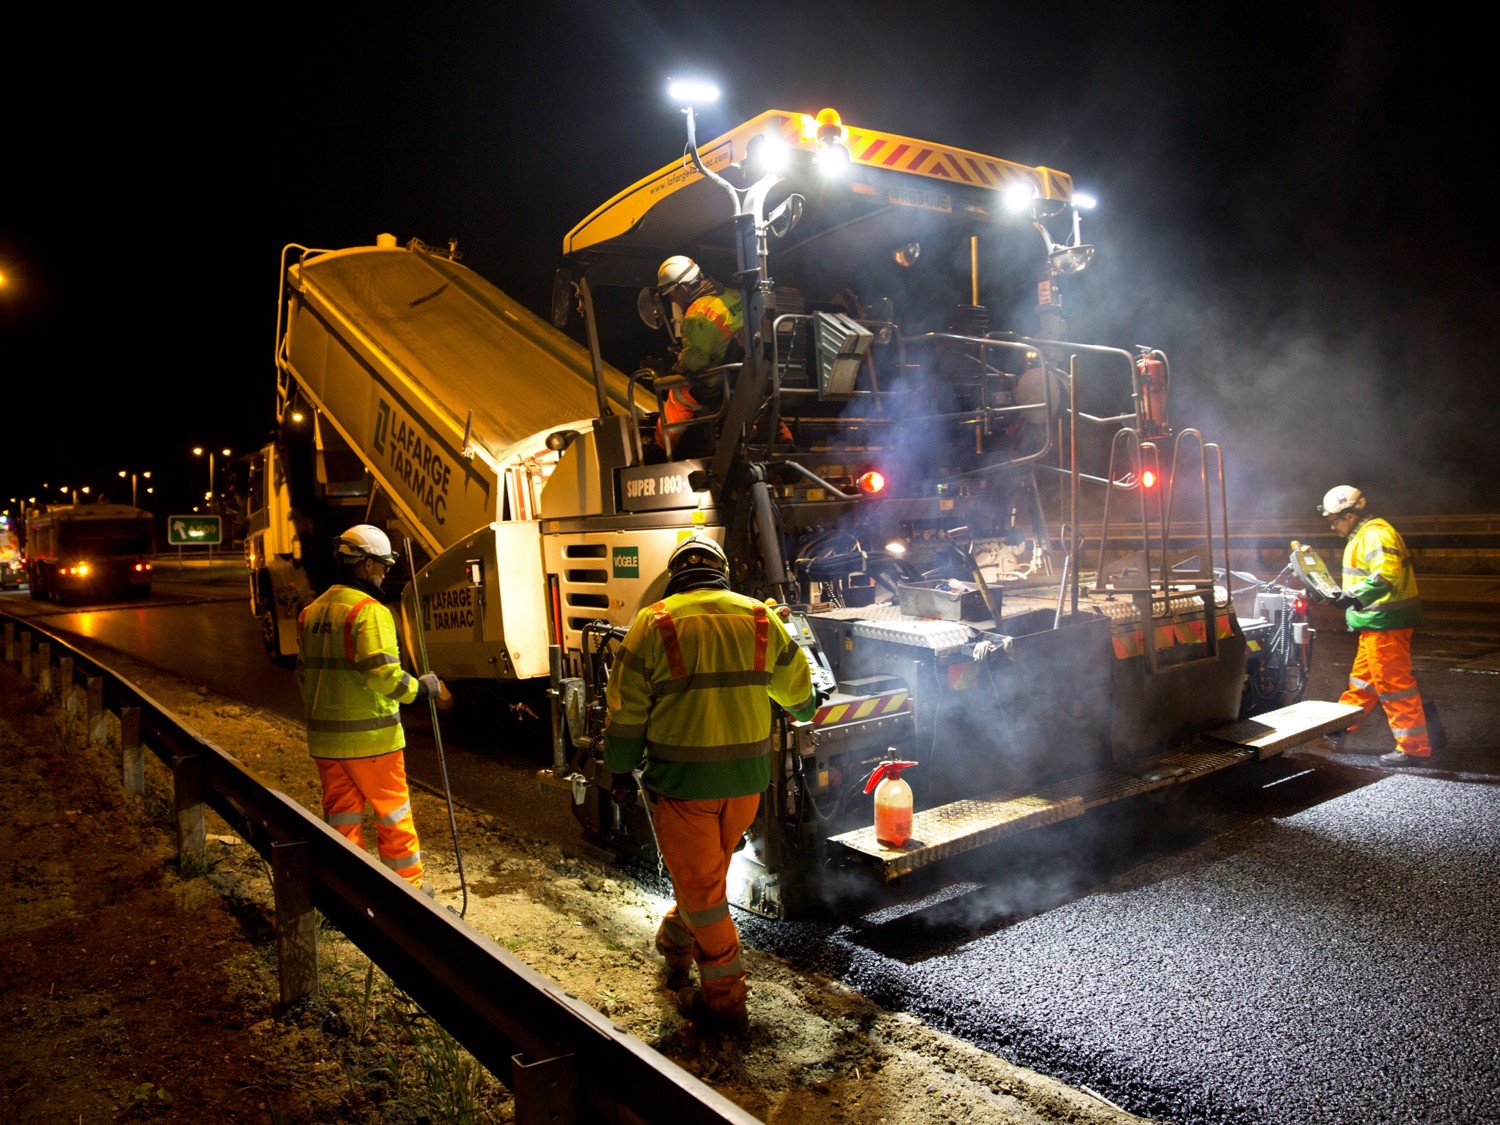
Colas Ltd
The highway maintenance company Colas has deployed Esri’s ArcGIS Online product to help it deliver versatile and mobile GIS capabilities to its field-based personnel. This web-based solution is enabling employees to work more efficiently and make better informed decisions when assessing road damage caused by vehicle accidents.
Colas works closely with Local Authorities and the Highways Agency delivering innovative and intelligent highway maintenance solutions. With over eighty years of expertise, the company has continued to successfully secure and maintain a range of highway term maintenance contracts. Colas was one of the first service providers to successfully manage up to 33% of the UK’s trunk road and motorway network.
In 2004, Colas was the first ever organisation to be appointed a ground-breaking highway PFI contract, for highway and street maintenance in Portsmouth for a period of twenty five years.
Improves efficiency, by allowing employees to view and edit data in the field
Aids decision making by giving field personnel instant access to asset data
Supports better collaboration, while minimising the need for printed maps
The Challenge
Colas is constantly exploring ways to improve its business processes. Having rapidly developed its use of Esri GIS, rolling-out ArcGIS for Server and ArcGIS Explorer, the natural next step was to make GIS more widely available across the company.
“We wanted to bring our GIS strategy up to date and give staff access to Esri GIS over the web on any device, either in the office or on the move,” explained David Piesse, GIS Technician, Colas Limited. “We needed a streamlined approach and one that didn’t need a lot of man hours to get it working or extra programming to create new mobile apps.”
The Solution
ArcGIS Online was selected by Colas to extend the use of GIS across the business and out into the field. Operating seamlessly with its existing Esri investments, the cloud-based system easily increases the reach of Colas’ GIS so it can be used anywhere, by anyone.
“ArcGIS Online is simple to use as the integration with ArcGIS for Server is completely automated. We can view and edit live map data in the field, on iPads or smartphones and don’t need to manually update data when staff return to base,” said Piesse. “Creating new apps for use on mobile devices, for an ad-hoc road survey for example, is also very straightforward and only takes about an hour.”
ArcGIS Online is simple to use as the integration with ArcGIS for Server is completely automated. We can view and edit live map data in the field, on iPads or smartphones and don’t need to manually update data when staff return to base
David Piesse – GIS Technician
The Benefits
The new approach has not only transformed the way mobile teams operate but is also creating more efficient ways of working for office staff too.
A prime example of how it makes life easier for field personnel is when they perform road surveys, prior to any maintenance or resurfacing work. Teams now simply record the highway condition using the ArcGIS app on an iPad, in real-time. This streamlined data collection process has also significantly improved data accuracy, due to fewer steps being involved compared to the previous use of paper maps. Digital photographs are also simply attached to the map at specific locations to help explain any defects.
The Colas teams that respond to road accidents have also had their work practices upgraded by ArcGIS Online. Real-time access to mapping on Windows 7 smartphones means they can instantly see what falls under Colas’ responsibility when assessing highway damage at an incident. Now they have the added confidence they are working with accurate data on boundaries, utilities and other features, which might have an impact on their course of action.
ArcGIS Online also allows office staff to work with GIS in other ways, freeing them from their desktops. Now they can collaborate and share map data on iPads instead, which also eliminates the need to print out paper maps. “ArcGIS Online helps fulfil all of our nonstandard requests for mapping – when a map is needed out on site, for remote working at home, in a depot or at a supplier meeting, for example,” said David.
This has made office-based staff realise GIS is not just about a paper or desktop map but rather a dynamic and interactive resource, as David continued: “Shifting people’s perception of GIS is key to ensuring its true benefits are realised and this is happening through ArcGIS Online. By using tablets or smartphones, boundaries are removed and staff are having their eyes opened to new ways in which GIS can support the business and help them make better decisions.”
Future plans at Colas include using ArcGIS Online to roll-out GIS to every member of its 400 office staff across 22 UK locations, plus the integration of ArcGIS Online into the organisation’s asset management system for enhanced reporting.
“Introducing ArcGIS Online was a natural evolution within our overall GIS strategy,” concluded David. “It’s simultaneously helping to create a raft of more efficient ways of working and innovative highway maintenance services, which help win new contracts.”
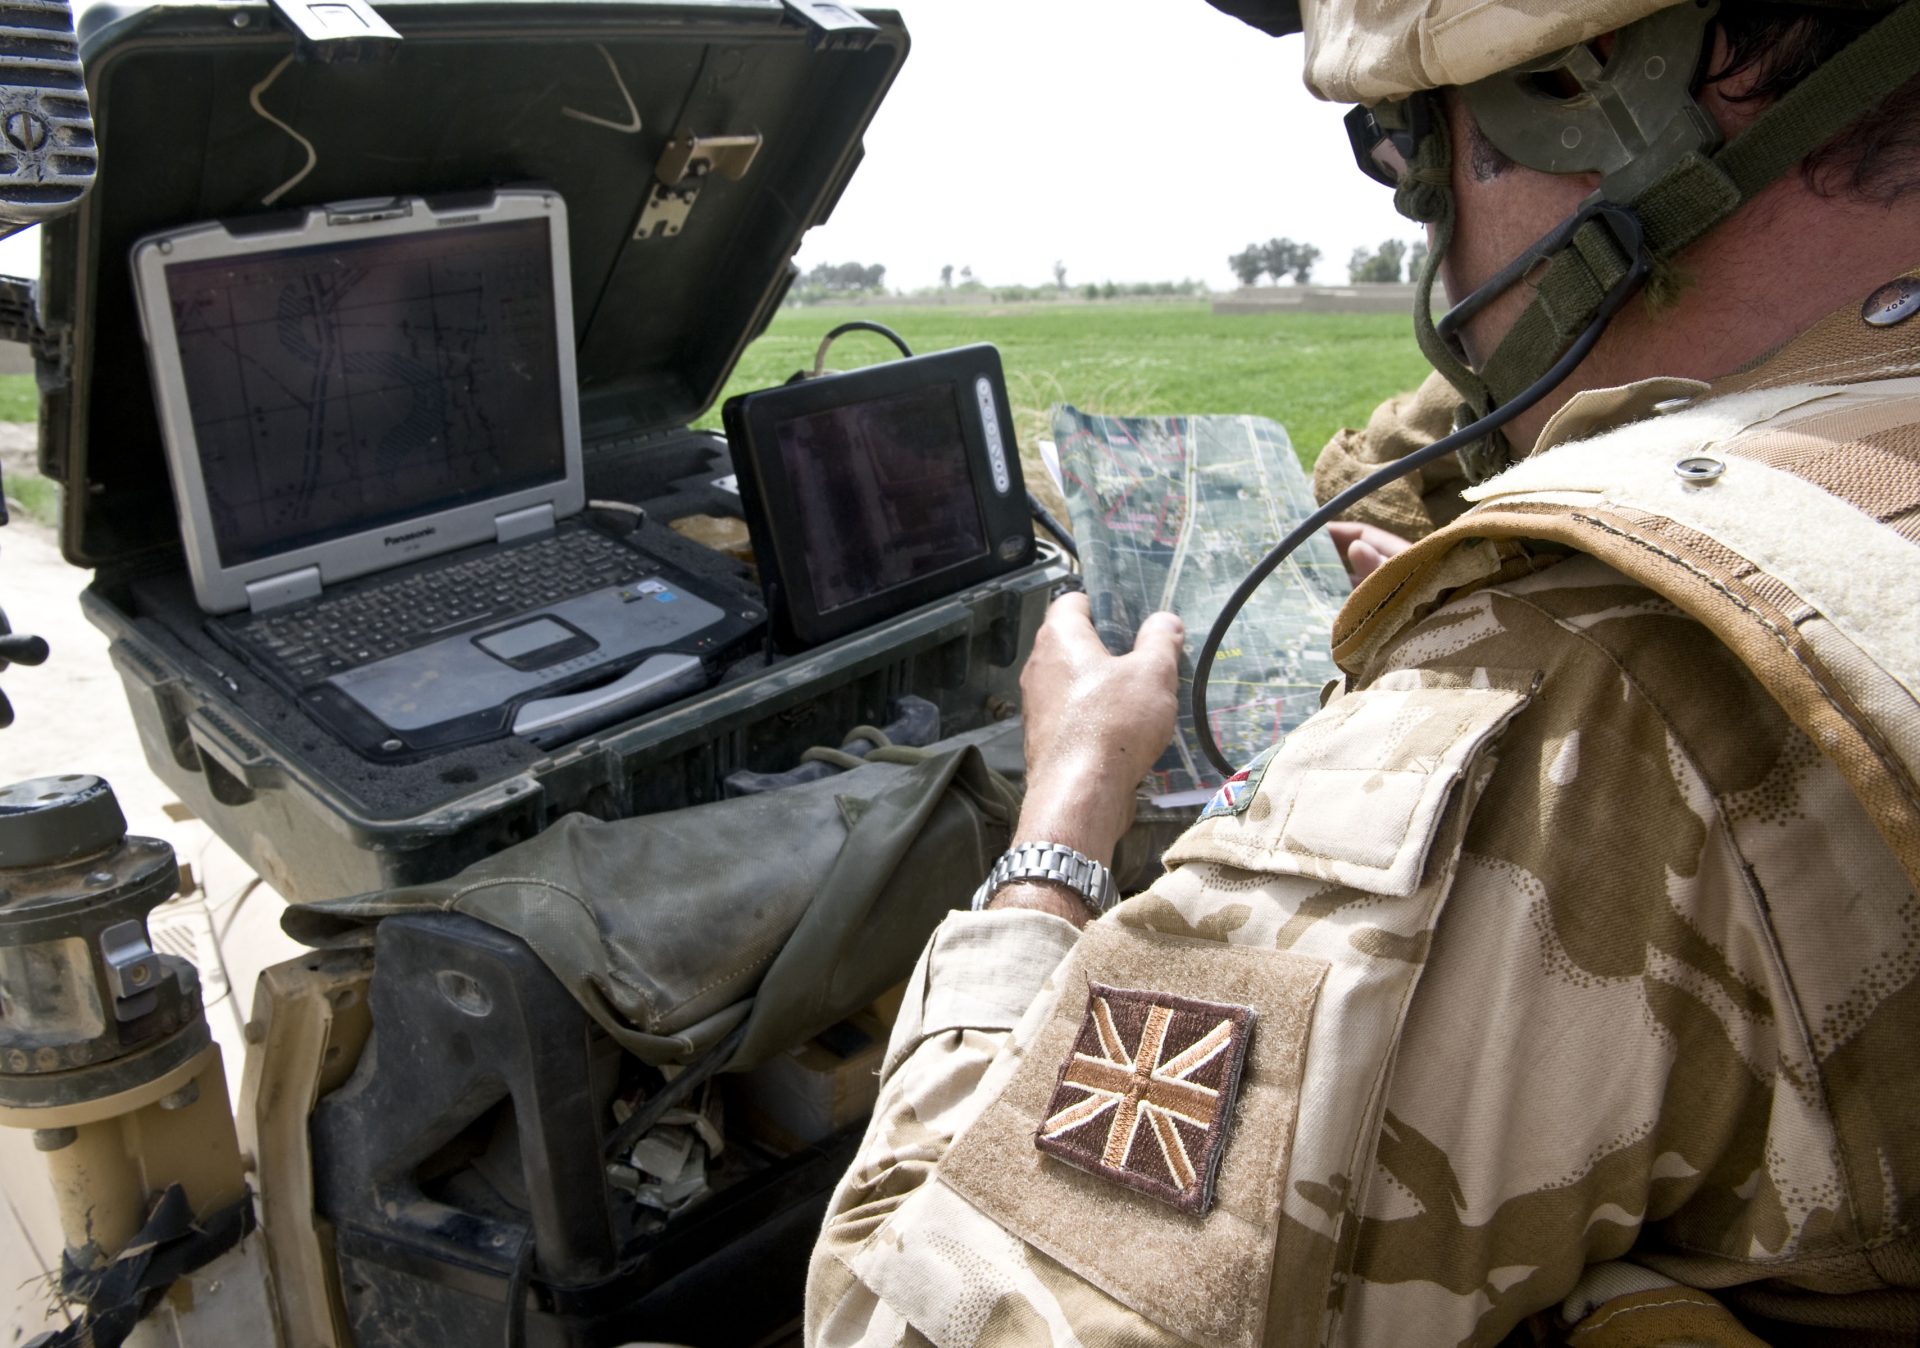
Royal Engineers
Esri’s ArcGIS software has been embedded into an engineering planning and control system, used by the Royal Engineers to help it build bridges, manage minefields and arrange demolitions in combat zones. GIS helps teams to complete tasks more quickly and make better decisions.
The Customer
One role of the Royal Engineers (RE) is to assist land based forces achieve their mission objectives, by maximising their mobility, survivability and sustainability using a wide range of specialist support services such as bridge building, mine clearing and demolition.
Improves situational awareness, contributing to better decision making
Enables tasks and resources to be located with precision, saving time
Promotes greater collaboration and sharing of information
The Challenge
Historically, the RE relied on manual, labour-intensive methods (broadly unchanged since the Second World War) that can be slow, resource intensive and prone to errors.
For example, the surveying and siting of a temporary bridge relied on the skills and experience of the RE using measuring equipment and whatever paper-based mapping was available. However, if the surveying and construction teams did not share the same mapping and positional awareness, the bridge could be constructed in the wrong location or to the wrong specification for the conditions.
The RE sought a new approach to planning and tasking that would achieve greater efficiency and increase its capability to respond effectively to operational demands.
The Solution
MAKEFAST is one of a number of BISAs (Battlefield Information System Applications) designed to operate through the developing BOWMAN communications infrastructure, and uses Esri’s Geographic Information Systems (GIS) technology for the mapping component. MAKEFAST has been developed to provide software tools that replicate existing RE processes: a comprehensive engineering planning and control package for combat engineers, supporting mission-critical tasks such as gap crossing, service provision, minefield management and demolition. It assists with planning, designing, resourcing and construction management and will be integrated and interoperable with other information systems within the land component of any operation.
The GIS component enables engineers to locate tasks and resources with precision, aiding deployment. Detailed overlays can be quickly drawn and shared between HQ and operational staff (in raster and vector format), improving situational awareness and informing decision making from a single, shared view of the task.
A detailed asset inventory is an important new capability: each asset has its own icon in MAKEFAST’s sketching tools, and these can be dragged and dropped onto maps, making it quick and intuitive to create scale drawings and geo-referenced overlays. A gap crossing tool is another feature: it is for accurately calculating the correct span, loadings and therefore equipment requirements.
Benefits
The MAKEFAST BISA has been received very positively in trials. For those responsible for tasking, it speeds up the briefing process while ensuring a clear and accurate picture is provided. For those responsible for deployment, it means greater accuracy in the siting of the right assets for the task, with the potential to save valuable time. Key benefits so far include:
Increased business process efficiency
The mapping component complements the task planning and resource management functions within MAKEFAST by providing a common geographic reference at reconnaissance, tasking, and construction stages. The installed asset can also be more efficiently georeferenced on completion, allowing its position to be more quickly and accurately communicated to end users.
Greatly reduced task time
The ability to clearly visualise a task and more easily share this information via BOWMAN, coupled with MAKEFAST’s improved design and resource ordering capability is expected to significantly reduce task time, in some cases by half. This will have a major benefit on agility and resource availability, allowing the Royal Engineers to better keep pace with operational tempo.
More effective information sharing and communication
In line with other BISAs planned to utilise the BOWMAN infrastructure, MAKEFAST is fulfilling its objective of promoting greater collaboration, sharing of common data and processes, and reducing information silos, thus enhancing overall operational efficiency and effectiveness.

Scottish Water
We have successfully transitioned 1200 GIS users to ArcGIS and empowered them to do their jobs well, thanks to the professional and cost-effective training provided by Esri UK.
When Scottish Water decided to migrate to Esri’s ArcGIS from a legacy GIS system, it appointed Esri UK to deliver a suite of on-site and online training courses. This comprehensive and bespoke training programme enabled 1200 GIS users to transition confidently to new business processes and make optimal use of ArcGIS in their jobs.
Bespoke training enables 1200 GIS users to transition smoothly to new enterprise GIS
Professional trainers give employees the skills to do their jobs effectively
eLearning resources provide long term return on training investment
The Challenge
At Scottish Water, geographic information system (GIS) solutions play a pivotal role in helping the company to deliver 1.34 billion litres of drinking water and take away 847 million litres of waste water, day after day. Over 1200 employees use GIS routinely for everything from handling customer enquiries to planning new infrastructure investment. Consequently, when Scottish Water decided to replace its existing GIS with Esri’s ArcGIS enterprise-wide, it recognised the importance of providing high quality training.
“The transition to ArcGIS marked a big step change for the business in the way that it employs GIS and shares data, across a number of business processes,” says Stuart Hill, Business Change Manager at Scottish Water. “It was critical for the business to ensure that every-day users could be confident in using the new technology from day one. At the same time, it was also important for us to ensure that more advanced users in our IT team had the ability to maintain and support our new enterprise GIS platform.”
The Esri UK trainers were very experienced and had a real passion for the product. They delivered what we were looking for within our tight budget
Stuart Hill, Business Change Manager, Scottish Water
The Solution
First, experienced trainers from Esri UK held workshops and worked closely with representatives from the business to gain a clear understanding of users’ requirements. Then, Esri UK developed courses, training manuals and training documentation using the company’s own data and examples of actual business processes, to make the training highly relevant and meaningful for employees.
Esri UK also created different levels of courses for the company’s 381 desktop users and 868 web GIS users, to cater for different requirements. These included a basic course for employees who predominantly just use the ArcGIS web portal to view and search for data on maps; a standard desktop course for employees who need to perform some data analysis and data editing as a part of their roles; and an advanced desktop course for specialist users, which included instruction on data management and the development of the company’s ArcGIS web portal.
Over a four month period, Esri UK delivered 39 separate training courses, at five different locations across Scotland. For each of these courses, Esri UK supplied laptops for all attendees, pre-loaded with all of the ArcGIS software, business data and examples, so Scottish Water did not have the inconvenience or additional cost of having to prepare, setup and use its own IT resources.
In addition to the face-to-face training, Esri UK also developed a portfolio of eLearning resources to allow employees to acquire skills and knowledge of ArcGIS, at a time to suit them, online. As with the face-to-face courses, this web-based training was designed to meet the training requirements of different levels of user and was fully tailored to reflect Scottish Water’s business processes.
Esri UK’s training programme gave our employees the competence and confidence to use ArcGIS to its full potential and do their jobs to their best ability
Stuart Hill, Business Change Manager, Scottish Water
The Benefits
Smooth transition to a new enterprise GIS
Scottish Water’s employees were able to transition more easily to the new ArcGIS, because the training provided by Esri UK was bespoke to Scottish Water and based on the company’s own business data and processes. “Our employees were better able to understand the training and could embed new skills more quickly, because they were working with data that they were already familiar with,” Hill explains.
Improved return on ArcGIS investment
By providing training at different levels, for different categories of users, Esri UK has helped to ensure that all employees can make optimal use of ArcGIS, whether they are handling customer enquiries, managing assets or developing apps. This, in turn, will help the company to maximise the return that it gains from its investment in ArcGIS. “Esri UK’s training programme gave our employees the competence and confidence to use ArcGIS to its full potential and do their jobs to their best ability,” Hill says.
Flexible and inclusive training options for employees
The combination of classroom-based training courses, at five locations, and online eLearning resources gave the company’s 1200 GIS users a choice of ways to receive training, depending on their preferred learning style and situation. The eLearning resources were particularly ideal for employees based in more remote locations, who didn’t find it easy to travel to attend an on-site course, as well as people who prefer to learn at their own pace. As Hill explains, “The different methods of delivering training helped us to ensure that everyone who needed training, had access training.”
Long term benefits from training investment
Scottish Water will continue to gain ongoing benefits from its investment in Esri UK’s training services for many years to come, as it can continue to use the bespoke eLearning resources to train new employees and existing employees who move into new roles that involve using ArcGIS. Employees who attended training courses can also refer back to eLearning resources to reinforce what they learned in the classroom, helping them to continually develop and advance their skills.
Value for money from experienced trainers
All in all, Hill believes that the training services delivered by Esri UK for Scottish Water were highly professional and cost effective. “Esri UK definitely delivered value for money,” he says in conclusion. “The Esri UK trainers were very experienced and had a real passion for the product. They delivered what we were looking for within our tight budget.”

Costain
ArcGIS is a critical enterprise solution that is helping us to deliver exceptional services for our clients and strengthen our position as a leader in the engineering industry.
The engineering solutions company Costain started out with just a single licence for Esri’s ArcGIS Desktop solution. Now, ArcGIS is a pivotal, enterprise system that is increasing employees’ productivity, improving client services and giving the company a strong competitive advantage.
Road inspectors complete 60% more surveys in a week using ArcGIS mobile solutions
An environment team saves around 18 hours a week with an ArcGIS web app
Contact centre staff respond promptly to maintenance requests using ArcGIS Enterprise
The Challenge
For many years, geographic information system (GIS) technology was little used at Costain. The company had a single licence for Esri’s ArcGIS Desktop application and, from time to time, it used subcontractors to create stand-alone GIS applications for specific projects. “We had different approaches for different contracts, with GIS services being commissioned for some and not others,” says Orla McManus, Head of GIS for New Business, at Costain.
As demand for GIS solutions increased, the use of subcontractors became a significant cost for the business. Furthermore, as each GIS application developed had a limited scope, defined by the needs of a specific project, the benefits of using GIS were constrained. Costain therefore decided to expand its use of Esri’s ArcGIS platform internally and use it as a strategic tool to help it deliver industry-leading, technology-driven engineering solutions.
Our extended use of ArcGIS puts us in a stronger position to win new business and deliver exceptional service for our clients in some of the UK’s biggest engineering projects
Orla McManus – Head of GIS – New Business, Costain
The Solution
Costain deployed ArcGIS Enterprise to create a single portal for geospatial information, for the entire organisation, hosted in its UK datacentres. It then developed a series of ArcGIS mobile apps and ArcGIS web apps to provide specific groups of employees with the capabilities they need to access data pertinent to their contracts and perform their jobs.
ArcGIS is currently used by groups of Costain employees including:
– Roads inspectors for managing 150,000 assets on a seven year highways and road maintenance contract
– Environmental teams for carrying out ecology, tree and archaeology surveys along a transportation route
– Contact centre staff for responding to telephone queries, noting asset defects and passing on information to maintenance teams
Costain has also created a ‘Costain on a map’ app to provide all employees with a gateway to the company’s growing reservoirs of geospatial data, as well as other systems, such as HR and Building Information Modelling (BIM). “Today, GIS has overtaken BIM in terms of uptake within the business and has very much become our go-to tool for information,” says Sophie Stouki, Head of GIS for Operations, at Costain.
“The ability of ArcGIS to collate data from many internal and third party sources and make it available to lots of people via a web browser is really powerful,” Stouki adds. “Employees don’t need advanced data skills or training to be able to access and use a wealth of open source and live operational data. We currently have around 1200 ArcGIS users, but this figure is going to explode into the thousands. GIS is going to be a part of pretty much every project going forwards.”
We currently have around 1200 ArcGIS users, but this figure is going to explode into the thousands. GIS is going to be a part of pretty much every project going forwards
Sophie Stouki – Head of GIS – Operations, Costain
The Benefits
Effective data sharing and collaboration
Costain’s enterprise GIS platform has significantly improved data sharing within the organisation and made it possible for employees to access a wide range of data sources on demand, from any location, via interactive web maps. As a result, employees now collaborate more effectively and save time across a wide range of activities. For instance, a team of ten environmental specialists has saved as many as 18 hours a week by using an ArcGIS web portal to gain rapid access to environmental data, reducing both the cost and duration of a key client project.
Increased productivity in the field
The roll-out of mobile ArcGIS apps in the field has led to significant productivity improvements, as employees no longer have to travel back to the office to find out information, print out maps or type up reports. For example, road inspectors working on one of the company’s largest highways management contracts now complete 60% more surveys in a week and provide live asset updates to the control room, rather than submitting reports three days later.
More efficient delivery of services
ArcGIS helps Costain to deliver more efficient services to its clients by making it far easier for employees to identify individual street assets and record information about their condition. Contact centre operatives, for example, have the information they need at their fingertips to identify faulty street lights accurately and can pass on a more precise location to the maintenance teams. Costain can, therefore, affect repairs more promptly and deliver a responsive service for its local authority clients and citizens.
Improved management of large contracts
On long-term highways maintenance contracts the use of ArcGIS helps managers to better understand the extent of required works. They can see, at a glance, which areas of grass and vegetation they are responsible for cutting and ensure verges and hedges covered by the contract are not missed. Equally, they can easily see adopted and private land, as well as third party apparatus, and avoid unnecessary interventions and associated costs.
A commercial advantage in tenders for new business
In a highly competitive marketplace, Costain is now better able to tender for high value new contracts as it uses ArcGIS to help demonstrate its ability to deliver advanced, technology-driven engineering solutions. “Prospective clients increasingly see GIS not as a nice-to-have, but as a definite requirement,” explains McManus. “Our extended use of ArcGIS puts us in a stronger position to win new business and deliver exceptional service for our clients in some of the UK’s biggest engineering projects.”

Cork County Council
When the next exceptional storm is forecast to hit southern Ireland, we will have the near real-time information we need to respond quickly and effectively.
Across Ireland, the frequency and severity of storms is steadily increasing, creating logistical challenges for the local authorities that need to maintain local roads. Cork County Council has used Esri’s ArcGIS Online platform to help it monitor issues on roads during extreme weather events, in near real-time, improve its emergency response and support its public communications.
Emergency teams have a clearer understanding of unfolding events during a severe weather emergency
The council can look back over previous crises to see patterns and identify areas for improvement
The general public and emergency responders have up-to-date information about potential hazards
The Challenge
In October 2017, Storm Ophelia propelled hurricane-strength winds across Ireland, taking the lives of three people and causing substantial damage. Yet extreme weather like this can no longer be assumed to be a rare occurrence. According to some estimates, the frequency of storms and severe rainfall events in winter and autumn in Ireland could increase by up to 30 per cent.
Recognising the risk to its local communities, Cork County Council wanted to improve its ability to monitor and communicate the impact of extreme weather events on its road network. It sought to collate information about roads blocked by flood, fallen trees and heavy snowfall and provide this information in near real-time to council teams, in an easily understood format, so that they could respond more effectively, learn from past events and improve communication to the public.
This historic information enables us to look back at previous severe weather events and learn from the past
Mr Tim Lucey – Chief Executive, Cork County Council
The Solution
The council already used Esri’s ArcGIS web geographic information system (GIS) technology within its organisation and had access to Esri’s ArcGIS Online platform. It also subscribed to a geographic public alert service called MapAlerter, which it used to inform the public on severe weather events and scheduled road closures via text messages to subscribers of the system, as well as posting the information on its Facebook and Twitter accounts. The council decided to leverage its existing investment in both of these services to create a bespoke solution that assists with emergency management.
Now, when field-based council employees observe an issue on a road during exceptional weather, they report it to MapAlerter via text, using road segment codes and message templates. This information is then not only used to generate MapAlerter posts, but is also automatically passed to the ArcGIS Online platform, where it is displayed on an interactive map in near real-time. During storms, teams in the council’s Emergency Incident Room, roads department and other service areas can all view this Severe Weather Map to see a clear picture of the extent of road disruption right across the county. The map refreshes automatically every minute, highlighting new issues as they are reported.
Cork County Council has two views of this information. The first, the ArcGIS Online Severe Weather Map, displays the current situation and can be made available to not only council employees, but also the general public and emergency responders, via Twitter, Facebook, MapAlerter and other news channels. The second version is an ArcGIS Server Portal Map for internal use only, where all the historical data from past events is displayed and can be viewed using the time slider function, so that the council’s staff can look back in time to identify hot spots where the same issues have occurred in sequential extreme weather events.
As ArcGIS Online is a hosted solution, it offers high availability, even in the worst of storms, which is a significant advantage for Cork County Council. “If our offices in Cork are flooded and our in-house IT systems go down, or if senior managers cannot travel into work, we can view the ArcGIS Online map from a temporary emergency centre or from home,” says Judith Vonhof, IS Project Leader at Cork County Council. “In crisis situations, it’s reassuring to know that Esri Ireland has the resources to keep our Severe Weather Map available 24/7.”
With the frequency and severity of storms increasing, councils need to be prepared for dealing with them. This system has certainly assisted with this
Mr Tim Lucey – Chief Executive, Cork County Council
The Benefits
Fast, effective responses during extreme weather events
ArcGIS Online provides a single point of reference, where all council employees can see the same, accurate, up-to-date view of an emergency situation, in a clear visual format, as incidents unfold. As a result, council managers can make faster decisions about how best to allocate resources to clear fallen trees at the earliest opportunity following the storm. Similarly, if managers can see that both major roads to West Cork are flooded, for example, the council’s emergency team can direct field-based teams to the area as a priority to erect signs to warn the public of the potential danger.
Improved long term emergency planning
Cork County Council can use the historical maps and time slider functionality of ArcGIS Server to better understand the impacts of past events and use this insight to prioritise road improvements that could help minimise disruption in the future. “You can never know for certain what the next storm will bring,” says Mr Tim Lucey, Chief Executive of Cork County Council. “But, this historic information enables us to look back at previous severe weather events and learn from the past.”
Better information for the public and emergency services
During major storms, Cork County Council can now play an important role in helping to keep members of the public aware of potential hazards and obstructions on the roads. By directing local citizens to the map with all the latest information, the council can help them make better choices about whether to make non-essential journeys and which routes to take. Emergency responders, such as the fire and ambulance service, can also refer to the map to see the latest status and make better decisions about the best routes to reach people in dire need.
Summing up, Mr Lucey adds, “With the frequency and severity of storms increasing, councils need to be prepared for dealing with them. This system has certainly assisted with this.”

1st (United Kingdom) Division
ArcGIS has allowed us to work more efficiently, in an austere environment, to facilitate enhanced data collection.
Each year the British Army’s 1st (United Kingdom) Division deploys medical units to central Kenya, seeing medical teams working alongside Kenyan Defence Force and Non-Governmental Organisations, to provide primary healthcare, community health education and health outreach clinics in rural locations. In 2017, the Division’s Geo Support team created an innovative mobile survey using off-the-shelf ArcGIS technology, to allow the medical teams to collect patient data more quickly and efficiently.
Faster and easier to implement online and offline surveys
Improved productivity of data collection and better interrogation of results
Enhanced sharing of information with multiple agencies
Innovative use of existing off-the-shelf technology
The Challenge
Exercise ASKARI SERPENT is an annual 1st (UK) Division medical exercise that sees the deployment of a Medical Regiment to rural Kenya. The exercise involves the delivery of health outreach clinics and health education to the local population, alongside Kenyan Governmental and Non-Governmental Organisations.
Every patient consultation is recorded, albeit anonymously. The surveys, in rural locations, were originally conducted using laborious, paper-based methods with standard medical consultation forms. At the end of each day, all the paper forms were handed in and then reported to the main HQ, over the radio. Occasionally the results were also recorded onto spreadsheets but while the actual patient medical forms were accurate, there were often inconsistencies with the data on the spreadsheets. With these ongoing disparities, the spreadsheet results were extremely difficult to analyse and producing a meaningful picture of the survey results was a major challenge.
In 2016 the medical units had support from the Division’s Geo Support team for the first time. The Royal Engineer Geographic Technicians are embedded within 1st (UK) Division and have a long-standing partnership with Esri. They assessed that the methodology using paper-based surveys was an inefficient way of doing things, data collection was incoherent, and that a lot more could be done with the analysis and sharing of results.
One of the key things for me is that we have been able to exploit our training properly and, using off-the-shelf technology, develop an innovative solution that is helping our user community
Sgt D Barrett
The Solution
The Geo Support team had been using Esri’s ArcGIS platform for their GIS (geographical information system) requirements for many years, but the technology had not previously been used for recording medical data in the field. They immediately recognised the potential for improvement with GIS, identifying Survey123 as a suitable tool for patient data capture.
“Historically, our work focused on using geographic data and satellite imagery to create maps and information products to inform decision-making and support operational readiness, where to build a helicopter landing site for example” says LCpl James Smith. “This was a really interesting opportunity for us to show how we could innovate by using off-the-shelf GIS technology for mobile data collection, with more sophisticated analysis.”
First, the team created a patient data survey with Survey123 Connect for ArcGIS. This was shared with the next deploying medical team onto tablets – already available to the medical teams- so they could test the survey in the field running the Survey123 app, and identify any adaptations that needed to be made. The customised survey was then shared and used by all medical technicians in the field, who would record all patient information in an online survey and submit it after each consultation.
Even surveying in remote locations, where there was no phone signal, was possible. Significantly, Survey123 works offline and allows users to save data to the device they are working with, uploading it when an internet connection becomes available.
The Geo Support team also created a simple web interface that allows users – the majority having no GIS skills – to interrogate the results as they come in and check the source by accessing the individual survey forms. This has been a particularly important development as the medical teams’ work includes monitoring for notifiable diseases including Malaria and Yellow fever.
A Story Map was generated to communicate the results, updated daily, and used to brief up to the Commanding Officer to give the senior team a clear view of what was happening on the ground, all using off-the-shelf technology.
“One of the key things for me is that we have been able to exploit our training properly and, using off-the-shelf technology, develop an innovative solution that is helping the everyday community,” adds Sgt Dave Barrett. “ArcGIS has helped us to get much more out of a pretty scarce resource, helping us to deliver value-added support to 1st (UK) Division.”
This is an excellent example of a Junior Leader in the British Army using their initiative and talents to enhance our ability to share information with partners that we work alongside. The Survey123 really hit the mark
Col AG Johnson
The Benefits
Fast and simple to implement
Using the ArcGIS platform, the Geo support team could produce the app with off-the-shelf technology which, for them, meant it was a very low barrier to entry initiative. The medical units already had access to the hardware, ie tablet devices, so the predominant outlay was the minimal time required by the team to develop, then customise the patient briefing form on the mobile app.
Improved productivity of data collection
The medical units can now undertake more patient consultations and collect significantly higher volumes of patient data thanks to the ease of using the Survey 123 app. In 2018 6,000 records were collected using the mobile app, compared to 2,000 paper-based records in 2017. The mobile app also allows teams to work in remote locations with limited internet connectivity; data records are simply uploaded when a mobile signal is available. Timeliness of reporting has also improved, enabling the UK military medical units, working in partnership with the Kenyan Ministry of Health, to provide the Kenyan County Health Ministry with this important civilian primary information.
Improved sharing of information
Thanks to the simplicity of reporting via the web interface the data is available to a wider audience, including government departments, facilitating greater collaboration across multiple agencies. An excel spreadsheet has also been generated which allows users to query the data. Ultimately, this access to more accurate data will help all partners to better understand the medical needs of the local population so that better medical care can be delivered to those who need it.
A Story Map was also created as an internal reporting tool, to share results with Army colleagues. Updated daily, the Story Map includes embedded video and images which gives unequivocal insight into conditions on the ground.

Oil and Gas Authority
Using ArcGIS Online we have created a single gateway to all the information that companies might need to help them operate or invest in the UK’s oil and gas industry
The Oil and Gas Authority is supporting the development of the UK oil and gas industry by publishing authoritative data about the UK’s oil and gas resources via an Open Data Portal powered by Esri’s ArcGIS Hub. New and existing investors now have a single point of access to all the data they might need and can make faster, well-informed decisions about financing new oil or gas explorations.
45,000 unique users visited the Open Data Portal in less than two years
12 weeks of manual data preparation eliminated annually
Clear insight into investment opportunities in the UK oil and gas industry
The Challenge
The Oil and Gas Authority (OGA) exists “to regulate, influence and promote the UK oil and gas industry”, and the dissemination of information is a critical part of all three of these roles. The organisation holds vast amounts of data about the UK’s oil and gas resources, including active and historic exploration and production data, and it wanted to find a way to make all this information more accessible.
In particular, the OGA wanted to provide potential investors with a single point of access to all the data they might need to inform a decision about financing a new oil or gas exploration. John Seabourn, Head of Digital Services at the OGA, explains: “The OGA is committed to revitalising exploration activity in the UK, to discover new oil and gas resources. We wanted to make information more easily available to support oil and gas companies, attract new investment and help develop what is a very important industry in the UK.”
The Oil and Gas Authority’s Open Data Portal gives organisations a clear insight into where the greatest opportunities exist and provides them with the information they need to make decisions about new oil and gas explorations
John Seabourn – Head of Digital Services – Oil and Gas Authority
The Solution
Initially, the OGA thought it would need to build its own open data portal, using data models and hyperlinks. Then, it discovered Esri’s ArcGIS Hub, a hosted and managed solution that is available within ArcGIS Online. “All we needed to do was expose our existing ArcGIS Server to ArcGIS Hub and all the hard work was done for us,” Seabourn says. “It is a very simple, elegant solution that suits all our requirements.”
The organisation called upon Esri UK’s Professional Services group to provide some assistance with the deployment of the solution. Most beneficially, the Esri UK consultants shared their knowledge of ArcGIS Hub and delivered bespoke training for the organisation’s employees to give them the confidence and skills they needed to expand and further develop the portal in the future.
Developed using out-of-the box functionality, the first Open Data Portal was up and running within just six weeks. The OGA continued to add new services over time and completely refreshed the portal about eighteen months after its launch. “One of the real advantages of ArcGIS Online is its flexibility,” says Tanya Knowles, GIS Manager at the OGA. “It is very easy for us to add new data sources and change the presentation of our data in response to customer feedback or short term events, such as licensing rounds on the UK Continental Shelf.”
Oil and gas companies, academics, industry consultancies, government bodies and investors now have a single gateway to a wealth of information and can view the data via online dashboards, web apps, stream it directly into their own systems or download it in a range of formats. “ArcGIS enables us to make a huge variety of data accessible, including information that the industry wouldn’t expect, such as specialist reports and production data in a spatial format,” Knowles observes.
ArcGIS enables us to make a huge variety of data accessible, including information that the industry wouldn’t expect, such as specialist reports and production data in a spatial format
Tanya Knowles – GIS Manager, Oil and Gas Authority
The Benefits
A valuable service used by over 45,000 people
Undoubtedly, the OGA has succeeded in developing an information service that meets the needs of the industry. From October 2016 to July 2018, the organisation accrued over 55 million requests to its ArcGIS Server that powers its Open Data Portal, from 45,000 unique users. Over this same period, the weekly traffic to the server increased by 700%, and visitors began to access five times the number of pages, which demonstrates the growing value of the service. In a single week in May 2018, there were 1.2 million requests to its ArcGIS Server.
Clear insight into investment opportunities
The Open Data Portal is helping the Oil & Gas Authority to promote the UK’s oil and gas industry and attract investment to the UK, by making accurate, pertinent information readily accessible to potential investors. “There are up to 20 billion barrels of oil equivalent still to be recovered from the UK Continental Shelf,” Seabourn says. “The Oil and Gas Authority’s Open Data Portal gives organisations a clear insight into where the greatest opportunities exist and provides them with the information they need to make decisions about new oil and gas explorations.”
Industry-wide time and cost savings
The creation of the Open Data Portal has led to significant time and cost savings, not only for the OGA but for companies right across the industry. At the OGA, a cartographer used to spend one week a month preparing data updates for publication on the organisation’s website; now data updates run automatically, overnight, with no manual intervention. Other companies benefit from being able to access data in precisely the format they need, or stream it directly into their systems, which removes many hours of data preparation and updating.
A single, authoritative source of industry data
Finally, the Open Data Portal helps the OGA to regulate and positively influence companies in the industry, by providing them with a single, authoritative source of data. Everyone can see the same operational picture, which improves understanding and collaboration. Summing up, Seabourn says, “ArcGIS has proved its value. The success of our Open Data Portal has justified more investment in data, technology and digital services.”