Blog Archives
Police Scotland
We have successfully leveraged ArcGIS technology to digitise and modernise missing persons search operations, anticipating significant resource and cost savings which can be redirected to other policing priorities.
Police Scotland is modernising missing person search operations by digitising its approach. The Missing Persons Module, accessible on officers’ mobile devices, provides real-time vital information, enabling them to perform their duties more efficiently.
Officers can make faster decisions and quickly task search assets, accelerating their response to a missing persons case
Simple-to-use digital, mobile search tools enable officers to make real-time updates to online maps while in the field
Significant savings in both resources and actual costs could be achieved
The Challenge
Every year Police Scotland receive over 20,000 missing persons reports (1), with two-thirds involving children and young people who are especially vulnerable to harm and exploitation. Among missing adults, mental health issues are common, further increasing their risk.The first 72 hours are critical, and the nature of Scotland’s geography presents additional challenges, which requires Police Scotland to effectively respond to missing persons cases.
Traditionally, searches relied on complex paper-based processes, requiring Police Search Advisors and Licensed Search Officer to manually map and consolidate data, using printed paper maps – an administrative burden generating vast paper records.
During COP26 in Glasgow (2022), Police Scotland implemented an innovative GIS-based digital, mobile workflow to streamline defensive venue searches, improving efficiency while utilising fewer resources. Using ArcGIS Online and Field Maps, this workflow represented a key milestone in Police Scotland’s approach to modernising its search operations and presented an opportunity to develop digital, mobile search tools for missing persons enquiries.
“The Missing Persons Module is modernising search operations, giving officers access to critical information in real-time. Ultimately, improved information management is helping our officers perform their tasks more efficiently and keep the public safe from harm.”
Steve Hunter, Specialist Role Trainer, Police Scotland
The Solution
Police Scotland’s GIS team collaborated with search specialists to develop the Missing Persons Module, giving officers access to critical information about a specific search in real-time. With every operational officer now equipped with a mobile device and, in some cases mobile tablets, the Missing Persons Module has been seamlessly integrated into field operations.
At the core of the new Missing Persons Module is an automated template built in ArcGIS Enterprise, delivering a flexible and repeatable workflow. Officers access the system through a link on Police Scotland’s intranet, where they enter a missing person’s details to generate a preformatted web map. This map allows teams to define search quadrants, which can be colour-coded by risk level, upload findings directly from the field and track search progress visually with real-time updates. This process is particularly powerful given Scotland’s vast rural geography enabling officers in outlying areas to quickly digitally generate their own search sectors.
The dashboard system records daily briefings, integrates search history and allows instant communication between field teams and command staff, streamlining coordination and decision-making. Everyone has access to the same information, at the same time including the latest finds in the field, such as an uploaded image of a recovered item of clothing. This innovation not only enhances situational awareness but also provides an auditable digital trail, ensuring accountability and efficiency.
“We have successfully leveraged ArcGIS technology to digitise and modernise search operations, significantly improving efficiency and accuracy,” comments Steve Hunter, Specialist Role Trainer for Police Scotland. “With the implementation of ArcGIS Field Maps, ArcGIS Dashboards and ArcGIS Enterprise, we have developed a streamlined paperless process that is helping our officers to perform their tasks more efficiently and keep the public safe from harm.”
“By digitising our missing persons search operations, we have created a scalable, intuitive and cost-effective solution to a high-demand policing challenge.”
Inspector John Mackay, Search Coordinator, Police Scotland
Benefits
Time savings
Police Scotland can now respond more effectively to missing persons cases as they unfold. With all officers accessing the same real-time information digitally, advisors can make faster decisions and task search assets more efficiently. Instantaneous updates give visual progress reports and the more background information available, the greater the chance of locating the missing person quickly before they come to harm.
Ease of use
Officers using the Missing Persons Module do not need any specialist GIS experience. From previously having to mark-up paper-maps and submit these to the tasking officer at the end of each day, officers in the field now use their mobile device or tablet to upload information from their search grid from an image of an item, to a marker and descriptor of a point of interest.
Better use of resources
By taking a digital approach and streamlining missing persons enquiries, Police Scotland is making better use of resources, minimising the impact on other policing priorities. Moving away from a paper-heavy, administrative, time-intensive repetitive system allows resources to be allocated more efficiently and reallocated instantly based on real-time updates from the Missing Persons Module. This reduces duplication of effort, enhances decision-making and supports a more agile response.
Cost Savings
The first scientific study in the UK to establish the cost of missing person investigations (2), based on an assessment of real-life cases, found the estimated cost to be £2,415.80 per case. With approximately 20,000 missing person reports to Police Scotland each year, this amounts to over £48million per annum. While the time savings from digitising search efforts using the Missing Persons Module have yet to be quantified, Police Scotland anticipates that significant savings in both resources and actual costs could be achieved.


Natural England
Having identified the need for a digital spatially led approach we have developed a solution using ArcGIS Field Maps, ArcGIS Survey123, ArcGIS Experience Builder and ArcGIS Dashboards that is helping our advisors perform their jobs more efficiently.
To support more sustainable farming and environmental outcomes, Natural England’s Catchment Sensitive Farming (CSF) programme needed a modern, consistent approach to data capture and farm engagement. With Esri UK’s support, they developed a scalable digital solution that streamlines workflows, improves planning and strengthens relationships with farmers.
Data is automatically uploaded from site visits in real-time removing the need for paper records
Users have access to rich spatial datasets and past assessment data helping them deliver more targeted advice
The replicable, scalable solution is easy to adapt for other teams and address their needs
The Challenge
Since its launch in 2006, Natural England’s Catchment Sensitive Farming (CSF) programme has played a crucial role in reducing diffuse water pollution from agriculture. Working in partnership with the Environment Agency, Forestry Commission and Defra, CSF provides farmers with free advice to promote more sustainable practices that will benefit both the environment and farming businesses.
However with 100 advisors operating across England, each using their own methods, many of which included annotating paper maps, CSF engagement records across the board were inconsistent. High staff turnover further compounded the problem, leading to a loss of corporate knowledge and inefficiencies in targeting priority farms. As CSF expanded to include air quality, natural flood management and climate change goals, the need for a more consistent, scalable approach that would unify workflows and preserve knowledge became clear.
As an Esri technology user for many years, Natural England identified that a digital, location-based solution using the ArcGIS system, would be key to delivering a more efficient CSF programme.
“We are successfully moving from paper to digital. Fundamentally, our advisors now have the tools to deliver more targeted, evidence-based advice that is helping farmers to adopt more effective, sustainable land management practices.”
Helen Merchant, Catchment Sensitive Farming Lead, Natural England
The Solution
Working with Esri UK’s Professional Services team Natural England developed an initial Proof of Concept for the Farm Data Capture Tool (FDC). From the outset, a key objective was to develop a solution that would strengthen Natural England’s trusted relationship with farmers. Following a Beta release and iterative feedback from users, the tool was officially launched in October 2024.
The FDC is designed to streamline and standardise how CSF advisors plan, capture and manage data. It comprises two key components: a browser-based web app and a mobile field app .Advisors use the web app, built in ArcGIS Experience Builder to plan farm visits, review locations and assess land parcels. In the field they switch to the mobile app, built with ArcGIS Field Maps to perform assessments, take and geotag photos, capture field-level run-off issues and input observations that sync directly with the web app; where connectivity allows, data syncs in real-time otherwise it uploads automatically once back online. Back in the office through the web app embedded with ArcGIS Survey123, advisors capture post-visit recommendations, which are then automatically formatted into report templates ready for review and to be sent out to farmers.
All collected data is fed into a central ArcGIS Dashboard, presented within an ArcGIS Experience Builder app. The dashboard visualises planned visits, previous assessments and integrates key environmental datasets providing advisors with a comprehensive, spatially aware view of their work.
Adoption of the solution has grown steadily as the team’s digital confidence increases. To support smooth and inclusive adoption the Natural England team developed comprehensive guidance notes and training videos accessible via a corporate digital hub. While digital confidence varies across the advisors the approach has been effective, and feedback from users has been overwhelmingly positive.
The FDC complements the existing CSF Reporter database, which remains the formal system for audit and reporting. By adding spatial context, field-level notes and real-time data capture, FDC enhances day-to-day operations and supports more effective advisor-farmer engagement and the tool is already demonstrating its potential to transform how CSF advisors work. Built with scalability in mind, it integrates tools from across the ArcGIS system to deliver one seamless user experience, enabling smarter, evidence-based engagement and supporting the development of long-term relationships with farmers.
“We now have a replicable model for other teams within Natural England and Defra, offering a digital-first future for environmental engagement with our stakeholders.”
Helen Merchant, Catchment Sensitive Farming Lead, Natural England
Benefits
Time savings
Advisors no longer need to manually upload data once they return to the office. Data is now automatically captured and uploaded from field sites in real-time, or as soon as connectivity is restored. This includes geotagged photos and observations, significantly reducing administration time and enabling advisors to focus on more farmer engagement.
Better use of data
Both mobile and web browser tools provide instant access to rich spatial datasets from trusted sources including Defra, the Environment Agency and the Living Atlas.During site visits, advisors can also review past assessment data, allowing them to deliver more targeted, evidence-based advice that supports farmers in adopting more effective, sustainable land management practices.
Improved planning
The web app enables advisors to conduct more thorough pre-visit checks by providing access to key datasets such as soil quality, environmental constraints and land designations such as SSSIs. Advisors can also view indicators showing where each farmer is on his engagement journey, allowing for more personalised, strategic and efficient planning of on-the-ground advisory work.
Replicable solution
The scalable design of the FDC tool makes it easy to adapt across other teams within Natural England. Several departments have already indicated their interest in tailoring the solution to meet their specific needs, demonstrating the tool’s potential to support a wide range of environmental initiatives.
Woodland Trust
An app built with Sweet for ArcGIS is supporting the creation of new native woodlands across the UK.
The Woodland Trust is expanding native woodland and creating tree-rich habitats across the UK using a new planning and management app created with Esri’s Sweet for ArcGIS tool. The app gives the nature charity an accurate overview of nationwide projects, across multiple funding schemes, and helps it to design attractive, resilient woodland environments.
Bespoke app created quickly and easily in-house, using Sweet for ArcGIS tool
Knowledge transfer and support provided by Esri UK’s Professional Services
Efficiency improved for up to 130 people, working in woodland creation
The Challenge
One of the Woodland Trust’s strategic aims is to create more woodland environments across the UK. Trees are known to deliver significant benefits for nature, carbon sequestration and mental wellbeing, yet only 13.5% of the UK is classed as woodland.
At any one time, the Woodland Trust can have dozens of woodland creation projects planned or in progress, managed by different teams, across multiple regions, on its estates and land owned by third parties, under a variety of funding schemes. All these projects were planned independently and reported separately, which made it hard for managers to monitor achievement of the charity’s woodland creation goals.
“Staff can now better visualise where to put high and low density planting to create a varied, resilient and interesting woodland, and where this sits in a wider landscape context.”
Ian White, GIS Manager, Woodland Trust
The Solution
To address this complex situation, the Woodland Trust used Esri’s web-based software, ArcGIS Online, and the Sweet for ArcGIS app to create a new way of planning and monitoring woodland creation schemes. The transformative solution was built by staff at the Woodland Trust, with support from a consultant in Esri UK’s Professional Services group, who shared her knowledge of Sweet for ArcGIS and helped the internal team to get started.
Known internally as the ‘Creation and Grants App’, the solution is used by around 130 people involved in woodland creation in the charity, across different programmes of work, multiple grant schemes and dozens of locations. The rich digital mapping and geospatial data in the app enable them to visualise the shape of the landscape at specific sites, understand vistas and create detailed planting and management plans. Project teams use tools within the app to design entrance points and pathways for the new woodland, estimate the trees required and even pinpoint locations for benches.
The app is tightly aligned with the charity’s ‘Woodland Creation Guide,’ which provides a nationally-recognised methodology for achieving the best results when creating new woodland. The app automatically prompts users to apply the methodology to get the right mix of native species and provide appropriate public access, for example. Site managers and outreach advisors can then revisit the schemes and update them over time, as plans evolve.
Critically, the app collates data about all new woodland creation projects that are planned or in progress, the projected number of trees, the number of trees planted and when planting occurred. All this data—and more—is available to view on interactive dashboards in ArcGIS Online. Users can zoom into maps on the dashboards and query the statistics by geography or key attributes, such as funding type. The data in the dashboards is updated daily, giving managers accurate information about all woodland creation schemes on land owned by the charity and its partners.
Alongside the Creation & Grants App, staff at the Woodland Trust also use another app, created with the ArcGIS Experience Builder web app building tool, to quickly check sites for unsuitable ground conditions and other constraints such as the locations of ancient monuments. In this way, the charity can quickly rule out unsuitable sites and provide its advisors with useful information to inform their site visits. Staff access all their geospatial data and apps using a portal, built using one of Esri’s StoryMap templates.
“We can already see that we will be able to use what we have learned with Sweet for ArcGIS on this project to develop other solutions in the future. It feels very positive to have these GIS tools available to us.”
Ian White, GIS Manager, Woodland Trust
Benefits
Greater visibility of planned and active projects
Using the Sweet for ArcGIS app, the Woodland Trust has succeeded in building a mapping application that gives staff far greater visibility of all planned and active projects, facilitating better collaboration between teams and improving efficiency. For instance, data from the charity’s MOREWoods schemes, crofting, agroforestry and estate planting, are all now visible to appropriate groups, in the same way, for the first time.
Better designs for resilient woodland environments
The Woodland Trust’s site managers and outreach advisors can use the new app to plan the right mix of tree species, in the right locations, to create sustainable woodlands, optimise vistas and create attractive public spaces. “Staff can now better visualise where to put high and low density planting to create a varied, resilient and interesting woodland, and where this sits in a wider landscape context,” explains Ian White, GIS Manager at the charity.
Effective monitoring of progress towards goals
The ArcGIS dashboards provide managers at the Woodland Trust with a clear and up-to-date overview of the status of all woodland creation activity, irrespective of how each project has been funded, planned or delivered. Consequently, it is now far easier for the charity to monitor the achievement of its tree planting goals and provide evidence to grant providers. “Woodland creation is one of our key strategic aims, and ArcGIS is enabling us to better understand how and where we are making a difference,” notes White.
Improved efficiency throughout the trust
Buoyed up by the efficiency improvements that it is witnessing in woodland creation, the GIS team at the Woodland Trust is now planning new solutions to improve efficiency in other areas such as the restoration of existing, ancient woodland. “Woodland creation is just one of many things that we do at the trust,” says White. “We can already see that we will be able to use what we have learned with Sweet for ArcGIS on this project to develop other solutions in the future. It feels very positive to have these GIS tools available to us.”

An Garda Síochána
An Garda Síochána, Ireland’s national police and security service, is making progress towards its goal of paperless mapping following a private training course, delivered by Esri UK and Ireland’s Learning Services team.
Ireland’s national police and security service, An Garda Síochána, is on a mission to reduce internal requests for paper-based maps by expanding its use of digital mapping products. Having upskilled key members of staff in a private training course delivered by Esri UK & Ireland’s Learning Services team, the Organisation is now on track to achieve this goal.
Six team members trained in a two-day, face-to-face course in Dublin, organised to fit within busy work schedules
Private ‘Introduction to ArcGIS Pro’ training was tailored to the needs of An Garda Síochána
Variety of digital mapping apps now in development using ArcGIS Pro and new skills gained
The Challenge
The Technical Bureau of An Garda Síochána typically produces around 700 maps annually, many of which are still requested on paper. These maps fulfil a range of purposes from illustrating crime scenes and outlining security plans for large events to documenting boundary changes from Divisional realignments as a result of the Operating Model now in existence. The Technical Bureau was keen to reduce the reliance on paper maps by advancing its use of digital mapping. It realised that by increasing its use of web-based mapping applications, in particular, it had the potential to increase its efficiency, as well as deliver significant advantages for operational policing and strategic planning.
The Technical Bureau was already generating digital maps and mapping apps using Esri’s cloud-based geographic information system (GIS), ArcGIS Online. To build on this success, it decided to invest in Esri’s latest desktop software, ArcGIS Pro, and also deploy Esri’s ArcGIS Enterprise platform to store sensitive data securely on premise. It recognised, however, that its key staff members would need training in digital mapping, if it wanted to optimise the use of this additional GIS technology.
“The Esri UK & Ireland trainers were very accommodating and adapted the course to fit our requirements.”
Inspector Colum Reilly, Technical Bureau, An Garda Síochána
The Solution
The Technical Bureau contacted Esri UK & Ireland’s Learning Services team and arranged two days of private, in-person training in Dublin. The course, An Introduction to ArcGIS Pro for Newcomers, was delivered for six people with different levels of GIS experience and gave all of the participants the confidence to start using the full functionality of ArcGIS Pro.
Notably, Esri UK & Ireland’s Learning Services team was able to tailor the private course to the Technical Bureau’s data and specific workflows, as well as deliver the training on a Friday and Saturday. “The Esri UK & Ireland trainers were very accommodating and adapted the course to fit our requirements,” recalls Inspector Colum Reilly of the Technical Bureau within An Garda Síochána. “The dates were arranged to minimise impact on court proceedings and enable as many of the team as possible to attend. Esri UK & Ireland arranged the venue and provided all of the laptops for us to use, which made it very easy for us.”
The Technical Bureau is now considering what additional training might be beneficial to staff to support the use of ArcGIS Online and ArcGIS Pro, as well as optimise the functionality of ArcGIS Enterprise in the future, when fully deployed. Key members of the team have availed of the many online training resources available from the Esri Academy website to further advance their knowledge of ArcGIS technology.
“It is such a quick process now to create a web app or map. If colleagues need a crime scene map, we can produce it in ArcGIS Pro very quickly. Esri mapping is a game changer for us.”
Inspector Colum Reilly, Technical Bureau, An Garda Síochána
Benefits
Increased understanding of ArcGIS capabilities
The members of staff who attended the private training course now have a detailed understanding of the capabilities of ArcGIS Pro and can take on more ambitious projects. For example, the Technical Bureau is currently planning to develop new mobile apps, to support activities such as house-to-house investigations and special event planning. Inspector Reilly observes, “People are looking at ArcGIS now and understanding how it can work for them.”
Faster generation of digital map products
Staff now have the skills to deliver mapping applications and map products with ArcGIS Pro very quickly. The Technical Bureau can, therefore, respond much more promptly to requests for maps of crime scenes to support investigations or to clarify locations for juries in court cases. “It is such a quick process now to create a web app or map,” Inspector Reilly says. “If colleagues need a crime scene map, we can produce it in ArcGIS Pro very quickly. Esri mapping is a game changer for us.”
Better resources to support decision making
The Technical Bureau believes that it now has the technology and skills in house to deliver superior map products to support all kinds of policing activities. It is, for example, currently working on an interactive app for command centres that provides granular, map-based data on everything from CCTV locations to live road closures. “Digital mapping products like this provide a visual representation of what is happening around a site, to help Gardaí make decisions quickly and respond appropriately, when an incident arises,” explains Inspector Reilly.
Enhancements to existing, valued services
With new skills in ArcGIS Pro and the upcoming arrival of ArcGIS Enterprise, staff in the Technical Bureau are keen to review prior projects and enhance them. For example, the team plans to further develop an existing ArcGIS Online app that helps it to identify the locations of older people across Ireland. The solution will be refreshed as part of a community policing initiative to help local Gardaí provide ongoing support to older people and vulnerable people in scenarios such as flooding events.
A clear pathway towards paperless mapping
Finally, the training will undoubtedly help the Technical Bureau to achieve its goal of reducing demand for paper maps. By creating web apps in ArcGIS Online, such as the Garda Administration Boundaries app, the Technical Bureau has already decreased requests for paper maps in such areas by nearly 50%. With new projects in development, such as an app for monitoring the issue of warrants, it is making significant progress towards its ultimate goal of paperless mapping.

Natural England
We have successfully leveraged ArcGIS technology to digitise and modernise our DLL Scheme, increasing the integrity of our data, supporting better decision-making and enhancing collaboration with our stakeholders.
Natural England’s District Level Licensing (DLL) Scheme is a strategic approach to licensing that compensates for impacts on Great Crested Newts during development projects. Previously reliant on complex manual processes the scheme has been digitally transformed through an ArcGIS Online solution, creating a seamless and streamlined user experience for DLL staff, partner organisations and developers engaging with the scheme.
Accurate field data collection has resulted in 85% reduction in data mining
Increased trust and confidence in spatial data is informing more accurate, reliable and timely decision-making
A previous data audit requiring 75 working days has been reduced to just five working days
The Challenge
Natural England’s DLL Scheme faced digital challenges; from the outset, supporting teams had to collect, report and submit data – manually – for over 3,000 ponds, each pond requiring multiple Excel spreadsheets to assess ecological impact.
This lengthy, manual approach, involving over 10,000 spreadsheets by mid-2024, was managed by multiple partner organisations as well as internal staff, often leading to data duplication, typos and inconsistencies. On occasion, data would not be submitted for weeks after partners had visited and recorded information about a pond. Pond reports could be duplicated or sometimes even missed. This lack of integration made it challenging to track changes or ensure data accuracy, undermining confidence in reporting and potential validity of the data.
Regular audits were required to check data integrity. A 2023 audit revealed the extent of the issue: four months of manual review were required to identify and correct errors, with onward reporting stretching to 1,000 lines just to clean the data. This growing complexity became a turning point, prompting Natural England to seek a scalable, digital solution.
“The DLL Pond Data System is making a huge difference in terms of the quality of data we collect, and how we manage it. Simply put, it’s been revolutionary for our work.”
Laura Scott, Principal Officer, Natural England
The Solution
As an executive non-departmental public body sponsored by DEFRA, Natural England already had access to the ArcGIS System. After establishing clear criteria for their requirements, the organisation engaged Esri UK to explore how GIS technology could support its work. Esri UK’s Professional Services team then spent ten days developing a proof of concept, showcasing the potential of ArcGIS Survey123 and ArcGIS Online to support Natural England’s DLL Scheme.
Work on the full solution began in June 2024 and was completed within 10 to 12 weeks. The result was the DLL Pond Data System - a tailored suite of tools empowering the DLL team to spatially review data, conduct robust data analysis, streamline reporting, maintain data quality and enhance collaboration with delivery partners. These capabilities have led to significant time savings and improved operational efficiency.
Survey123 is used by field surveyors during initial site visits, with each new pond being registered and assigned a unique ID, preventing duplication. On subsequent visits such as monitoring surveys, partners use ArcGIS Field Maps to upload new data, allowing multiple records for a single pond to be captured seamlessly.
DEFRA’s contracted partners are issued sub-contractor licenses, ensuring all parties operate on the same technology platform. Data is visualised through two interactive dashboards: the General Dashboard, accessible to partners, provides status updates on all ponds, while the Invoicing Dashboard tracks financial information and clarifies invoicing status. The integration of multiple ArcGIS products into a unified, user-friendly system has been a major success. The DLL Pond Data System not only improves data collection and management but also supports significantly more efficient collaboration across stakeholders. The project’s success was further recognised internally, with the primary contact at Natural England receiving an award for outstanding delivery.
“Our new digitised system has significantly reduced delays dealing with developers, a key step in supporting the Government’s commitment to accelerating house building.”
Jarod Benton, Principal Officer, Natural England
Benefits
Accurate Data Reporting
Moving from manual field data collection to mobile digital apps, ArcGIS Survey123 and ArcGIS Field Maps, has significantly improved accuracy and timeliness of data reporting. Data mining efforts have been reduced by 85 per cent allowing the team to quickly access the information they need to undertake their jobs more efficiently and present stakeholders with high-quality actionable intelligence.
Confidence in Data
Increased trust and confidence in spatial data is informing more accurate, reliable and timely decision-making. With less time required for data cleansing, the team can spend more time using other tools including Microsoft Power BI, to perform deeper data interrogation and undertake more sophisticated data analysis. This enables the production of more insightful and accurate reports.
Increased operational efficiency
A previous data audit, undertaken over four months and requiring 75 working days to complete, has now been reduced to just one working day. Transitioning from manual data reporting to a fully digitised process is driving major improvements in operational efficiency, enabling team members to develop new digital skills and take on more value-add tasks, transforming the nature of their roles and positively contributing to overall team capability and satisfaction.
Better stakeholder collaboration
Relationships with partners and developers are improving and previous, often convoluted processes have been simplified leading to a smoother working experience for all parties. Delays with issuing licences to developers are minimised helping to speed up the housing development process, a key tenet of the Government’s commitment to accelerating house building.

Jersey Electricity
We have transformed decades-old, hand-drawn network diagrams into a live digital map of all our network assets.
Jersey Electricity has replaced decades-old, hand-drawn maps of its electricity network with a thoroughly modern geospatial information platform. Built with Esri’s ArcGIS technology, the system gives all employees access to accurate, live asset data, enabling them to work more efficiently, respond quickly to power outages and plan effectively for the future.
More than 60% of staff members have instant access to live data about all network assets via ArcGIS apps
Field-based engineers can see network maps and asset data in the field on phones and mobile devices
Senior managers can plan effectively for the future with greater insight from geospatial network analysis
The Challenge
For more than 70 years, Jersey Electricity relied solely on hand-drawn diagrams of its electricity network. This traditional approach to recording the locations of assets was skilled but highly laborious and gradually led to inaccuracies in the organisation’s records. To remedy this, in the late 1990s, the organisation began to use computer-aided design (CAD) software packages, but the process of creating and maintaining network drawings remained time-consuming.
Critically, Jersey Electricity’s employees could not access network information easily, which impeded the company’s ability to respond to emergencies. In addition, field-based engineers still relied on paper-based diagrams and maps when carrying out repairs or installing new infrastructure. Cognisant of its responsibilities as the island’s sole power supplier, Jersey Electricity decided to embark on a comprehensive digital transformation to help it deliver the robust, safe and resilient electricity infrastructure needed by its 55,000 customers.
“Bringing in ArcGIS has had a crucial impact on the mapping quality and the accessibility of our data.”
Salwa Collas, Team Lead (Drawing Office) and ArcGIS Engineer, Jersey Electricity
The Solution
Jersey Electricity’s goal extended beyond simply installing a digital mapping system; it aimed to build a live, geolocated data platform accessible to all employees. The utility company selected Esri’s ArcGIS system and began to roll out a suite of geographic information system (GIS) solutions, supported by Esri UK’s Gold Partner in the Channel Islands, Digimap. Digimap helped to ensure a smooth implementation of ArcGIS, provided the local mapping data for the island and supported Jersey Electricity with the creation of a fully digitised, geospatial inventory of its assets within ArcGIS Enterprise.
During the course of the project, Jersey Electricity used ArcGIS Experience Builder and ArcGIS Field Maps to create accurate, live, web maps, providing staff with instant access to data about cables, substations and overhead power lines, from their desktops, phones and tablets. Salwa Collas, Team Lead (Drawing Office) and ArcGIS Engineer at Jersey Electricity says, “Bringing in ArcGIS has had a crucial impact on the mapping quality and the accessibility of our data.”
The implementation of ArcGIS has been particularly transformative in the field, as Conor Carré, Construction Engineer at Jersey Electricity, explains. “Thinking back to our old way of working, it was very archaic. Out on site, we used to be heavily reliant on our paper-based job packs, which wasn’t a very efficient way of working. ArcGIS has filled in the missing part of the puzzle. Having this functionality out in the field is a massive benefit to all of us.”
Jersey Electricity, in partnership with Digimap, is now pursuing a robust integration between ArcGIS and its core business applications, including systems for asset management, power modelling, metering and health and safety, which is contributing to more streamlined business processes. In addition, the company is using ArcGIS to analyse its network data geospatially for the first time, to gain fresh insight into electricity usage and risks from climate change.
“ArcGIS was really pivotal in our response to Storm Cieran. It helped us to get customers back on, in a more managed and effective way than would otherwise have been possible.”
Mark Preece, Chief Operating Officer, Jersey Electricity
Benefits
Improved collaboration and customer communication
Jersey Electricity is now undoubtedly reaping the benefits of its investment in a GIS-based, live data information platform. All teams across the organisation now use the same, geospatially-accurate network data, which improves their ability to collaborate as well as respond to customer queries. “Having all our complex infrastructure assets in one map is the heartbeat of the company and is pivotal and instrumental not only for us, but for our customers,” says Collas.
More efficient business processes
Improved access to network information is helping to streamline key business processes, shorten delivery times and achieve cost-efficiencies across Jersey Electricity. The organisation expects to particularly benefit from having its low voltage network mapped in ArcGIS, as Mark Preece, Chief Operating Officer of Jersey Electricity explains. “What is really powerful for an organisation like ourselves is that we have been able to create a digital twin of the low voltage network. It’s something that we are really proud of and it’s going to save us a lot of money in the future.”
Greater safety for field-based teams
Whether they are maintaining network assets or installing new infrastructure, engineers working in the field can use ArcGIS on their mobile devices to instantly see live network data. This improves site safety and minimises the risk of accidental damage to electricity cables. “Every single asset that the company owns is now recorded in ArcGIS,” says Carré. “Having everything at our finger tips is just completely different – life-changing to be honest.”
Rapid responses to emergency incidents
ArcGIS dramatically improves Jersey Electricity’s ability to respond quickly to emergencies, such as the wide-spread power-outages that occurred when Storm Cieran devastated Jersey. On that occasion, a fierce tornado ripped right across the island, destroying seven electricity pylons. “ArcGIS was really pivotal in our response to Storm Cieran,” recalls Preece. “It helped us to get customers back on, in a more managed and effective way than would otherwise have been possible.”
Better scenario analysis to inform future planning
ArcGIS is now playing a key role in helping Jersey Electricity to plan for the future, prepare more effectively for the impacts of climate change, like flooding, and meet the requirements of the Jersey government’s net zero carbon incentive scheme. “ArcGIS enables us to model different scenarios and understand the impact of different levels of electric use on the network,” Preece says. “We can, therefore, plan for the future and make sure that the infrastructure is fit for purpose, ahead of when it is needed.”
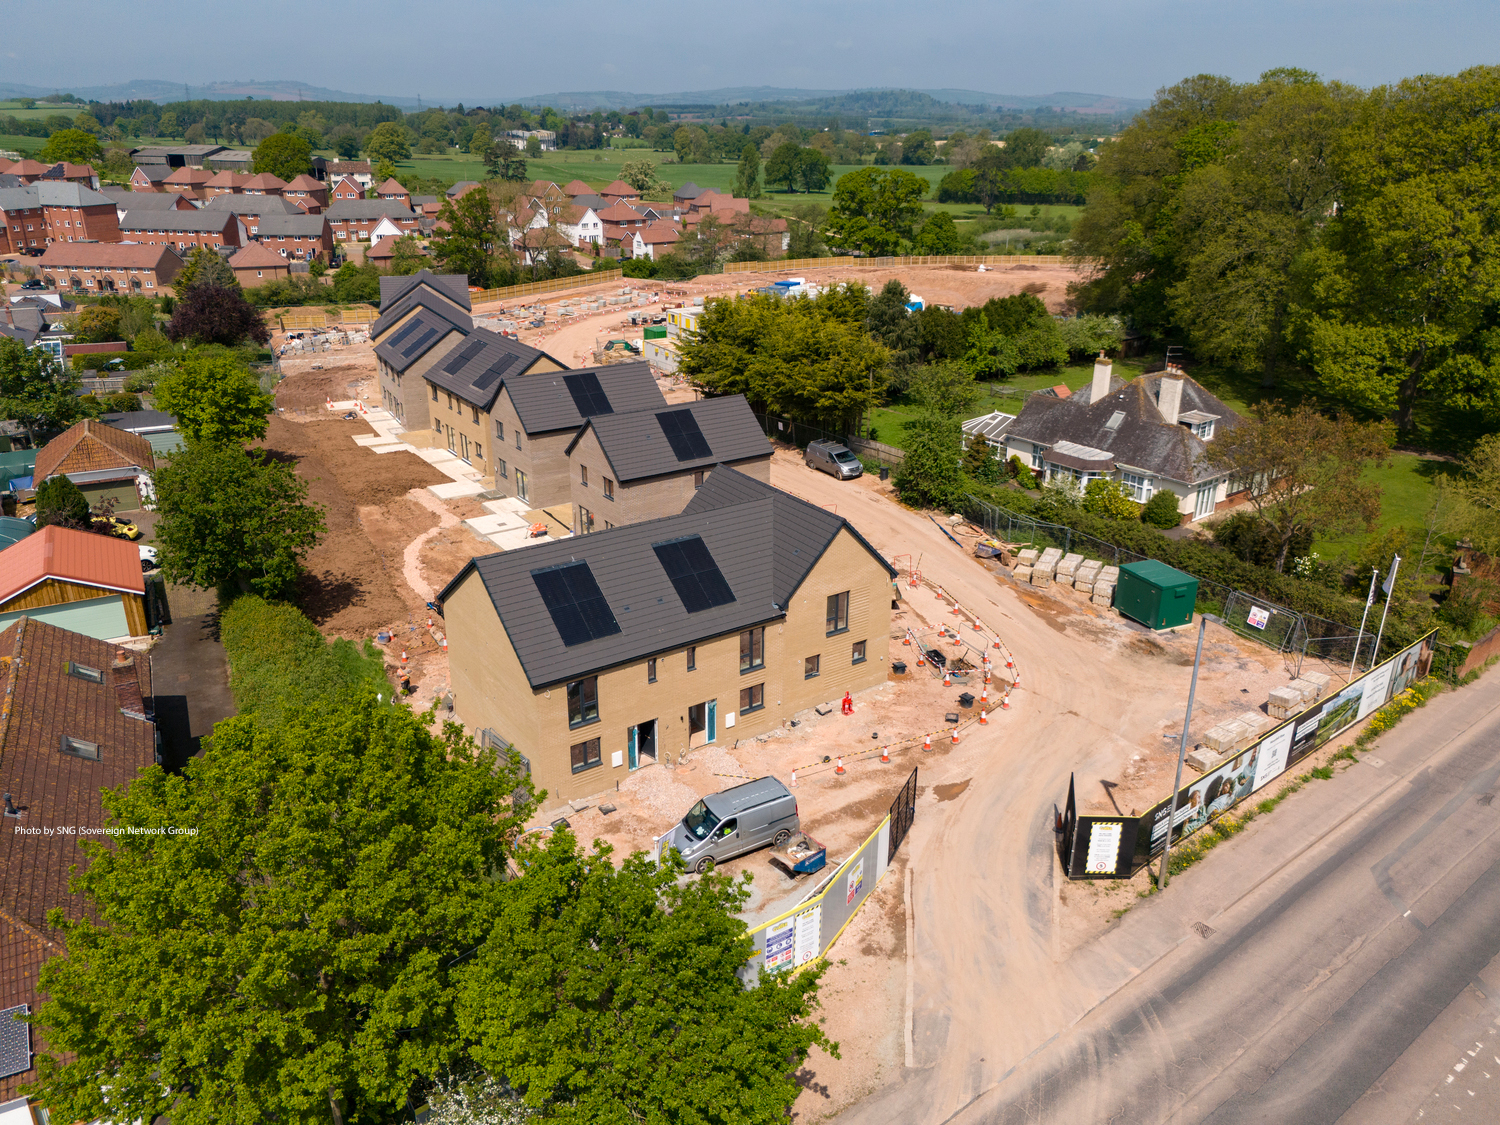
Sovereign Network Group
We have leveraged the existing capabilities of Power BI and ArcGIS to realise powerful new analytical insights, with our Community Indicator Model, to support more informed community investment decisions.
SNG (Sovereign Network Group) has revolutionised its funding decisions with the Community Indicator Model, integrating Power BI and ArcGIS to visualise and analyse community wellbeing. This innovative solution unifies data across five key indicators, enabling targeted impactful investments to support areas of high disparity across the South West, South East and East of England, including London.
Leveraging the existing capabilities of Power BI and ArcGIS is realising powerful new analytical insights
Intuitive, easy to access visualised data is supporting more informed decision-making
This replicable data-driven approach offers a repeatable model for guiding community investment across the housing sector
The Challenge
SNG was formed through the merger of Sovereign Housing Association and Network Homes and provides over 84,000 homes across the South West, South East and East of England, including London. As a charitable organisation its social purpose underpins its investment strategies and it reinvests its surplus into building more high-quality homes and providing better services for its customers and local communities.
Following the merger SNG faced the challenge of unifying data from two separate IT systems and making sense of its vast asset base. With critical decisions to make about where and how to allocate over £100 million in community investment over the next decade, the organisation needed a reliable, insightful way to analyse both internal and external data from Excel files on SharePoint to open datasets including crime rates and flood risk.
Previously, data held across different systems complicated the potential for complete analysis and visualisation. SNG needed a clear, visual solution to understand which communities were thriving, and which were not. To address this, the Community Indicator Model was developed, and it is now transforming how SNG prioritises resources and supports its social purpose.
“Our new system is great example of how users can easily navigate and explore data using Power BI and ArcGIS, enabling better decisions through the visualisation of data from multiple internal and external sources.”
Maxim Alupii-Morton, GIS Technician, Sovereign Network Group
The Solution
SNG has been benefitting from the capabilities of ArcGIS since 2008 and places considerable importance on the role of spatial analytics and data visualisation to inform decision-making.
To visualise and analyse the complexities of community wellbeing, the GIS team developed an advanced model that aggregates diverse data sources across five key categories - health, crime, financial well-being, education and amenities – at multiple geographic levels (Local Authority, MSOA and LSOA). Using the spatial analysis capabilities of ArcGIS Pro, they incorporated GIS-based amenities data, among others, to visualise and gain a deeper understanding of complex regional patterns and inequalities.
Weightings for each of the five categories (indicators) were derived from authoritative sources including the Cambridge Harm Index, and further refined factor analysis. These informed machine learning models which then generated the comprehensive community scores and, to make them easily accessible, the resulting insights were embedded directly into SNG’s Enterprise Communities app as a new, intuitive ‘Community Rankings’ layer.
This intuitive, map-based visualisation has transformed static data into interactive spatial intelligence. Users can explore community scores through ArcGIS Dashboards, with pop-ups directly linking to corresponding Power BI dashboards. Reciprocal links from Power BI enable smooth two-way navigation and, by embedding ArcGIS maps within Power BI, users can interact with spatial data and contextual metrics side by side, within their familiar analytics environment, without needing to switch platforms.
This dual integration is providing a streamlined user experience, empowering teams across the organisation to make more informed, data-driven decisions with ease. To further enhance usability, interactive features such as score-based filtering and multi-layer overlays have been introduced. Users can easily compare community scores with other vital data, including property information, deprivation indices and local amenities, to support granular location-based decision-making.
“The Community Indicator Rankings dataset is transforming how we approach funding decisions. We now have easy, visual access to essential data that is helping us to make better informed decisions and how to invest in specific needs and projects.”
Maxim Alupii-Morton, GIS Technician, Sovereign Network Group
Benefits
Better decision-making
Aggregating, analysing and visualising data within a geographic context gives users access to greater insights which inform better decision-making. Users no longer need to worry about navigating data hidden within Excel spreadsheets and stored on different systems, they now have intuitive access to all internal and external data so they can better understand often complex regional dynamics.
Exploiting existing capabilities
By leveraging existing capabilities in ArcGIS Enterprise and integrating with Microsoft Power BI, SNG has empowered users to create self-serve maps that combine community scores with internal and external datasets. Embedding ArcGIS within Power BI enables users to explore geographic data and contextual metrics side by side, all within a familiar analytics environment
Supporting long-term planning
By refreshing the datasets annually with new data, SNG can assess the impact of their investments over time, identifying which areas are responding positively to investment and adjusting strategies for areas that may need a continuous approach. This supports continuous improvement while providing quantifiable outcomes, making it easier to secure additional funding for future community development projects.
Replicable industry model
By developing a replicable, data-driven approach, SNG has created a model for guiding sustainable community investments. Sharing this model with other housing associations will foster collaboration, encourage feedback and drive more impactful, evidence-based initiatives to support investment strategies and improve community welfare across the country.

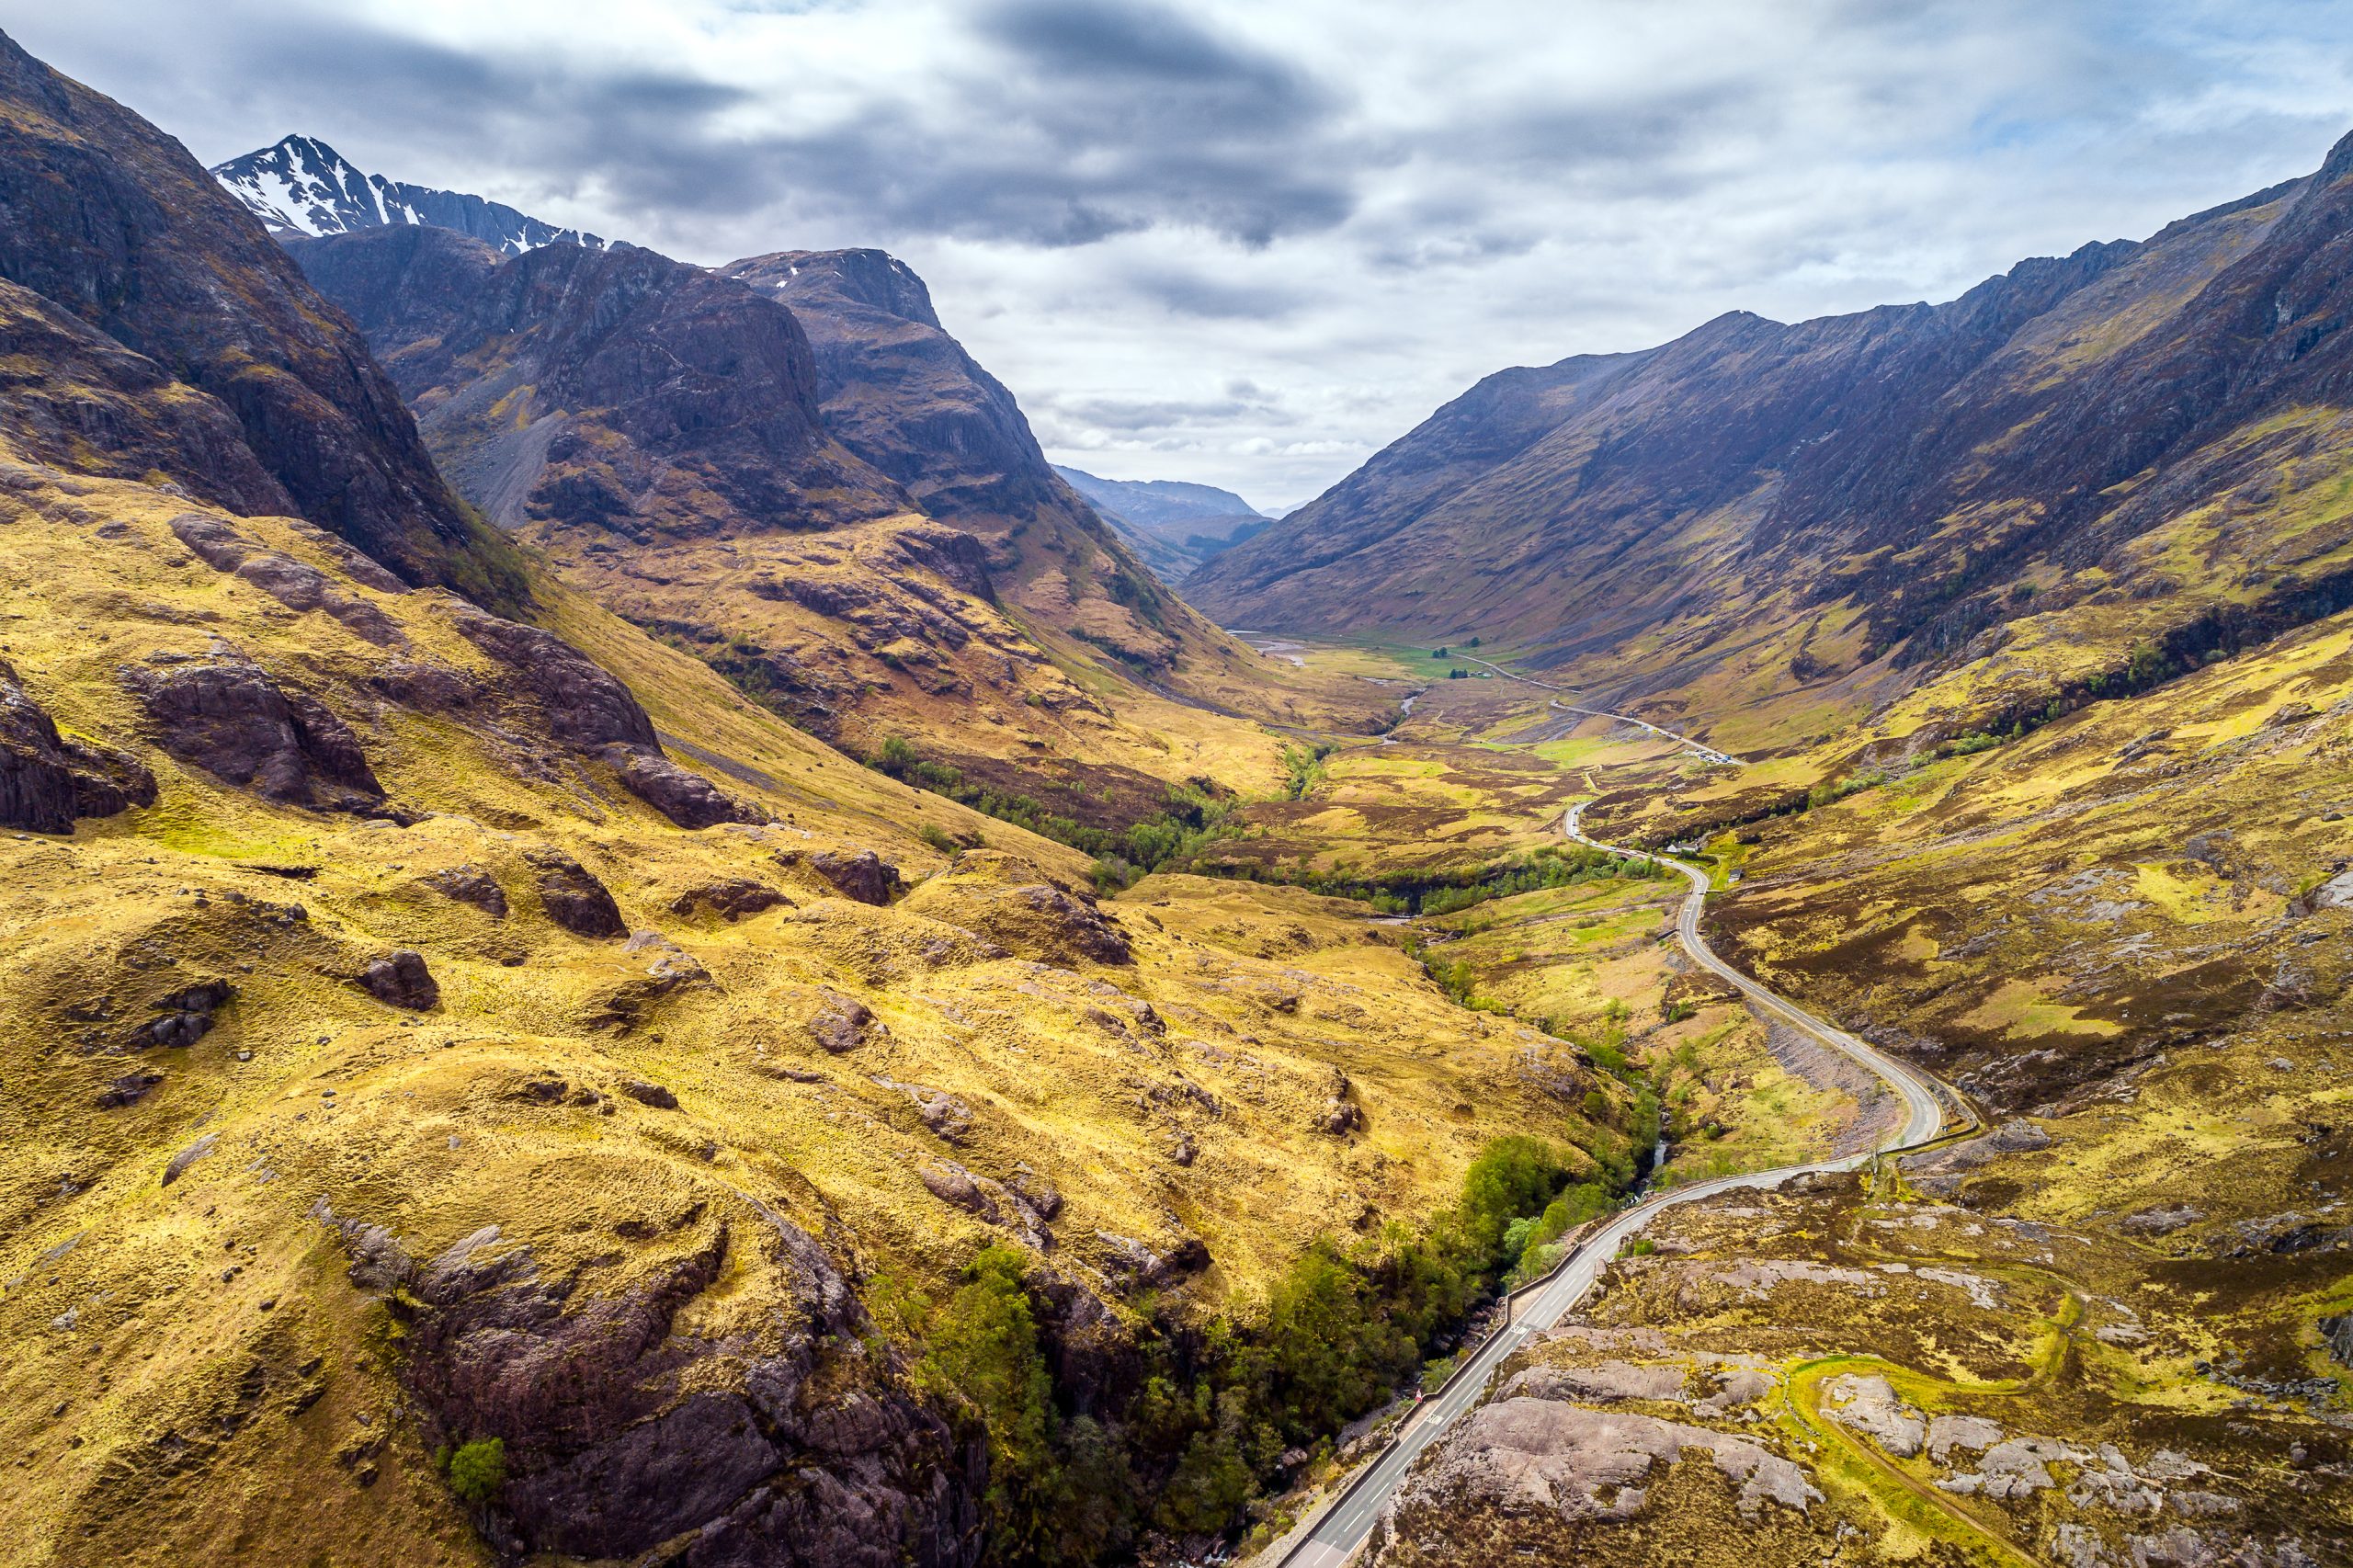
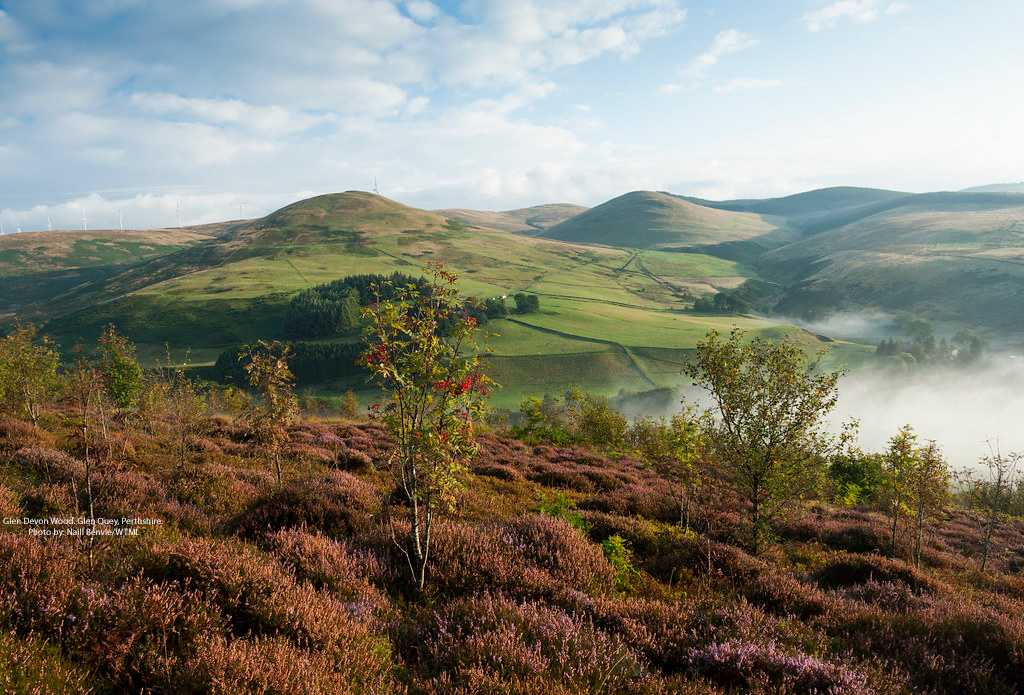
University of Glasgow
ArcGIS provided the research method in a project to better understand the variety of parks available across Great Britain.
The University of Glasgow has used Esri’s ArcGIS technology to objectively analyse 11,400 public parks across Great Britain and group them in five park types. The project delivers fresh insight into the diversity of parks available by region and has created a unqiue dataset that can be used to inform improvements to the nation’s invaluable greenspaces.
Researchers used multi-variate clustering tools in ArcGIS Pro to group parks by evaluating 18 park qualities
The ArcGIS outputs were ‘ground truthed’ in the field using mobile apps, created with ArcGIS Survey123
The university used solutions from the ArcGIS system at no additional cost through its existing CHEST Agreement
The Challenge
Recognising the benefits of greenspace for positive mental and physical health, the School of Health and Wellbeing at the University of Glasgow wanted to gain a better understanding of public parks in urban areas. It realised that while there are hundreds of public parks in towns and cities throughout Great Britain, these parks vary enormously in type, from those with simple patches of grass to those with sports facilities and cafés. It therefore launched a research project to categorise and analyse the distribution of different park types, right across the country.
“ArcGIS Pro has helped us to ceate an incredibly valuable new, nationwide dataset that can be used to help answer important questions about whether public access to types of parks is equitable across the country.”
Dr Jessica Hepburn, Research Associate in the Social and Public Health Sciences Unit, School of Health and Wellbeing, University of Glasgow
The Solution
This research was conducted by Dr Jessica Hepburn, Research Associate in the Social and Public Health Sciences Unit of the School of Health and Wellbeing, at the University of Glasgow. Part of a wider ‘Better Parks’ project funded by the Medical Research Council and NHMRC, the research was undertaken using Esri’s ArcGIS technology, a geographic information system (GIS) that the university was already using at a discounted rate through Jisc’s CHEST Agreement for the education sector.
First, the research team used ArcGIS Pro to consolidate and prepare relevant data, sourced from companies including Ordnance Survey, the UK Centre of Ecology and Hydrology, Sustrans and Copernicus. It then used the multi-variate clustering tool in ArcGIS Pro to analyse 11,400 parks and 18 different park qualities, ranging from the availability of public toilets to the percentage tree cover. Through this approach, the university was able to automatically and objectively sort the 11,400 parks into five park types.
To verify the findings of this ArcGIS Pro analysis, the research team next created a mobile data collection app using ArcGIS Survey123 and ArcGIS Online. This app included a map of all parks in Great Britain and a series of dropdown boxes to complete. A group of people then visited a sample of parks, recorded what they could see and selected the park type that they felt best described the park they were in. In this way, the university was able to consider subjective responses and understand how people perceive parks.
The research team carried out sensitivity and specificity analysis with ArcGIS Pro to create the final dataset of park types and then linked the park data with local authority data. As a result, researchers could explore how the distribution of different park types varied across the country. The analysis revealed, for example, that Newcastle has more biodiversity parks compared to the national average, while Glasgow has more sports-dominated parks.
“Using ArcGIS, the computations were pretty simple, but the value that we have derived from them is really great.”
Dr Jessica Hepburn, Research Associate in the Social and Public Health Sciences Unit, School of Health and Wellbeing, University of Glasgow
Benefits
Novel classification system for parks nationwide
Through this project, the University of Glasgow has created the first ever, objective classification system for all urban parks in Great Britain. “This is a really novel project as no-one has ever looked at park types on this scale before,” Hepburn says. “ArcGIS Pro has helped us to create an incredibly valuable new, nationwide dataset that can be used to help answer important questions about whether public access to types of parks is equitable across the country.”
Well-informed greenspace improvement programmes
The new park types dataset can be used to inform greenspace improvement programmes that have the potential to improve human health and wellbeing, as well as increase biodiversity and support net zero targets. For instance, over 75% of York’s parks are categorised as ‘low level’, indicating that there is huge potential for the city council to diversify and develop its greenspaces for people and nature. Across the UK, only 12% of parks are classed as sports parks, suggesting that nationwide initiatives may be needed to encourage the creation of more publicly-accessible, sports-focused parks.
Valuable data for urban planning
Local authorities will be able to make use of the new park types dataset when reviewing plans for new housing estates. They can consider which types of parks are lacking in the local area and ensure that these kinds of parks are incorporated into new development schemes. In both East Staffordshire and Bracknell Forest, over 12% of parks score zero across all feature types and cannot be categorised. While even ‘zero’ parks have some value for local people, councils can identify these parks and upgrade them by adding playgrounds, for example, to increase the variety of parks available to local people.
Simple technology-based research method
From a technical perspective, this project was not particularly complex, as the large scale, multifaceted analysis was all carried out automatically in ArcGIS Pro. “Using ArcGIS, the computations were pretty simple, but the value that we have derived from them is really great,” Hepburn says. “So many times, technology-based research projects can be overcomplicated and daunting, but this was very straightforward and offers a lot of potential for the future.”
Streamlined data verification process
The research team appreciated the close integration between ArcGIS Online and ArcGIS Pro, which enabled it to streamline the field-based data verification process, known as ‘ground truthing’. The ArcGIS Survey123 forms were very easy to use in the field and delivered results very quickly. “In some projects, doing ground truthing can be quite time-consuming and complicated. With ArcGIS Online, though, I can just click on a button to see ground truthing results spatially, straight away.”

West Midlands Police
We can direct police patrols to the right locations to protect citizens, using new intelligence from ArcGIS about harmful crime.
Amidst a shocking rise in knife crime and other harmful offences in the UK, one police force is using ArcGIS to help it implement more targeted neighbourhood policing. West Midlands Police now has a detailed understanding of harm hotspots and is using this intelligence to seize more weapons from the streets, reduce crime numbers and better protect citizens.
16% reduction in violent crime using hotspot analysis
500 weapons seized and 812 arrests in 12 months
£13 million reduction in cost of crime to society
The Challenge
Reducing knife crime in the West Midlands is both a challenge and an imperative. In the 12 months to March 2024, there were 7,000 recorded knife-related offences in the West Midlands, making this the region with the highest rate of knife crime per capita in England. Behind these numbers lie destroyed lives, broken families and frightened communities, so reducing knife-related offenses and other harmful crime is a top priority for West Midlands Police.
With funding from the Home Office, the force set up a new initiative, called Project Guardian, with the aim of using technology to identify hotspots of violent crime throughout the region. The force then planned to use this intelligence to precisely direct neighbourhood police officers to the right locations to help prevent harmful incidents, in a policing activity branded as Targeted Guardian Patrols.
“Our patrols can now act on intelligence from ArcGIS, focus their attention in the right places and help stop knife crime before it happens.”
Detective Chief Inspector John Askew, Project Guardian, West Midlands Police
The Solution
After receiving training from the Jill Dando Institute, analysts at West Midlands Police began by using Esri’s ArcGIS Pro software to analyse data on knife crime and other violent offenses in the region over the last three years to identify hotspots of ‘harm’. This process resulted in the creation of an interactive map, showing circular hotspots of violent crime, each around 0.2 km in diameter.
Next, analysts conducted geospatial analysis of the last 100 offenses to identify ‘risky facilities’ like nightclubs, bus stations and fast-food outlets, within the hotspots, where there is a higher probability of a serious incident. They also used the 80/20 tool in ArcGIS Pro to identify the most criminogenic streets within hotspots. With these techniques, and others, the force succeeded in gaining an incredibly detailed understanding of violent crime, street by street and property by property.
To further strengthen its crime intelligence, the force incorporated harm scores into its analysis using the ArcGIS Pro density clustering tool. In this way, it was able to pinpoint the locations where high levels of harm occurred within and outside of the initial hotspots, identify specific premises associated with high harm and increase police patrols in these areas.
West Midlands Police is now using ArcGIS Pro to monitor changes in crime levels. It can repeat its ArcGIS Pro analysis and use techniques such as weighted displacement difference analysis to show the impact of tactical policing methods. It can then rapidly refocus its activities, as hot spots diminish in some areas and emerge in others, to stay one-step ahead in the fight against serious crime.
Compared to other geospatial analysis products used within the force, ArcGIS Pro is easier to use and offers more sophisticated functionality. “There are so many things in ArcGIS that make our analysis better, quicker and more accurate, ”says Katy Cox, a Higher Analyst working on Project Guardian. “ArcGIS also saves analyst time, which enables us to carry out more analysis and deliver additional intelligence to police officers.”
“ArcGIS also saves analyst time, which enables us to carry out more analysis and deliver additional intelligence to police officers.”
Katy Cox, Higher Analyst, Project Guardian, West Midlands Police
Benefits
Deeper understanding of harm hotspots
Through the use of ArcGIS, West Midlands Police has improved its understanding of where most harmful crime occurs. It has, for example, discovered that 20% of harm, including stabbings, occurs in just 1.5% of the region. The map-based visuals, produced in ArcGIS Pro, make it easier for all police officers, throughout the force, to understand the analysis and see exactly which streets and locations present the highest risks for citizens.
Precise allocation of police resources
Using the new intelligence from ArcGIS, West Midlands Police can direct its Targeted Guardian Patrols to precisely the right locations, to help prevent more people from becoming victims. Analysis from ArcGIS Pro is used to inform location-specific SARA (Scanning, Analysis, Response and Assessment) plans, and has already contributed to a 16% reduction in violent crime across fifteen SARA areas.
Effective action to stop knife crime
ArcGIS-derived intelligence directly informed the locations of 35,000 hours of patrol between January 2024 and January 2025, leading to the siezure of over 500 weapons and 812 arrests. “Communities in the West Midlands are understandably deeply concerned about knife crime,” says Detective Chief Inspector (DCI) John Askew from West Midlands Police. “Our patrols can now act on intelligence from ArcGIS, focus their attention in the right places and help stop knife crime before it happens.”
Cost of crime reduced by over £13 million
While Project Guardian is primarily focused on reducing deaths and injuries from violence on streets, West Midlands Police is aware that its Targeted Guardian Patrols are also having an impact on crime in general and thereby reducing the cost of crime on society. Across all the Targeted Guardian Patrol Areas, West Midlands Police reports that its use of ArcGIS has helped it to reduce the annual cost of crime on society by over £13 million.
Improved collaboration with partners
West Midlands Police is able to share its analysis with partners, to support collaborative efforts to remove conditions that give rise to increased crime. For example, the analysis helps West Midlands Police to open conversations with local authorities about where they should make investments in street lighting, CCTV, trading standards enforcements and waste collection to create safer streets.

London Borough of Harrow
In our first steps towards creating a digital twin of the borough we are already delivering cost savings for the council and benefits for local citizens.
The London Borough of Harrow has begun a journey to create a fully-interactive, three-dimensional digital model of the borough, while minimising development costs. Already, this emergent digital twin has delivered thousands of pounds in cost savings, facilitated more productive working practices and is starting to transform the public consultation process for new planning applications.
3D, interactive, digital views of Harrow, created for public and internal use in ArcGIS Online and ArcGIS Enterprise
High-resolution, aerial imagery, captured with a low-cost drone, processed using SiteScan for ArcGIS
BIM models easily integrated into urban models using out-of-the-box functionality in ArcGIS Online Scene Viewer
The Challenge
The Digital Services Team at the London Borough of Harrow aspired to create a 3D interactive, digital model of the whole borough, covering everything from parks and historic buildings to modern developments. It was convinced that this digital twin would have the potential to deliver significant, long term financial benefits for the council, as well as improve citizen engagement in the planning process. However, like all public sector organisations, it had a limited budget, so needed to find a way to deliver its vision using its existing technology, low cost resources and affordable data assets.
“ArcGIS enables us to drop 3D plans for new buildings into a 3D world and show how they fit into the existing environment.”
Sam Tizzard, GIS and Data Manager, London Borough of Harrow
The Solution
The council already had licenses to use Esri’s geographic information system (GIS) technology, so decided to build its 3D digital twin using Esri’s ArcGIS system. After seeking advice from Esri UK, the Digital Services Team discovered that it could access an ‘interim’ low-resolution mesh model, created solely from 5cm aerial images, from one of Esri UK’s partners, Bluesky. It therefore began by creating a baseline 3D model of Harrow in ArcGIS using this high-resolution imagery to create a low resolution mesh of the borough, which was more cost effective than using LiDAR data.
Next, the council purchased a lightweight, entry-level drone for just £1,000 and began to capture high-resolution aerial imagery of key buildings and facilities across the borough where images with greater magnification were specifically needed. It developed a standardised, well documented and repeatable approach to using the drone safely, using Esri’s ArcGIS Survey123 form-building app.
It then used SiteScan for ArcGIS, Esri’s cloud-based drone mapping solution, to process the drone imagery and create 3D models for public viewing in ArcGIS Online and for internal use in ArcGIS Enterprise. In the initial pilot, the council used the drone to model three buildings and two public parks, and there are now requests to model 380 further sites across the borough. The imagery captured through this process is incredibly detailed, enabling people to zoom in to see the condition of individual slates and gutters on rooves.
The council has also started integrating BIM (building information modelling) drawings into its 3D model of the borough, using out-of-the-box functionality in ArcGIS Pro and ArcGIS Online Scene Viewer. For example, citizens can view a proposed development in Milton Road and better understand how this modern building will look, next to a traditional terrace of homes and shops. As Sam Tizzard, the council’s GIS and Data Manager, explains, “ArcGIS enables us to drop 3D plans for new buildings into a 3D world and show how they fit into the existing environment.”
In another confident step towards the creation of a comprehensive 3D digital twin of Harrow, the council has begun to combine its high-resolution drone imagery, low-resolution digital terrain models, BIM data and street view images, all in one place, in ArcGIS Enterprise. It is achieving this using the ArcGIS Maps software developer kit (SDK) for JavaScript and plans to further develop this app with support from Esri UK’s Professional Services team.
“The potential for cost savings through roof inspections alone is huge.”
Sam Tizzard, GIS and Data Manager, London Borough of Harrow
Benefits
Reduced costs in building maintenance
Although it is still early days, the new 3D digital model of Harrow is already delivering significant cost savings for the council. For instance, the council was able to view the drone-captured imagery of Headstone Manor in ArcGIS Enterprise to inspect the condition of the roof. ArcGIS removed the need for a planned on-site inspection and saved the council £9,000 in scaffolding and labour costs. “We estimate that a similar roof inspection of the leisure centre would cost in the region of £20,000, so the potential for ongoing cost savings through roof inspections alone is huge,” Tizzard notes.
Improved citizen engagement in planning process
Harrow Council now has the ability to show citizens 3D models of proposed new planning developments in a 3D context, for the first time. This will improve citizen engagement in the planning process and reassure residents about the impacts of new developments. “ArcGIS is enabling us to be more transparent with citizens,” says Tizzard. “We can help people visualise planning applications and better understand how their neighbourhoods are improving.”
Substantial time savings for council staff
Council staff, such as the highways team, can view the borough from their desks and reduce the number of on-site visits required. For example, streetview imagery, integrated with ArcGIS Enterprise, currently receives around 3,000 hits per month. The Digital Services Team estaimates that if one in three of these hits would have been a site visit, the saving could be the equivalent of 6 people’s job roles, ensuring people’s time is better spent on other tasks.
Greater awareness of greenspaces and public amenities
The Digital Services Team believes that there will be many and varied benefits of the 3D borough model over time, because it is so versatile. For example, as the model includes high-resolution 3D views of parks and public facilities like leisure centres and arts venues, it could be used to raise awareness of local open spaces and their amenities. Tizzard observes that “The council could use ArcGIS to show off its Green Flag parks and open spaces to encourage people to use them as part of the ‘Healthier Harrow’ campaign.”