Blog Archives

South Ayrshire Council
Esri Story Maps have put energy and imagination into our communications with citizens, local businesses and employees.
Using configurable apps from Esri, South Ayrshire Council has developed over 25 informative Story Maps to communicate information to citizens, businesses and its own employees. These highly versatile, interactive maps don’t just tell a story; they engage people in local issues, support the local economy and improve the efficiency of council operations.
Increased citizen engagement in local policy issues
Greater understanding of development priorities, helping boost the local economy
Captivating publicity for South Ayrshire, supporting the region’s tourism industry
Effective employee communications, leading to cost efficiencies
The Challenge
All local authorities in the UK need to engage successfully with citizens, to keep them informed about policies, events and opportunities. Likewise, councils have to communicate effectively with local and national businesses, giving them the information they need to help them expand their operations, exploit new business opportunities and contribute to the economic growth of the region. But, as most local authorities in the UK will attest, it can be difficult to attract and sustain the attention of these external audiences.
South Ayrshire Council was acutely aware of the challenges of sharing information and getting local people to engage with its policies. In particular, it wanted to increase public awareness of its Local Development Plan, a strategic policy document that sets out the council’s land use priorities. It had published a copy of the plan on its website, but this pivotal document – which could potentially impact on the lives, homes and businesses of over 111,000 people in South Ayrshire – was only downloaded 1,500 times in 12 months.
The genius of the Esri Story Map is the tying together of maps, images and text, in one place, in an interactive format
Stewart McCall - Senior Systems Analyst, South Ayrshire Council
The Solution
A longstanding user of Esri geographic information system (GIS) solutions, South Ayrshire Council discovered Esri’s Story Map templates and recognised their potential value as a means of making information much more accessible and meaningful for citizens. “The genius of the Esri Story Map is the tying together of maps, images and text, in one place, in an interactive format,” says Stewart McCall, Senior Systems Analyst at the council. “The narrative beside the interactive map makes it very clear what the map shows and why it is important, while the images draw people in and make the Story Maps compelling to view.”
The council began by producing a Story Map for its Local Development Plan that combines maps of the area with high quality images and the actual policy wording. Accessed via the council website, the Story Map clearly sets out where new commercial developments, like retail units, will be permitted, advises on the best sites for wind farms and simplifies policy around residential planning restrictions. In recognition of this ground-breaking new approach to publishing the Local Development Plan, South Ayrshire Council was named the overall winner in the Scottish Awards for Quality in Planning 2016.
Within weeks the GIS team became inundated with requests for additional Story Maps from other council departments, ranging from procurement to housing. Interestingly, these requirements weren’t all for Story Maps to engage with external audiences; demand also emerged for Story Maps to help communicate information to council employees. According to McCall, there is now “at least one new Story Map request every ten days,” so he has trained ten colleagues, from a cross-section of departments, to help him keep pace with demand.
We now have a rapidly growing portfolio of over 25 Story Maps that play a valuable role in improving communications with citizens, businesses and colleagues
Stewart McCall - Senior Systems Analyst, South Ayrshire Council
The Benefits
Increased citizen engagement in local issues
Story Maps have proven highly effective in encouraging citizens to become better informed about and more involved in local issues. The Local Development Plan Story Map, for instance, was viewed nearly 4,500 times in just six months and was accessed more times in the first five weeks than the pdf plan had been downloaded in 12 months. Another Story Map, produced to clarify proposed ward boundary changes, incorporated Esri’s QuestionWhere survey app, and provided a direct means for citizens to comment on and influence council plans.
A welcome boost for the local economy
As well as the Local Development Plan, South Ayrshire Council has produced a Story Map that shows vacant land and derelict sites. The clarity of the information presented in Story Maps like these makes it far easier for home owners and commercial organisations to recognise development opportunities, understand council policies and make appropriate planning applications that are more likely to obtain planning permission. In time, the council anticipates that its Story Maps will help increase the number of commercial, industrial and residential developments in South Ayrshire and invigorate the economy of the region.
Highly attractive and captivating publicity for South Ayrshire
Enriched with quality imagery, the Story Maps help to promote South Ayrshire as a destination for visitors and support the local tourism industry. For instance, the council created a Story Map for the Open Golf Tournament, converting information from a dense 40-page Traffic Management document into a highly visual, interactive resource. The Story Map clarified how to get to the venue, where to park and how to use public transport and was viewed over 5,000 times in just two weeks.
More effective employee communications
Recent Story Maps, developed for internal use, have significantly improved employees’ understanding of corporate policies and procedures, contributing in some cases towards cost savings. One example is the Story Map named ‘Better Mail Management,’ which shows employees how to handle mail and where to find franking machines, guiding them to the most cost effective methods of sending mail. “We now have a rapidly growing portfolio of over 25 Story Maps that play a valuable role in improving communications with citizens, businesses and colleagues,” McCall says.


Carlow County Council
The council has created 'Planning GIS' an advanced, semi-automated planning application management system using ArcGIS, integrated with iPlan.
At a time when the Irish economy is beginning to revive and new development projects are taking off again, Carlow County Council is set to process a significant increase in planning applications with the same number of employees. It has used Esri’s ArcGIS platform to transform its planning application system and deliver a high quality of service for citizens.
Planners are saving time thanks to automated GIS analysis capabilities
The council has better information to support faster, well informed planning decisions
Citizens, developers and professionals have better access to information online
The Challenge
The IT systems used to process planning applications in the town and county of Carlow in south-eastern Ireland had become outdated. They were slow and unreliable and, to make matters worse, the IT vendor had announced that it would be discontinuing support. So, when Carlow County Council was required to merge with Carlow Town Council in 2014, this significant reorganisation provided precisely the catalyst needed for a brand new approach to managing planning applications.
In a recovering economy, we will be able to process a far larger volume of planning applications and deliver a service that is low in cost and high in quality
William Barry – IS Project Leader, Carlow County Council
The Solution
Having used Esri’s ArcGIS Online for nearly two years and been highly impressed by it, Carlow County Council approached Esri Ireland for help in designing and developing a state-of-the-art planning application system, based on geographic information system (GIS) technology. The resulting solution, known internally as ‘Planning GIS’, is based on Esri’s ArcGIS platform, seamlessly integrated with the council’s existing iPlan planning administration database.
Now, when new planning applications are received, the site location maps are digitised and verified, to make sure that site details are correct. The planning register is then accessible to employees right across the council and can also be accessed by the general public and commercial organisations via an ArcGIS web map service.
ArcGIS then automatically draws in supplementary information from external sources, including the National Parks and Wildlife Service, Office of Public Works and the Department of the Environment. Using these diverse data sets, it automatically analyses the site location, detects potential conflicts, such as proximity to a special area of conservation (SAC) and presents planners with all of the relevant spatial information necessary to make better informed planning decisions.
To further enhance its planning application process, Carlow County Council has scanned and geo-registered its vast collection of old hardcopy planning maps using ArcGIS. Consequently, planners can open these historic maps from within the planning system, turn them on and off, or layer them over up-to-date maps, to gain a clear perspective on land changes over time. “Having ready access to this information is really important,” says William Barry, IS Project Leader at Carlow County Council. “We can see at a glance the planning history of a site and make decisions accordingly about necessary planning conditions.”
If an area is designated or is located close to a protected structure for example, planners can see that straight away
William Barry – IS Project Leader, Carlow County Council
The Benefits
Planning GIS has delivered significant advantages for Carlow County Council, including:
Greater internal efficiency
The automated analysis capabilities of Planning GIS help to improve the productivity of the council’s planners, by reducing the amount of time required to check site locations for potential environmental or historical conflicts. As Barry explains, this efficiency gain will be particularly important for the council when the number of planning applications increases in the future. “In a recovering economy, we will be able to process a far larger volume of planning applications and deliver a service that is low in cost and high in quality,” he says.
Better-informed decisions
As planners have instant access to the full history of a particular site and all the environmental data that relates to it, in one place, they are able to make faster, better decisions. “Everything we need is there in front of us,” Barry observes. “If an area is designated or is located close to a protected structure for example, planners can see that straight away.”
Added support for developers
Developers, construction firms and other organisations working in the building industry can use the ArcGIS web feature service to view the council’s planning register on demand. Consequently, they don’t have to waste time visiting the planning office for information and have better insight into upcoming projects. As Barry says, the planning application “Helps the local construction industry as a whole, by allowing developers and other professionals to do their jobs more efficiently.”
Improved services for citizens
Employees across all departments in the council can access Planning GIS to help them make better long-term decisions about new road infrastructure projects and other public services, to ensure that investment is made in the right areas to meet the needs of citizens. Equally, individuals and companies, who have applied for planning permission, can now monitor the progress of their applications online and don’t have to keep phoning the council for updates.
More reliable IT
Finally, the council’s IT department is now relieved of the pressure of trying to maintain an IT system that had begun to outlive its usefulness. “Planning GIS is a faster, more responsive and more reliable system,” reports Barry, adding simply, “It just works well.”

OSI GeoHive
Our online mapping service provides access to data from multiple public sector organisations and is used to improve decision-making and reduce costs in Ireland.
Ordnance Survey Ireland (OSi) has an online mapping service that helps to unlock Ireland’s vast reserves of geospatial data. Called GeoHive, this free web app is supporting the Irish economy and helping to deliver cost savings for public and private sector organisations.
GeoHive provides a single portal to hundreds of layers of geospatial data from multiple public sector organisations
Users can create and share meaningful maps of Ireland, for free, using any PC, laptop or mobile device
The solution presents trusted geospatial information to support evidence-based decision making
The Challenge
OSi is in no doubt of the incredible value that geospatial data can deliver for the Irish economy. In 2013 it commissioned an Economic Assessment of Ireland’s Geospatial Industry, which concluded that better use of location-based information could lead to annual cost savings of €82m in the public sector, time savings with an economic value of €279m and competition benefits of €104m. Inspired by these findings, OSi decided to take a lead in making Ireland’s vast geospatial data resources more widely available via the Internet.
The national mapping organisation already had an online map viewer, which attracted over 1.5 million unique visitors a year. However, the technology behind this web service was becoming out dated and couldn’t deliver digital cartography to tablet and mobile devices. OSi therefore launched an ambitious project to replace its existing map viewer with an online portal that would improve the user experience, as well as make third party, public sector data easily accessible from a single location.
ArcGIS has enabled OSi to deliver a service that has the potential to really boost the value of geospatial data to the Irish economy.
Colin Bray, Chief Executive, Ordnance Survey Ireland
The Solution
A long-standing user of Esri geographic information system (GIS) technology, OSi worked closely with Esri Ireland to completely redevelop and modernise its online mapping capability, using Esri’s ArcGIS platform. Named GeoHive, the free-to-use web service now delivers significantly enhanced facilities for users, including a ‘make your map’ capability. “For the first time, users can access current and historical OSi maps on their mobile phones and tablets, whenever they need them,” explains Hugh Mangan, general manager of business and marketing, OSi. “GeoHive also gives users the ability to create maps in a much simpler way, save them and share them instantly with colleagues using any device.”
Most importantly, GeoHive combines OSi mapping with data from a wide range of public sector partners, to create an authoritative national Spatial Data Infrastructure. “GeoHive is a classic portal, in that it provides an access point to lots of existing sets of spatial data that have already been published,” Mangan says. “However, it is unique in Ireland in the way that it combines hundreds of layers of third party data from multiple public sector bodies and presents them seamlessly to the end user from a single site.”
In 2018, as part of an ArcGIS software upgrade, OSi took the opportunity to incorporate further datasets, tools and functionality into GeoHive, to expand and enrich the geospatial data and apps available to end users. In particular, users can now view geostatistical information about Ireland through the GeoHive platform, as part of a single data catalogue, for the first time.
GeoHive also gives users the ability to create maps in a much simpler way, save them and share them instantly with colleagues using any device.
Hugh Mangan – General Manager of Business and Marketing, OSi
The Benefits
The online portal delivers:
Greater access to geospatial information
With the development of GeoHive, OSi is now able to expose many more individuals and organisations to the vast reservoirs of geospatial data that exist in Ireland. From one single website, users can combine and layer different data sets against the background of up-to-date OSi maps, to uncover fresh insight into situations and easily share that information using mobile devices.
Trusted evidence to support investment decisions
GeoHive has helped to encourage new investments in Ireland, supporting the Irish economy. “If a business owner is considering opening a new office or factory in Galway, GeoHive presents all the information that they need to help them understand the area and make informed decisions,” Mangan says.
Substantial opportunities to make cost savings
OSi is confident that GeoHive plays a key role in helping organisations to improve their efficiency and thereby unlocks the significant cost savings opportunities identified in its Economic Assessment of Ireland’s Geospatial Industry. According to OSi’s chief executive, Colin Bray, “ArcGIS has enabled OSi to deliver a service that has the potential to really boost the value of geospatial data to the Irish economy. By making location-based data more accessible, useable and meaningful for everyone, GeoHive will help public and private sector organisations to reduce costs and save time.”
Improved public services for citizens
GeoHive enables all participating public sector organisations to deliver a better customer service, by making their data more accessible to a wider number of potential users. Citizens can not only find public information more easily, but also have simple-to-use tools to help them apply it to their areas of interest and make informed choices that will enrich their lives. Summing up, Mangan observes, “GeoHive provides a window to a wider world.”

Knight Frank
We undertake in-depth location analysis in ArcGIS so that our client can confidently select the locations that will offer the least risk and greatest potential profitability.
The independent real-estate consultancy Knight Frank is using Esri’s ArcGIS platform to help leading retail organisations find the most advantageous sites for new stores across the UK. By performing geospatial analysis on a wide range of factors, the firm can guide its clients quickly towards precisely those locations that are most likely to maximise profitability and reduce risk.
Knight Frank provides in-depth, location-specific analysis so retailers can make better informed decisions
Clients have all the information they need to choose locations that will maximise their profitability
Retailers can react quickly to secure the most advantageous sites in UK high streets and shopping centres
The Challenge
Named ‘Global Real Estate Adviser of the Year 2016’ in the annual Estates Gazette Awards, Knight Frank is one of the world’s leading independent real-estate consultancies, with 411 offices in 59 countries and 14,000 employees. More than 50% of Knight Frank’s business relates to commercial property, so it is vitally important for the company to be able to provide highly professional and value-added services for commercial clients.
From experience, Knight Frank knew that many commercial organisations have an unstructured approach to choosing locations for their business premises or retail outlets. Businesses often have a choice of potential sites throughout the UK and around the world for new properties, but, for a range of reasons, are not able to adopt a standard approach that considers the suitability, and likely profitability, of potential sites in a comparable way. As a result, businesses cannot quickly hone in on the most suitable locations, which increases costs and accentuates business risks.
To address this issue, Knight Frank’s Commercial Research Department, based at the company’s UK headquarters, set out to develop a structured, evidence-led approach to qualifying potential new business locations. It wanted to make relevant, meaningful, client-specific information available to its internal teams, enabling them to deliver superior property services for commercial clients, which include food retailers, leisure stores and chains of coffee shops.
With the evidence we provide from ArcGIS, our clients can have greater confidence in their decisions and can pick the locations that will offer the least risk and greatest potential profitability
James Nolan – Senior Geospatial Analyst, Commercial Research Department, Knight Frank
The Solution
Knight Frank uses Esri’s ArcGIS platform for its location analysis services primarily due to its flexibility, as James Nolan, Senior Geospatial Analyst at Knight Frank, explains. “For the breadth of analysis that we wanted to do and the diverse range of clients that we work with, we needed a highly flexible resource,” he says. “ArcGIS has advanced geospatial tools and allows us to input data from a variety of sources. It’s a very powerful, very flexible GIS.”
The firm now uses Esri’s ArcGIS Desktop and hosted services from Esri UK to:
- Create highly targeted, detailed and client-specific databases, including data such as demographics, existing business premises and competitor locations
- Perform geospatial analysis to assess the proximity of target customers and create catchment areas
- Generate travel isochrones which are added as layers of information on a multi-dimensional map
- Include research into changing consumer and retail trends, such as the spending patterns of millennials and the growth of the discount food retail sector
- Use Esri’s viewing software, Arc Scene, to interpret the distance and time taken to travel between sites
- Hone the results by adding or removing criteria, to precisely identify the best business locations
ArcGIS puts Knight Frank in a stronger position to advise its clients quickly about the suitability of available sites
James Nolan – Senior Geospatial Analyst, Commercial Research Department, Knight Frank
Benefits
Higher quality, evidence-based property services
Through its use of ArcGIS, Knight Frank is now able to pinpoint the optimum business locations for specific organisations and thereby offer an enhanced quality of service for its commercial clients. It can combine research into the consumer behaviour of millennials, or the activities of competitors, with detailed population statistics to identify up-to-the-minute opportunities for retailers and then present thorough, relevant analysis to help its clients make well-informed decisions about new retail ventures.
Reduced risk in multi-million pound investments
Critically, Knight Frank’s structured, GIS-led approach helps to reduce risk for clients, in what can be multi-million pound investment decisions. For instance, once a potential new location for an established retailer has been identified, Knight Frank can find an existing store with a similar demographic and geographic profile. If this comparable store is doing well financially, the client has some reassurance that the risk of business failure at the new location is low. “With the evidence we provide from ArcGIS, our clients can have greater confidence in their decisions and can pick the locations that will offer the least risk and greatest potential profitability,” Nolan says.
Faster time-to-market for commercial enterprises
Knight Frank is able to carry out almost all of its location analysis using ArcGIS, third-party intelligence and publically available data sets, before sending surveyors out into the field. This combination not only results in significant cost efficiencies, but also speeds up the location search process, allowing clients to secure the most advantageous sites ahead of their competition and reduce their time to market. “When retail units in popular shopping malls and key high streets become available, there can be strong competition from multiple retailers for that location,” Nolan explains. “ArcGIS puts Knight Frank in a stronger position to advise its clients quickly about the suitability of available sites.”

Galway County Council
Our rapid deployment of a new web GIS service during the Galway floods enabled us to coordinate a fast and effective emergency response that ultimately helped protect property and safeguard lives.
When exceptional flooding occurred in the west of Ireland, Galway County Council employed Esri’s ArcGIS to coordinate a fast and effective emergency response. The council’s rapid and intelligent use of mobile and web GIS technology helped it protect property and safeguard lives during the crisis.
The GIS solution improved public safety by making up-to-date flood information instantly accessible to everyone
ArcGIS supported multi-agency coordination during the emergency, leading to better decision making
GIS helped give the public, partners and employees confidence in the council’s ability to handle the incident
The Challenge
In December 2015, a chain of severe storms swept across the county of Galway, causing devastating floods. 472 properties became cut off, 62 homes were flooded and major transportation routes became impassable, leading to significant concerns for public safety.
Right from the outset, when the first flood warnings were issued, Galway County Council was acutely aware of the challenges it would face. A similar flooding incident had occurred in the county six years before and, on that occasion, the council had struggled to collect data about the rising flood water quickly enough to support the emergency response. It also hadn’t had an effective mechanism for sharing information with the public and stakeholders. This time, however, the council was better prepared. It had recently implemented new geographic information system (GIS) technology from Esri Ireland, which gave it the ability to react incredibly quickly to the emerging crisis.
The out-of-the-box functionality of ArcGIS allows us to develop new GIS web services and apps at a moment’s notice and address the challenges of a rural county, as they occur.
Mark Conroy – IS project leader, Galway County Council
The Solution
Galway County Council had replaced all of its separate, multi-vendor GIS packages with Esri’s ArcGIS. In tandem, it had used ArcGIS server to create the council’s first centralised store of spatial information, eliminating multiple databases, removing data duplication and making a single source of accurate data available to all of the council’s GIS apps. “For the first time, ArcGIS gave us seamless integration of data and GIS services across mobile, desktop, server and web platforms, online and offline,” says Mark Conroy, IS project leader at Galway County Council.
While the 2015 storms still raged over Ireland, the council used ArcGIS to quickly set up a GIS-based web service to capture information about the floods and store it in the cloud using ArcGIS Online. It then used the ArcGIS Collector App to allow regional engineers, technical staff and other council employees to conduct surveys in the field and upload flood details to the web service via their smart phones and tablet devices. At the same time, staff in council offices used ArcGIS desktop to add information about road closures and uploaded new satellite imagery when it became available. All this information was combined on interactive maps in ArcGIS Online, with no manual intervention, and made visible immediately to all staff, partners, the general public and the media.
Everyone could follow the progress of the flooding, see which roads were closed and plan safer routes accordingly. By enabling us to share flood information instantly, ArcGIS certainly helped us to improve public safety.
Mark Conroy – IS project leader, Galway County Council
The Benefits
A faster emergency response
The use of ArcGIS enabled Galway County Council to see precisely which homes and businesses were in danger of flooding and deploy resources promptly to those places where they were most needed. Rather than wasting time collating data and responding to requests for information, staff could instead focus on making arrangements for drains to be cleared, roads to be raised and culverts to be dug. 63 properties were saved from immediate threat in the wake of the storms, thanks to the timely implementation of such protective measures.
Greater public safety
Galway County Council was able to use Twitter, Facebook, the council web site and local media to direct people to its online flood map and keep citizens informed about areas of risk. “The general public was getting updated information as quickly as we were in the council,” says Conroy. “Everyone could follow the progress of the flooding, see which roads were closed and plan safer routes accordingly. By enabling us to share flood information instantly, ArcGIS certainly helped us to improve public safety.”
Improved multi-agency coordination
Every day during the height of the crisis, Galway County Council used its ArcGIS maps to help it share situational information with partners including the Office of Public Works, Health Service Executive, the Gardaí and defence forces who were called in to assist. The maps helped the different agencies to better coordinate their activities and make effective decisions. Conroy observes, “Without a doubt, ArcGIS played a key role in helping us to focus on vulnerable households, deliver constructive support and alleviate suffering in the worst affected communities.”
Increased confidence in the council
Now that the flood waters are subsiding, Galway County Council looks back on its handling of the crisis with satisfaction, knowing that no lives were lost in the county. It also has a full GIS-based record of the extent of the flooding, which will help it collaborate with the Office of Public Works to plan flood alleviation and mitigation schemes going forward. “ArcGIS has helped give internal employees, partners and the general public confidence in the council’s ability to manage floods and other similar emergencies,” Conroy notes. “When the next incident arises, we can be confident that we have the ability to handle it quickly and effectively.”

Education Authority Northern Ireland
Our new web app makes it easy for parents to check if their children are eligible for free school bus travel and submit an application, freeing up staff time to focus on new projects
Parents in Dungannon, Northern Ireland, can now use an ingenious little web app to check if their children are eligible for school bus travel and apply online. The solution, developed by Esri Ireland, has received enthusiastic feedback from families following a highly successful pilot.
Greater convenience and better information for parents
Potential time savings of over 58 days a year, when the app is rolled out nationally
More accurate address information to assist decision making
The Challenge
Among its numerous responsibilities, the Education Authority is required to facilitate transportation for pupils who live more than a stipulated distance away from their allocated grant-aided school. Northern Ireland is a predominantly rural country and, as a consequence, over 90,000 children are eligible for free travel on school buses.
Every summer the Education Authority must consider in excess of 25,000 new applications in time for the start of the academic year. It is a very complicated process, which involves measuring the walking distance to school for each individual applicant and ensuring that all decisions about whether or not to fund transportation are made both quickly and fairly. Until recently, this entire process was driven by information collected and communicated in paper-based forms.
“The time had come to change this,” says Dale Hanna, transport manager at the Education Authority, Southern Region. “We want to make it really easy for parents to find out if their children are eligible for free travel and then submit accurate information for the application process online.”
When the GIS web app is rolled out nationally, we expect to save over 58 says a year, which will free up staff to focus on delivering other important educational services
Dale Hanna – transport manager at the Education Authority, Southern Region
The Solution
To help it achieve its goal, the Education Authority approached Esri Ireland and asked it to use Esri’s geographic information system (GIS) technology to create a web-based app that would be mobile friendly and accessible 24/7. Developed using Esri’s ArcGIS Platform, the solution integrates live Ordnance Survey map services and address data from Land and Property Services (LPS).
This ingenious app is now up-and-running as a pilot and available to parents of pupils moving from primary to post-primary education in the Dungannon area. When parents log in, a screen is presented that is already prepopulated with all of the pupil’s details. A map view shows the street where the pupil lives and an arrow marks the assumed location of the house or flat. If the arrow is in the wrong place, parents can simply slide the map using their touch screen or curser to indicate the precise location of the property.
When parents tap the ‘submit’ button, the GIS-based app automatically calculates walking distances. If the pupil is clearly eligible, parents will receive an instant ‘yes’ response, and their application is automatically forwarded to the transportation team. Equally, if the pupil is evidently not eligible, parents are immediately notified. In other cases, such as if pupils live in areas marginally outside the eligible distance, the applications are forwarded for more detailed consideration. “It’s beautifully simple, yet a terrific demonstration of the power of digital geography,” says Eamonn Doyle, chief technical officer at Esri Ireland.
This app moves our engagement with citizens to the next level and, in doing so, improves the quality of service to our customers
Colm Daly – information manager at the Education Authority, Southern Region
The Benefits
A convenient service for parents
The school transport app has transformed the quality and availability of information for parents. In the majority of cases, parents can get an instant answer to the question ‘is my child eligible for school transport?’ Parents also have the convenience of being able to apply for transportation online, and don’t have to fill in lengthy forms. “The feedback from parents has been very positive,” says Colm Daly, information manager at the Education Authority, Southern Region. “This app moves our engagement with citizens to the next level and, in doing so, improves the quality of service to our customers.”
Greater public confidence
The new online app also helps to give parents a better understanding of the eligibility criteria for school transport and instils greater confidence in the application process. Whereas previously, the Education Authority only received a postal address for applicants in its paper forms, it now receives emails with a precise map and the coordinates of pupils’ homes. “This helps us to make better, faster decisions,” Daly states, adding that, “the app may over time reduce costly appeals.”
Improved operational efficiency
The Education Authority can now operate more efficiently in the pilot area, as it no longer has to waste time processing applications from parents who have used the app and discovered that they are not eligible. “In our Dungannon pilot, 15% of the people who used our app received a ‘no’ response,” explains Hanna. “We estimate that it takes 10 minutes to manually process a ‘no’ application, so in the pilot phase alone we saved over one working day. Across the whole of Northern Ireland there are around 2500 ‘no’ applications every year. When the GIS web app is rolled out nationally, we expect to save over 58 days a year, which will free up staff to focus on delivering other important educational services. Additional efficiencies are achievable by future advancements in integration with our back office systems.”
Enhanced data quality
One additional, unexpected, benefit has emerged, as Daly explains. “Because parents can correct the locations of their homes on the online map, they are effectively doing quality control on the address data and that’s pretty interesting from a GIS perspective. It means that we can actually go back to LPS and other data providers in the future and supply them with updates. I don’t think that anybody else in the UK or indeed in Europe is doing that right now.”

South Dublin County Council
We consulted with the public to find out what information they wanted to access online and then built a new community web service so that citizens can access information on demand 24/7.
Responding directly to the needs and wishes of citizens, South Dublin County Council has used web and mobile solutions from Esri’s ArcGIS platform to create and enrich a new Community Facilities web app. This online service is expected to help improve the quality of life for people living, working and doing business in the area.
Accessible information about facilities that citizens can access to improve their lives
A service designed and created specifically to meet the needs of citizens
The ability to enrich and update the web app very efficiently with a small team
The Challenge
In its Corporate Plan 2015-19, South Dublin County Council set out its mission to make the county of South Dublin the “best possible place in which to live, work and do business.”
This strategic document clearly articulated the council’s focus on citizens, stating that “the health and well-being of the people of South Dublin County” would be a key measure of success. To help it achieve its mission, the council decided to create a new online, map-based information service to give citizens better information about nearby community facilities that they could use to help them lead healthier, more fulfilled lives.
The Solution
As a long-standing user of Esri technology, South Dublin County Council already had the ArcGIS Platform and GIS skills it needed to create its new web app, with no additional investment in software. It was also able to develop the solution very quickly and easily in-house, without the need for outside consultancy, using Esri’s ArcGIS Online and the available templates.
At the outset of the project, the council held a series of focus groups with members of the public, to find out what information citizens would find useful, and then designed the app to cover precisely these themes. Through this citizen engagement, the council received requests for data that it didn’t hold, such as information on allotments and accessible parking spaces around the county. Rather than leave this information out, and fail to meet citizens’ expectations, South Dublin County Council allowed employees to access ArcGIS Online from a wide range of tablets and smart phones, empowering them to collect the specific information citizens wanted to see.
In addition, South Dublin County Council sourced information for citizens by streaming data directly into its Community Facilities web app from third party organisations using web services. For instance, the council pulled in census information from AIRO, which saved time and avoided reinventing the wheel. Moving forwards, the council plans to use Esri’s Collector for ArcGIS app to allow staff members to collect supplementary data using mobile devices, to enrich the app while travelling around the county. As new information is collected, it can be uploaded directly into the ArcGIS Online app and made visible to citizens immediately.
The Benefits
The new GIS-based Community Facilities web service is now helping South Dublin County Council to achieve its corporate mission by:
Engaging with citizens to encourage healthier lives
The web service makes it very easy for citizens to discover local facilities that might help enrich their lives and enhance their sense of well-being. Whether they are looking for their nearest library or checking local sports facilities, all the information they need is easy to find in one simple web app.
Delivering just what the citizen wants and values
South Dublin County Council now has the impressive ability to collect and publish additional information for citizens very quickly – at a low cost for the council but with a high value for the general public. For example, it can now easily gather and share information about not only where social clubs and sports centres are located, but if these facilities offer yoga, boxing or chess clubs.
Empowering members of staff to work efficiently
Over recent years, the headcount within some council departments has reduced, so teams have to be able to work more efficiently to deliver a good service. The use of ArcGIS Online and the Collector for ArcGIS app enables the council to capture, update and publish information for citizens with smaller teams. The information can also be updated more often, making it more accurate, and updates are instantly visible online.
Improving decision making and strategic planning
While the app was first and foremost developed to deliver an enhanced service for citizens, it has also proven exceptionally useful as a decision support tool for senior executives. It is very easy to see, for example, whether play parks and youth facilities are located in the regions that have the highest densities of families with young children. Senior managers have an instant view of the facilities – or lack of facilities – in a given area, allowing them to focus on deploying new services where they are most needed and continually improve community facilities for citizens.

Silva Homes
We have enhanced core business processes such as tree surveys, anti-social behaviour and under occupancy using ArcGIS to support our company vision and transform lives, homes and communities
Driven by a clear vision to transform the lives of its tenants, Silva Homes is using Esri’s ArcGIS to innovate and enhance core business processes. Through the combined use of mobile, cloud and web-based GIS apps, the organisation has significantly improved the cost effectiveness, efficiency and quality of its housing services.
Tree surveys are conducted twice as quickly and tree risks are both better understood and better managed
Anti-social behaviour issues on estates are dealt with more rapidly and at significantly less cost
Under-occupancy rates are being reduced, by precisely matching tenants’ needs with suitable properties
The Challenge
Like all housing associations, Silva Homes has a duty to its board, stakeholders, investors and the industry regulator to offer value for money, demonstrate shrewd business management and deliver a high quality of service for tenants. It owns and manages around 6,000 rented homes in Bracknell Forest and surrounding areas, as well as 1,075 leaseholder properties.
The organisation’s aspirational vision is to “transform lives, homes and communities” and, to achieve this, it encourages innovation in all aspects of the business. Indeed, innovation is one of the “magnificent seven” values that Silva Homes has identified as being critical for its success. It defines innovation as “creativity with a job to do” and, in more ways than one, the organisation is making creative use of geographic information system (GIS) technology to drive the adoption of best practice approaches in the housing sector.
The mobile GIS solution for our Tree Team allows us to manage our portfolio of 10,000 trees with just two full time members of staff. We estimate that without this solution, costs would increase by at least £50,000 a year, and we would be unable to carry out necessary tasks in a proactive, cost effective manner
Andrew Keljarrett – Business Improvement Manager, Silva Homes
The Solution
Since 2010, Silva Homes has used a range of solutions from Esri’s ArcGIS to support the delivery of its services. The association has been able to easily integrate web, mobile and cloud-based apps, to create seamless, GIS-driven processes, and thereby implement innovative new approaches to service delivery.
In brief, it uses:
- ArcGIS Online to store all spatial data securely in the cloud and potentially make GIS services and analysis capabilities accessible to all of the company’s 240 employees
- ArcGIS Pro to provide advanced GIS functionality, when required for specialist tasks
- Collector for ArcGIS to allow the company’s mobile teams to collect data in the field
- Survey123 for ArcGIS to conduct surveys with tenants and then subsequently analyse their feedback
- ArcGIS Story Maps to present information clearly to business teams in an interactive format.
We have at least doubled the number of tree inspections that surveyors can perform in a day and given managers faster access to better information about where surveys have been undertaken
Andrew Keljarrett – Business Improvement Manager, Silva Homes
The Benefits
Tangible cost savings from reduced administration
The creation of mobile GIS solutions has enabled Silva Homes to make significant, sustained cost savings. For instance, the Tree Team uses Collector for ArcGIS to carry out surveys on trees the association is responsible for. The surveyors are able to check locations of trees, carry out surveys, deal with customer queries and provide information to contractors on tree maintenance work needed – all while in the field. “The mobile GIS solution for our Tree Team allows us to manage our portfolio of 10,000 trees with just two full time members of staff,” says Andrew Keljarrett, Business Improvement Manager at Silva Homes. “We estimate that without this solution, costs would increase by at least £50,000 a year, and we would be unable to carry out necessary tasks in a proactive, cost effective manner.”
Greater financial returns on estate assets
Increasingly, Silva Homes is using ArcGIS to help it make strategic decisions that will impact the future profitability of the business. It is, as an illustration, currently collecting data in the field about the condition of garage blocks and then analysing possible development opportunities for these sites with ArcGIS Online. By replacing under-used, old and deteriorating garages with brightly lit parking spaces, amenity areas or new properties, the organisation can simultaneously reduce its maintenance costs, improve facilities for tenants and create new revenue opportunities.
A sensitive and professional approach to under-occupancy
Silva Homes is currently using the ArcGIS to help it minimise under-occupancy in its properties and incentivise tenants to downsize. It uses Survey123 to assess the needs of householders at properties that may be under-occupied, alongside ArcGIS Online to quickly ascertain if there are other properties available within its housing portfolio that may be more suitable, such as bungalows already fitted with showers or wet-rooms for elderly people. The organisation can, therefore, reduce under occupancy rates and make its larger properties available to families on council waiting lists, while delivering a professional and understanding service for its existing tenants.
Improved employee productivity throughout the business
The use of ArcGIS has had a significant impact on productivity, across a wide range of business departments. In Finance, for example, employees recently used ArcGIS Pro to reduce the time needed to define title extents for a refinancing initiative from over a month to less than one week. Equally, employees in the Estates Team have reduced their need to return to the office to collect or return information on jobs, while the Tree Team is able to carry out more surveys in less time. “We have at least doubled the number of tree inspections that surveyors can perform in a day and given managers faster access to better information about where surveys have been undertaken,” Keljarrett says.
Reduced exposure to the risk of litigation
Using ArcGIS Online and the tree data captured via mobile GIS, Silva Homes can now categorise each individual tree as either ‘low’, ‘medium’ or ‘high’ risk, based on a wide range of factors including tree health, adjacent services and public access. The clarity of the information presented by ArcGIS allows the Tree Team to provide assurances to the board and regulators that risks associated with damaged or falling trees are being managed and mitigated responsibly. Most significantly, this GIS-driven process reduces the risk of litigation for poor tree management. At its worst, mismanagement can lead to charges of corporate manslaughter, potentially resulting in unlimited fines for an organisation and prison sentences for involved parties.

Red Kite Community Housing
We have undertaken a wide range of in-depth analysis that has given us new insight into important issues and helped us to unlock new revenue opportunities
Red Kite Community Housing deployed Esri’s ArcGIS Platform to gain a deeper understanding of not only what assets it owned, but also how to best maintain and develop them. The company is now amassing rich business insight that will help it to put innovative business improvement strategies into action.
Easy access to boundary data allows employees to respond to customer queries in minutes
Improved understanding of land ownership and plot sizes reduces ongoing operational costs
GIS analysis reveals previously unknown development sites and pinpoints the most advantageous opportunities
The Challenge
In the housing sector, the importance of clear business insight cannot be understated. Whether organisations want to improve the cost efficiency of their property maintenance programmes, respond more effectively to customer needs or identify the development opportunities that are most likely to gain planning permission, they need a detailed understanding of their homes, land, customers and communities.
Red Kite Community Housing wanted a more efficient way to improve the accessibility of information about the 6,700 homes that it owns and maintains in the district of Wycombe. It was unable to easily determine the ownership of property boundaries, or even locate the nearest grit bins, without having to find and refer to often disparate records. This reduced the efficiency of day-to-day operations and the ability to easily and flexibly devise and implement business improvement schemes. It therefore decided to deploy a geographic information system (GIS) to give employees more information about land assets, as well as reveal business insight to inform new strategies.
Our continuing use of ArcGIS for analysis will give us added insight into important issues and help to inform new business strategies
Jessica Horwitz – Insight Team Leader, Red Kite Community Housing
The Solution
Red Kite Community Housing selected Esri’s ArcGIS Platform after visiting Esri UK’s annual conference. “We didn’t want a software solution that was bespoke to the housing industry, as we felt this might constrain our ability to innovate in the future,” says Jessica Horwitz, Insight Team Leader at Red Kite Community Housing. “We wanted a solution that would give us the flexibility and the advanced technology to drive improvements to our business for many years to come.”
After receiving training from Esri UK, Red Kite Community Housing began using Esri’s ArcGIS Desktop initially to digitise its paper records, add layers of business data and plot the locations of adjacent features such as lamp posts and telegraph poles. It then made interactive maps available, using ArcGIS Online, to at least one employee in every business department, including the call centre and the field-based neighbourhood team. These users can now see everything from property boundaries to the locations of play areas, at a glance, from their desktops or mobile devices.
Subsequently, employees within the insight and business teams began to use ArcGIS Desktop to interrogate and analyse the newly collated asset information, to gain a deeper insight into homes and land, as well as new business opportunities. While Red Kite Community Housing has only been performing GIS analysis for a few months, on specific projects, it is already evident that the new business insight will prove invaluable in helping the organisation to improve the efficiency and quality of its services for customers.
ArcGIS is revealing strips of land, previously not identified as having development potential, and unlocking new revenue opportunities for the business
Jessica Horwitz – Insight Team Leader, Red Kite Community Housing
The Benefits
Insight for improving business efficiency
ArcGIS Online has replaced cabinets of printed maps and ledgers, creating time savings in multiple business areas. In the ‘Relationship Stem’, the first point of contact for customers, it might previously have taken several hours for a member of staff to respond to a boundary issue, but queries can now be answered in as little as a few minutes by simply checking a web app. In the future, Red Kite Community Housing plans to analyse maintenance requests and the sequencing of repair jobs to reduce travel time, look at service demand and use this intelligence to shape the service it offers.
Insight for reducing operational costs
Through the use of ArcGIS, Red Kite Community Housing has found parcels of land that it was maintaining but didn’t own, which has opened up conversations with the local authority about maintenance costs. It can also now produce development site plans and documentation to support Access Permits in-house, rather than paying outside agencies to generate them, which contributes to further ongoing operational cost savings. Moving forwards, when new contracts like grounds maintenance come up for renewal in the months ahead, the organisation will be able to provide contractors with more accurate land measurements, leading to fewer assumptions and more competitive tenders.
Insight for informing development planning
In a key business initiative, Red Kite Community Housing is using ArcGIS Desktop to identify areas of land suitable for development and narrow down the search to plots of land of the right size, in the best locations, taking into account potential to work with other third party adjacent land owners. Red Kite Community Housing will also be able to consider the ongoing time that will be required to manage new development opportunities as part of the business case. “ArcGIS is revealing strips of land, previously not identified as having development potential, and unlocking new revenue opportunities for the business,” Horwitz says.
Looking ahead, Red Kite Community Housing plans to use ArcGIS to gain insight into other areas of its business by analysing customer satisfaction surveys, home turnover, geo-demographics and rental income and turning this data into actionable intelligence. Horwitz concludes, “Our continuing use of ArcGIS for analysis will give us added insight into important issues and help to inform new business strategies.”
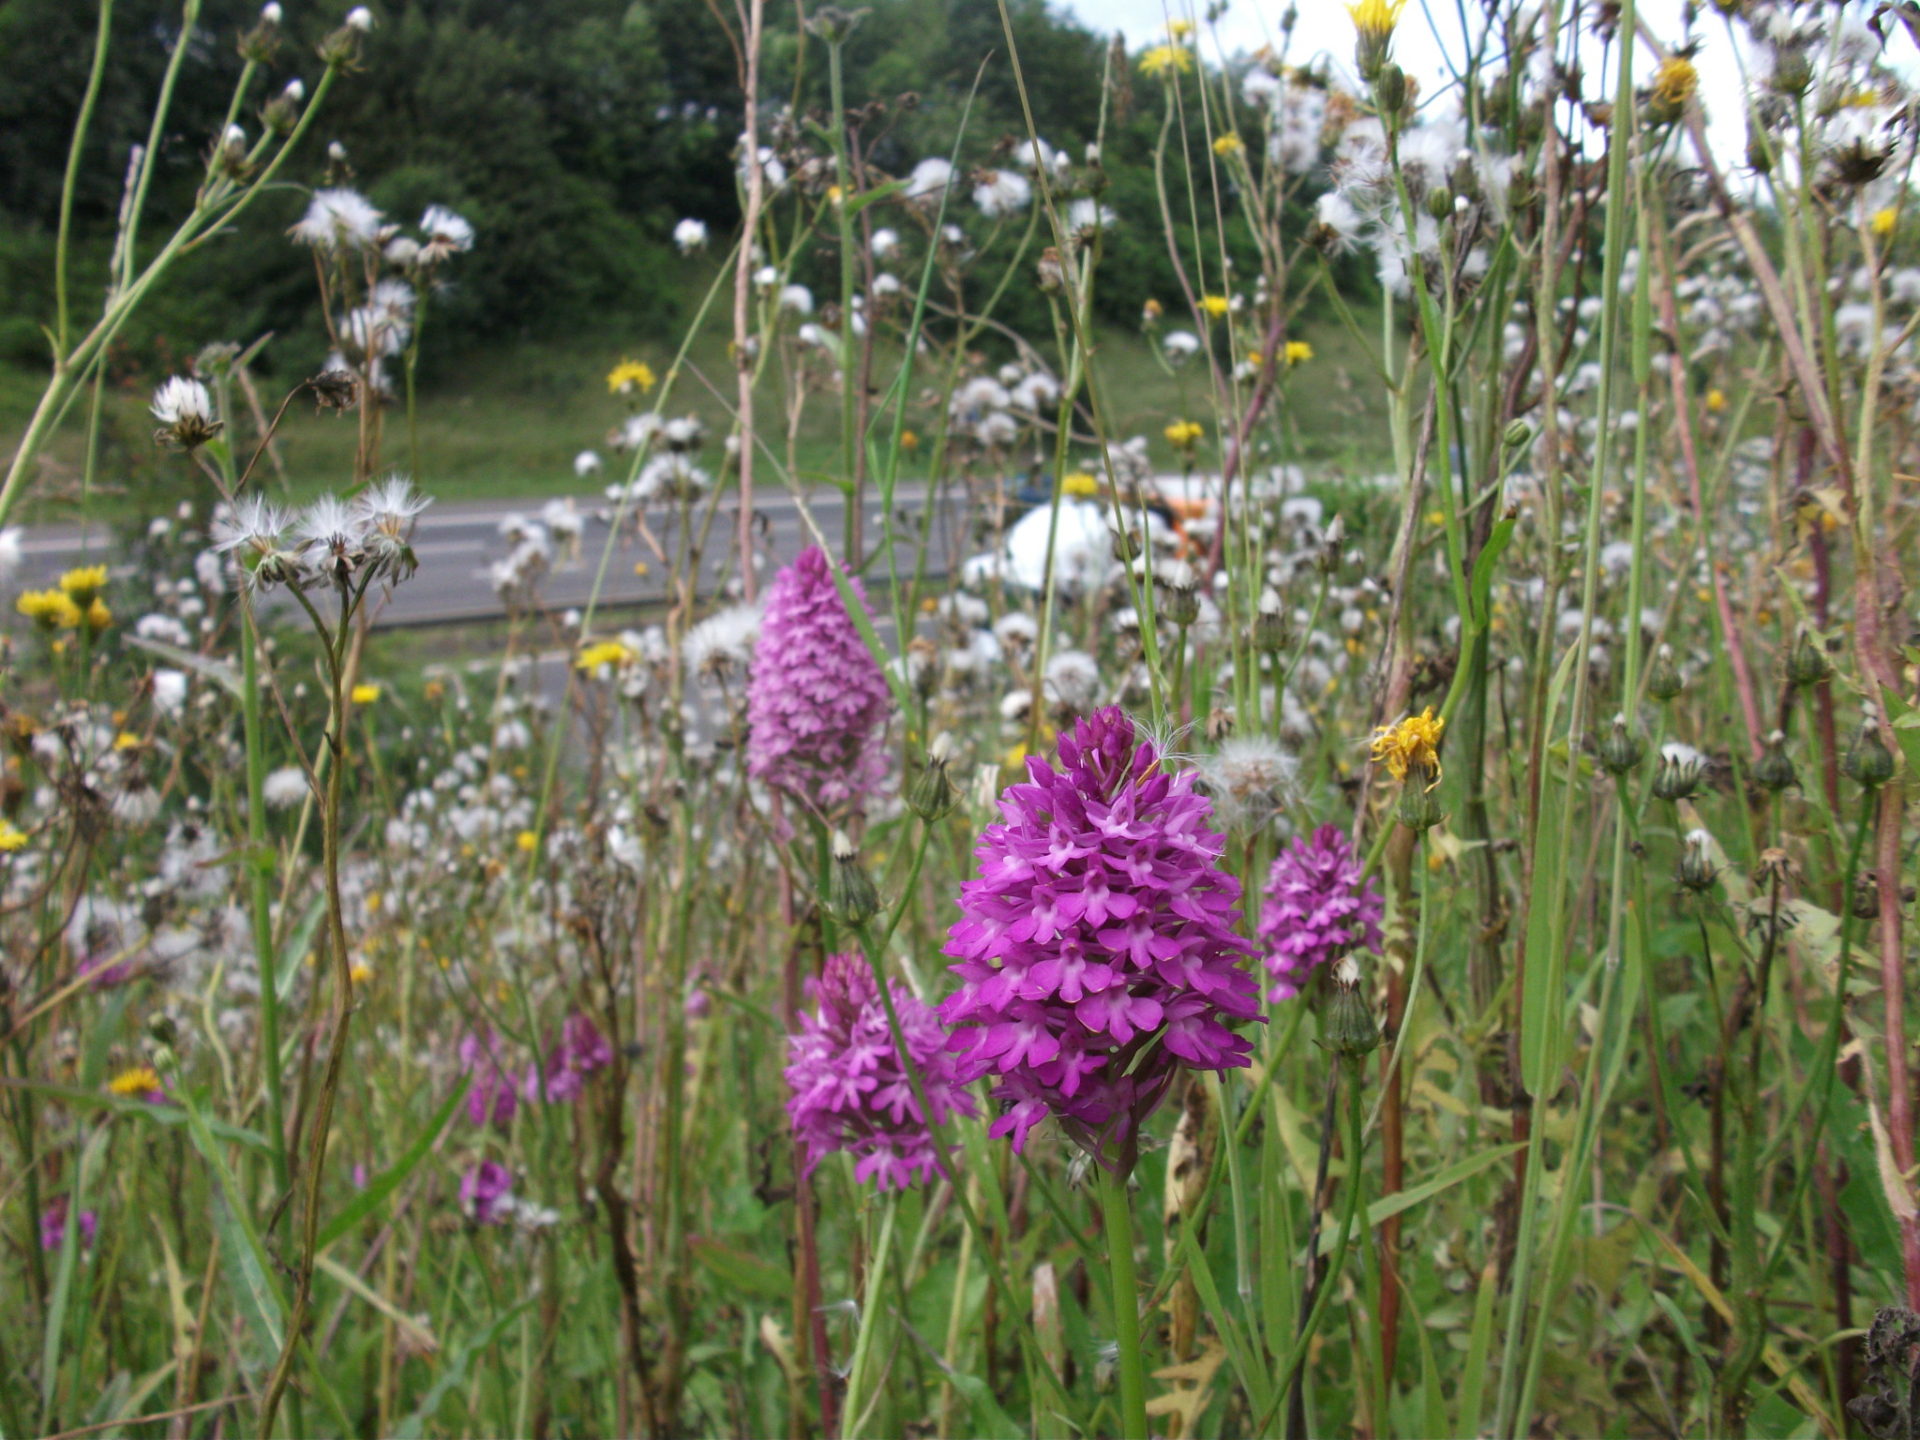
Connect Plus Services
We use ArcGIS to conserve some of Britain’s protected species within the grass verges of the M25 and by using collector app we now operate more cost effectively.
Within the grass verges of the M25, one of Europe’s busiest motorways, Connect Plus Services is taking innovative steps to conserve some of Britain’s protected species and to promote pollinator species. Using Esri’s ArcGIS, the company is able to better understand the environmental impacts of its business, implement schemes to enhance the natural environment and, at the same time, operate more cost efficiently.
Improved schemes to conserve habitats and species
25% more productivity in field workers
The ability to share enhanced quality data
The Challenge
The joint venture company Connect Plus Services works on behalf of Highways England, as part of a DBFO (Design, Build, Finance and Operate) contract comprising all motorways and A roads within Highways England’s Area 5 network around Greater London. As well as maintaining this 228-mile road network, the company has a legal obligation to protect the natural environment, a challenging requirement that also involves monitoring and improving approximately 15 km2 of soft estate on roadside verges.
ArcGIS has become a critical tool in helping us ensure that the ongoing maintenance of the M25 has minimal adverse impacts on the environment
Jennifer Banks – GIS Specialist and Environmental Assistant, Connect Plus Services
The Solution
Connect Plus Services has been using geographic information system (GIS) technology ever since its foundation in 2009, when it was awarded the 30-year M25 contract by Highways England. The company’s Environment Department selected Esri’s ArcGIS to meet Highways England’s EnvIS (Environmental Information System) data requirements and improve the quality and quantity of environmental asset data available for the M25 network. It drew together a diverse range of data sets, from on-site surveys and street-view video to water drainage reports and public rights of way data, to build up a valuable and informative picture of the natural environment under its stewardship.
In addition, Connect Plus Services took advantage of ArcGIS Online & ArcGIS Server to create a Corporate GIS for the visualisation of operational data. Using this platform, the company can make its rich environmental data accessible to all employees, across all departments, via a secure, intranet-based map viewer. This solution not only displays environmental and asset-related information on an intuitive mapping interface; it also puts basic GIS capabilities in the hands of all employees, enabling them to conduct analysis on demand, to help them make better decisions.
More recently, the Environment Department has used the ArcGIS Collector App to create a versatile mobile GIS solution, integrated with internal systems, that removes the need for surveyors to rely on paper maps and survey forms. Field-based employees enter their survey findings into mobile devices, from the roadside, and the data is automatically and securely transferred directly into Connect Plus Services’ central systems, without any need for further manual data handling.
Working with GIS data in apps such as Collector streamlines the digital data hand-over process because our client, Highways England, also use an Esri GIS system to store, view and analyse information
Jennifer Banks – GIS Specialist and Environmental Assistant, Connect Plus Services
The Benefits
ArcGIS now plays a key role in helping Connect Plus Services to meet its environmental obligations more efficiently. The advantages include:
Reduced adverse environmental impacts
Employees use ArcGIS to make more informed decisions about how to mitigate any potentially damaging environmental consequences during and following activities such as essential road maintenance. “It is vitally important for us to ensure that due consideration is given to the environment in everything we do,” says Jennifer Banks, GIS Specialist and Environmental Assistant at Connect Plus Services. “ArcGIS has become a critical tool in helping us ensure that the ongoing maintenance of the M25 has minimal adverse impacts on the environment.”
Improved schemes to protect native species
In a range of environmental improvement projects, Connect Plus Services is using ArcGIS to help it proactively conserve protected species and enhance environmental assets. For instance, the company uses ArcGIS to analyse third-party land that lies adjacent to the soft estate it manages, to determine whether it is feasible to use the roadside verge to create ecological corridors. As Graham Lee, Environmental Manager at Connect Plus Services, explains, “It is possible to use the motorway verge to enhance ecological connectivity, by joining areas of species-rich grassland so that pollinator species can move more freely within the landscape.”
25% more productivity in the field
Using the mobile GIS solution, the organisation’s environmental inspectors can complete surveys in the field in significantly less time, as they no longer have to record their environmental information on paper, then re-enter it when they get back to the office. “We have cut the amount of time we spend on surveys and post-survey data entry by up to a quarter,” says Lee. “As a result, we can perform more inspections of the soft estate, more quickly and in greater detail, to meet the growing needs of the business.”
More cost-effective tenders
Connect Plus Services is making ongoing cost efficiencies by giving sub-contractors more accurate plot information relating to grass cutting, weed control and vegetation removal activities. “When we go out to tender, we receive more competitive prices from contractors, as they have more accurate information about the areas of land we expect them to work on,” Lee says.
Better data, shared more easily with partners
Finally, Connect Plus Services can now continually enhance and more easily share its data. For instance, new data on environmental assets, collected by mobile surveyors in the field, can be easily submitted quarterly to Highways England, for inclusion in its Environmental Information System (EnvIS). As Banks observes, “Working with GIS data in apps such as Collector streamlines the digital data hand-over process because our client, Highways England, also use an Esri GIS system to store, view and analyse information.”