Blog Archives

The Cabinet Office
Our new GIS application supports our transparency policy by making it far easier for people to find out about available property assets for sale or for rent
Firmly committed to improving transparency in Central Government, the Cabinet Office has developed a GIS-based web app that makes vacant property and land information more accessible to the public. Over time, it hopes that this online solution will lead to a decrease in under-utilised government-owned assets and increase revenue for government departments.
The Customer
The Cabinet Office supports the Prime Minister and Deputy Prime Minister and ensures the effective running of government. It is also the corporate headquarters for government, in partnership with HM Treasury, and takes the lead in certain critical policy areas.
This GIS app supports the government’s transparency agenda, making information far more accessible to citizens
The use of Esri’s ArcGIS platform ensures that the web app is easy to use, allowing people to quickly find vacant properties and land in their chosen locations
The Cabinet Office streams background mapping data direct into its web solution, saving time on data preparation and management
The Challenge
One of the defining policies of the current Coalition Government is to make data about its operations, services and assets more accessible. To support this agenda, the Cabinet Office has developed a web based geographic information system (GIS) to improve transparency specifically in the area of property management.
Across the country, there are hundreds of vacant buildings or offices and disused parcels of land owned by Central Government which are available for sale or rent. The Cabinet Office used to publish details about this available property on the website data.gov.uk in a series of data tables. However, it recognised that the information wasn’t easy for members of the public to access.
Chris Statham, Head of data services at the Cabinet Office, explains: “It was extremely tricky for people to find information about property in their area. They had to download a large file, convert it to Microsoft Excel and then trawl through extensive data tables to try to identify buildings and areas of land to suit their needs. Rather than just providing this raw data, we decided to provide an online application that would be quick and easy to use.”
It was extremely tricky for people to find information about property in their area […] Rather than just providing this raw data, we decided to provide an online application that would be quick and easy to use
Chris Statham – Head of Data Services at the Cabinet Office
The Solution
The Cabinet Office already relied on Esri’s ArcGIS Server platform to manage its property data and was able to use the integral services and capabilities of this powerful GIS solution to build the new application, which it calls ‘Find Me Some Government Space’. The organisation has an Enterprise License Agreement (ELA) with Esri UK, so it was able to develop its new web-based GIS very economically, with no additional software costs.
Like well-known commercial property search websites, the ‘Find Me Some Government Space’ application allows members of the public, businesses and developers to enter a town name or postcode and then search for property within a specified radius. Users can select to view only property for sale or for rent, or both together, and view the results on interactive maps at a variety of scales. If, for example, a group wants to establish a new free school in a city, it can now easily enter the city name and see all available development land and vacant buildings that might provide suitable sites for the new school.
For this new GIS application, the Cabinet Office decided to take advantage of Esri UK’s Data Services for the first time. Esri UK therefore streams up-to-date background mapping from Ordnance Survey direct into the online application. The use of these data services saves the organisation a great deal of time, as its employees and contractors no longer have to manage and load data updates.
Such has been the success of Esri UK’s Data Services that the Cabinet Office now plans to gradually migrate current and future GIS applications to this service. Eventually, it will no longer have to store large mapping data sets onsite, so will be able to reduce its Storage Area Networks and associated software, hardware and rack space. “We haven’t done any specific calculations, but recognise that there will be a cost saving from the expanded use of Esri UK’s Data Services in the future,” Statham says.
The Cabinet Office has a very strong transparency policy and is committed to making data more accessible to the public. Our new GIS application supports that policy by making it far easier for people to find out about available property assets for sale or for rent
Chris Statham – Head of Data Services at the Cabinet Office
The Benefits
‘Find Me Some Government Space’ is the first public-facing GIS ever developed by the Cabinet Office and, as such, it showcases a new way to improve transparency in the public sector. The online app makes data about over 600 Government-owned properties and land parcels far easier to find and thereby delivers a better quality of service for citizens. Every week, the application receives over 4,000 hits, which is a strong testimony to its success.
The Cabinet Office anticipates that the new online GIS could generate more requests to rent or buy unused property owned by Central Government. Indeed, in the long run, it believes that the solution could decrease the amount of under-utilised space in Central Government, creating added revenue for government departments and delivering a better ‘return’ on assets for the tax payer.


English Heritage
ArcGIS is a vital tool, helping to gain a deeper understanding of the properties within our care so we can preserve them for future generations
Charged with the huge responsibility of preserving England’s historic buildings and landscapes, English Heritage uses Esri’s ArcGIS Desktop solutions to enhance significant research projects. ArcGIS is a vital tool to gain a deeper understanding of the properties and sites within its care, to help preserve them for future generations.
The Customer
English Heritage exists to protect and promote England’s historic environment and ensure that its past is researched and understood. Officially known as the Historic Buildings and Monuments Commission for England, the organisation is the Government’s statutory adviser on the historic environment and an executive non-departmental public body sponsored by the Department for Culture, Media and Sport (DCMS).
English Heritage used ArcGIS to create ground models to analyse the locations of castles and lighthouses around the country
The organisation scanned and validated ancient paper maps, going back to the 16th century, to gain new insight into the development of an Essex estate
ArcGIS provides a ‘one-stop shop’ enabling the organisation to manage all data in research projects, from the field work right to the end archive
The Challenge
In order to protect and preserve England’s diverse historic buildings and landscapes, English Heritage conducts regular surveys, landscape investigations and research projects. The information that it gathers is used to create conservation and management plans.
English Heritage’s research department was starting to handle many more disparate datasets. Its existing IT systems were struggling to cope with diversity, and data often had to pass through several complex steps between collection and use. “We wanted to become more sophisticated in the way that we handled data and have a one-stop solution,” explains Trevor Pearson, Head of Technical Survey (Archaeology). “We needed a solution that could handle all the different types of data that we were being confronted with and simplify our processes.”
English Heritage was using Geographical Information Systems (GIS) elsewhere in its organisation, and some teams had been using Esri GIS software since the mid-1990s. “ArcGIS was being widely used corporately and was known for being straightforward to use,” recalls Pearson. In addition, many of English Heritage’s partner organisations – such as the National Parks Authorities and local authorities – had already deployed GIS and wanted to receive data in compatible formats.
ArcGIS is enabling us to set new standards for historic landscape analysis
Trevor Pearson – Head of Technical Survey (Archaeology)
The Solution
Over a period of time, time twenty nine research department staff started to use ArcGIS for Desktop with the Spatial Analyst and 3D Analyst extensions.
Spatial Analyst is used to investigate viewsheds of castles and lighthouses to understand how these sites were positioned in the surrounding countryside. Perspective views of sites and entire historic landscapes have been created using 3D Analyst, aiding interpretation and allowing sites to be seen from otherwise unobtainable points of view. The ground models used to create the perspective views are interpolated in 3D Analyst from spot height data; and are also used to analyse the gradient and aspect of hill slopes to explore how ancient settlements and field systems were distributed.
ArcGIS has also been used in a research project at Audley End in Essex, helping to validate the accuracy of old maps. A large number of fragile paper maps depicting the house and its estate from as far back as the sixteenth century have been scanned, geo-referenced and compared with modern data from recent geophysical and earthwork surveys, as well as archaeological features seen on aerial photographs.
This exercise highlighted a number of very significant changes that had occurred. For example, the maps geo-referenced in ArcGIS clearly illustrated how the natural course of the River Cam had been re-routed more than once. The information collected on the precise location of the river at different points in time is helping to ensure that future conservation work is historically accurate.
ArcGIS allows everyone to see the different stages in the history of a property and its surrounding landscape. It shows very clearly how complex landscapes have changed over time and gives us a better understanding of important historical sites
Andrew Lowerre – Archaeologist specialising in spatial analysis
The Benefits
ArcGIS adds great value to the work carried out by English Heritage’s research department. “ArcGIS has a positive impact on every stage of a research project,” says Pearson. “It influences the way that we think about data collection; it makes data management more straight forward and comprehensive; it gives us new analytical capabilities; and it improves the way that we present, use and store our findings.”
ArcGIS delivers the ‘one-stop solution’ that English Heritage sought for managing its research projects from beginning to end. “At no point do we have to take the data out of the GIS for manipulation in CAD (computer aided design) packages or for analysis,” Pearson explains. “We can use ArcGIS to manage projects right from the field work to the end archive.”
Andrew Lowerre, an archaeologist specialising in spatial analysis, believes that the Audley End project would have been virtually impossible without the use of GIS. “It would have been very difficult to compare maps and match features using just digital images and the eye,” he says. “The result would have been far less satisfactory and difficult to share or use in the future.”
English Heritage is using ArcGIS to gain a deeper understanding of the properties and sites within its care and to help preserve them for future generations. Lowerre says: “ArcGIS allows everyone to see the different stages in the history of a property and its surrounding landscape. It shows very clearly how complex landscapes have changed over time and gives us a better understanding of important historical sites.”

City of York Council
Interactive maps can be embedded into any page of our website, providing a cost effective way to inform citizens about our value add services.
This unitary authority completely revamped its online mapping capabilities by deploying Esri UK’s LocalView Fusion platform. It now has a single, cost effective solution that enables it to make relevant and meaningful information more accessible to the general public and deliver advanced GIS capabilities to more council employees.
The Customer
Founded by the Romans, York is a vibrant city with a rich cultural heritage. The City of York Council is a unitary authority caring for a population of around 195,000, within the city’s ancient walls, and in the suburbs and rural areas beyond: an area of over 271 km2.
The council can now embed interactive maps into any page of its website, providing citizens with value-add information about the services they are interested in.
Over one hundred days the council’s online maps received 115,000 hits, a highly cost-efficient way of providing improved customer service
LocalView Fusion now delivers sophisticated GIS capabilities for employees via the council intranet
The Challenge
Like most UK local authorities, the City of York Council developed online mapping capabilities in 2005, in response to government directives and guidelines. Esri UK’s LocalView was still meeting these needs, but the geographic information system (GIS) team wanted to develop its publicly accessible GIS capabilities to deliver enhanced services for citizens. Simon Lutman, GIS project officer at City of York Council, says: “Our aim wasn’t necessarily to produce fancier maps, but rather to make it even easier for people to use the online GIS service to find precisely the information that they needed.” The other challenge was to develop a new geospatial intranet application that was compatible with Internet Explorer 8.
We don’t have the resources in-house to develop complex applications […] It worked out much less expensive to use LocalView Fusion than upgrade our existing system
Simon Lutman – GIS Project Officer at City of York Council
The Solution
Designed specifically for local authorities, LocalView Fusion is based on ArcGIS technology. It provides a straightforward way to publish geographic information as digital maps, using a single technology platform for both Internet and intranet. More than just a simple enhancement of LocalView, it is an entirely new platform, with a range of new capabilities and a contemporary look and feel. “I don’t think I realised quite how different it was until it was installed and up and running”, says Lutman.
For citizens, the council created separate, highly focused GeoWindows that display information relating to specific council services, including transport, business and economy, education and learning, environment and planning. For example, an interactive map within the transport section of the website just displays information pertinent to transport, such as bus stops and car parks. The council also retained their single, all-services, map with over 50 data layers; this is used for ‘where’s my nearest’ queries across the full range of council services.
For staff, a GeoTemplate was used to deliver display and analytical capabilities. “Everyone now has GIS on their desktop”, says Lutman. “LocalView Fusion provides customisable maps for everybody.”
LocalView Fusion is a total solution. It covers everything that councils need, in a single solution that is supported and will be upgraded as new technology emerges
Simon Lutman – GIS Project Officer at City of York Council
The Benefits
Clearer, more accessible information
Interactive maps are embedded directly into the relevant web pages. Lutman explains: “In the future, if citizens are looking at a specific transport page on our website, they will see a map that shows bus stops, car parks and other relevant information. They won’t have the complexity of having to navigate away from the web page and activate specific map layers.”
Added value for citizens
Council data has been combined with relevant data from external sources. For example, citizens can click on a bus stop and see the routes and times of buses that stop there. “It’s about adding value for citizens, by providing links to information that people might not otherwise be able to find”, says Lutman.
Cost efficient customer service
It costs around £0.32 to service an enquiry via the web, as opposed to £2.90 via telephone. Since installing LocalView Fusion, the council has recorded around 700 daily hits for its online maps, and in 100 days between January and April 2011, it received over 115,000 hits, 45% of which were for the new transport GeoWindow. “LocalView Fusion tells me in black and white how many people are using the service, which is great”, Lutman enthuses.
Reduced development costs
The City of York Council now has the benefits of an in-house solution, without the time and expense of commissioning external development. “We don’t have the resources in-house to develop complex applications”, Lutman explains, adding “It worked out much less expensive to use LocalView Fusion than upgrade our existing system.”
Advanced GIS for staff
The council’s employees now have more advanced GIS capabilities than the previous intranet-based solution provided. They are equipped to answer complex business queries, such as “Which properties will we need to evacuate if we have to set up a cordon or buffer zone around a particular site?” As Lutman says, “In the past you would have needed a full-functioned GIS to do this kind of query. A lot of staff who would have previously needed access to an ArcGIS Desktop licence, now no longer require it. LocalView provides access to all the data and functionality users need. I believe it will prove useful in a range of ways.”
In the future, if citizens are looking at a specific transport page on our website, they will see a map that shows bus stops, car parks and other relevant information. They won’t have the complexity of having to navigate away from the web page and activate specific map layers
Simon Lutman – GIS Project Officer at City of York Council
The Future
The GIS team plans to develop even more customised GIS applications to embed into specific pages of the council website and to introduce Ordnance Survey’s VectorMap Local as a dynamic and visual base mapping layer. This will make its GIS services even more user-friendly and accessible.

Cornwall Council
Our strategic use of ArcGIS has enabled us to implement a wide range of cost reduction initiatives whilst delivering new programmes for families in need.
Confronted with the need to make multi-million pound savings, Cornwall Council is making strategic use of Esri’s ArcGIS platform to help identify and implement a wide range of cost reduction initiatives. At the same time, its use of GIS helps it to protect vital public services and deliver new programmes for families in need.
ArcGIS provides evidence to support decisions about where to make economies in public services
The council has a greater understanding of how assets can be shared and optimised between partners
Better quality data helps the council to participate in government schemes and deliver multi-agency support for local people
The Challenge
Councils across the UK have been severely affected by successive years of austerity and aggressive cuts in funding by Central Government. Local authorities are having to make tough decisions about reducing public services while finding new, more economical ways to meet the needs of citizens. The challenge is felt acutely in Cornwall where, over the four-year period 2015-2019, the unitary authority has to reduce its annual revenue operating budget in real terms by 25%.
Finding ways to save money on this vast scale is always going to be tough, but the target is particularly challenging for Cornwall Council due to its recent history. Six years ago, the former county council merged with five district and one borough council to form the new unitary authority and obvious opportunities to streamline and optimise services were capitalised on at that time. Consequently, Cornwall Council now needs to re-examine its services in almost forensic detail and be creative to uncover additional, less evident economies. At the same time, it has to maintain a high standard of service for its citizens, many of whom live in remote, rural locations.
ArcGIS is playing an active role in helping Cornwall Council to achieve its cost reduction target
Elaine Bennett – GIS Team Leader at Cornwall Council
The Solution
The Geographic Information Systems (GIS) team at Cornwall Council rose to this challenge. Working with multiple services, the team began to use its GIS technology and skills to analyse and investigate a range of service areas where potential cost savings might be made.
Cornwall Council has standardised on Esri GIS technology and has an ongoing Enterprise Licence Agreement with Esri UK. It is currently in the process of upgrading its older Esri GIS solutions and migrating them to Esri’s latest ArcGIS platform. At the heart of the Council’s GIS environment is a central ‘Geostore’, which consolidates 300 spatial data sets and makes them accessible to all employees via a suite of desktop, server, intranet and recently mobile GIS solutions. The Council also makes extensive use of ArcGIS to deliver local information to the general public via web mapping applications.
In the first six months of 2015 alone, ArcGIS has been used to support the implementation or investigation of many different cost reduction schemes
Elaine Bennett – GIS Team Leader at Cornwall Council
The Benefits
“ArcGIS is playing an active role in helping Cornwall Council to achieve its cost reduction target,” said Elaine Bennett, the Council’s GIS Team Leader. “In the first six months of 2015 alone, ArcGIS has been used to support the implementation or investigation of many different cost reduction schemes.”
Reshaping the mobile library provision
The GIS team used ArcGIS desktop to analyse the sites of static libraries, routes of mobile libraries, typical travel distances and the locations of library users including, in particular, house-bound borrowers. The intelligence that it gathered from ArcGIS was then submitted to Cornwall Council’s Cabinet and used as evidence to help inform decision making. The Council has since implemented plans to reshape library provision in the county, in an initiative which will cut mobile library costs by 50%, while retaining the service and supporting micro libraries in rural communities.
Optimising the government estate
In line with the Government’s Estate Strategy (2013), published by the Cabinet Office, Cornwall Council has used ArcGIS to map the locations and key attributes of its property assets and those of its public sector partners. It is now using this insight to collaborate on strategic estate management. This shared approach provides a platform for co-location and integrated service provision; reducing costs as well as freeing surplus land and property for disposal and regeneration.
Delivering proactive family support
In another high profile initiative, Cornwall Council used ArcGIS to assign unique property reference numbers (UPRNs), which are a prerequisite for participation in the Government’s ‘Troubled Families’ programme, an initiative launched by the Prime Minister to improve support for families with multiple and complex challenges. Under phase 1 of the programme, Government figures put the number of ‘Troubled Families’ in Cornwall at 1,270, but using data gained from ArcGIS , Cornwall Council identified a larger number. The program is now moving into phase 2, and the UPRNs will now help to identify a further 4,000+ families who are eligible for additional support. By intervening to give these families better and faster multi-agency support, the Council expects to make significant savings.
Reducing the cost of citizen contact
Recently, Cornwall Council has used ArcGIS and Ordnance Survey data to upgrade its web-based ‘My Area’ service, an online service that helps encourage citizens to self-serve information, rather than phone the call centre. The Council estimates that if it can convert 15% of its annual telephone enquiries to web enquiries using My Area, it will reduce calls by over 125,000 per annum.

Durham County Council
Integrating GIS technology into our CRMS System has improved both internal corporate services and online information services for citizens.
When it merged with seven district councils to become a unitary authority, Durham County Council deployed Esri’s ArcGIS Server solution to help integrate dispersed data. Using GIS technology has improved both internal corporate services and online information services for citizens.
The Customer
Durham County Council is a unitary authority in North East England. With around 22,000 employees and 126 elected councillors, it delivers services to over 219,000 households across an area of 223,260 hectares.
Durham County Council has integrated GIS with its customer relationship management (CRM) system, creating more efficient processes for responding to issues such as faulty street lighting
A new online GIS service called ‘My Durham’ makes it easy for members of the public to find service details and general information pertaining to their own addresses
ArcGIS Server gives the council the tools to quickly build and deploy new web apps, further enhancing the range of services available for citizens
The Challenge
When Durham merged with seven district councils to form a unitary authority, an enterprise Geographic Information System (GIS) was seen as a key enabler for its Corporate and Service Improvement Programmes.
Durham had used corporate Esri GIS for over 15 years: ArcGIS solutions for desktop, mobile and intranet, with GIS embedded in core applications, including traffic accident monitoring and property management. However, the former district councils used a range of GIS applications. “Our first challenge was to find a way to pull all of this data together and then serve it out in a way that would support the new council”, says Trevor Kirkup, senior ICT project leader. “Senior managers wanted to make an immediate, positive impression on citizens”, explains Kirkup. “Our challenge, therefore, is to use GIS to build innovative new services – and deliver them quickly.”
GIS is a key enabler in helping us to make efficiency improvements, and we plan to integrate it into many more business processes
Trevor Kirkup – Senior ICT Project Leader
The Solution
While reorganising as a unitary authority, Durham migrated to ArcGIS Server. Secure and robust, it supported transitional work and service design, and enabled rapid delivery of new services and extending access to employees, partners and the public via the Internet, intranet and mobile solutions.
The Web Development and GIS teams used ArcGIS Application Programming Interfaces (APIs) to quickly integrate GIS into applications, notably, ‘My Durham’. This is an online service where citizens enter their address (verified against a local gazetteer) and then see a map and property-related service information, such as the local MP, bin collection days, nearest schools and library opening hours. “ArcGIS Server gave us the opportunity to fully embed GIS functionality within the web pages themselves to give users a better online experience”, explains Kirkup. The excellent map caching capabilities of ArcGIS Server were further exploited to develop an interactive Rights of Way map.
Delivering top quality customer services was at the heart of the reorganisation. For example, when a citizen phones to report a broken street light, the service agent enters the caller’s address and sees a web map of the property with street light locations overlaid. They click to identify the broken light, and the precise location and unique reference are automatically passed to back office systems via a customer relationship management (CRM) solution. This replaces manually processing textual descriptions.
ArcGIS Server has been further utilised to provide a “tactical” Web Portal for CRM requests: operational managers view CRM service requests in real time on a map. This type of mashup is a vital decision-making tool when demand is high.
“It is a powerful technology, and we are still only scratching the surface of its capabilities”, declares Kirkup.
ArcGIS Server gives us the ability to take data from a definitive source and publish through a wide range of services
Trevor Kirkup – Senior ICT Project Leader
The Benefits
- A single repository for spatial information
“ArcGIS Server gives us the ability to take data from a definitive source and publish through a wide range of services”, says Kirkup. “We only have to capture, store and manage once, but have the flexibility to use that data in many ways.” - Easier access to information for citizens
‘My Durham’ is an innovative single point of access to service-related information, available any time. “This initiative reduces the impact on our Contact Centre and helps us meet our targets as outlined in National Indicator NI14”, says Kirkup. - More efficient customer service
By integrating GIS and CRM, citizen reports are handled more quickly and the information passed on is more detailed and accurate, and mobile GIS has reduced response times of field engineers. - Rapid delivery of new services
Following the success of ‘My Durham’ and the CRM project, further GIS-led enhancements are planned. These will harness APIs and other developer tools to design, build and deploy web services and embed GIS into applications. Kirkup says: “It is early days, but we envisage realising some huge time savings and efficiencies.” Rapid development also makes short-term applications viable, e.g. for consultations on development initiatives. “In the past, it would have taken too long and cost too much to make it worthwhile”, observes Kirkup. “Now we can use ArcGIS Server to quickly turn around information and publish it out.” - Future potential
“In general, there is now an increasing recognition across the organisation of the power and role of GIS as an enterprise technology supporting the ongoing delivery of public services”, concludes Kirkup. “GIS continues to be a key corporate technology.”
East Northants and Wellingborough
We make information accessible to citizens online in a ‘self-service’ approach that is less costly than handling phone calls and face-to-face enquiries.
When East Northamptonshire Council and the Borough Council of Wellingborough decided to set up a joint ICT service to share resources and best practice, both organisations recognised the importance of GIS. They now make joint use of Esri’s ArcGIS platform and LocalView Fusion to deliver beneficial online services for customers, reduce costs and share data more effectively.
The Customer
East Northamptonshire Council (ENC) and the Borough Council of Wellingborough (BCW) are neighbouring local authorities. In 2008, they agreed to combine their ICT services, to share and adopt best practices across both councils and provide the critical mass to deliver a viable solution for both organisations.
Citizens can use web maps to report faults (such as potholes) online and upload photographs, which helps the councils to respond promptly and effectively
The councils make local information easily accessible to citizens online in a ‘self-service’ approach that is less costly than handling phone calls and face-to-face enquiries
ArcGIS offers a number of capabilities that make it easier for council employees to find information, share data and collaborate internally and externally
The Challenge
The first stage was to build on the success of ENC’s GIS (Geographic Information System) with a joint GIS that would replace BCW’s outdated one, which suffered from poor system controls and protocols. The objectives were to provide a robust foundation to improve customer service, deliver internal efficiencies and build a platform for future investment.
LocalView Fusion makes life easier for the public and saves us a significant amount of time in providing advanced mapping for our websites
Mark Young – GIS Officer at East Northamptonshire Council
The Solution
The two authorities selected, installed and integrated Esri UK’s LocalView 2 to successfully deliver online services, so that by 2010, they were using the same GIS system. Soon, the GIS team wanted to take advantage of new data sharing initiatives with neighbouring councils and third parties, so they upgraded to ArcGIS 10 and LocalView Fusion. This can further improve the availability of information and online services, improving the overall customer experience by delivering complex GIS information via a simple user interface. By increasing citizen self-service, streamlining internal processes and aligning service delivery with demand, it reduces costs too.
Upgrading to ArcGIS Server 10 and LocalView Fusion places us in a future-proof position
Mark Young – GIS Officer at East Northamptonshire Council
The Benefits
Easily embedded maps
The GIS team was impressed at how easy Fusion made it to embed maps into any web page. Templates are used to create and publish maps, removing nearly all the manual coding and configuration previously required, saving a significant amount of time. The resulting maps are easier to use, too: e.g. citizens can find locations of doctors using A-Z listings, rather than going to a separate application. “LocalView Fusion’s new templates are a straightforward way for even non-expert users to create an interactive map for a website”, commented Mark Young, GIS Officer at ENC. “Geographical functionality can also be quickly distributed to multiple areas of our sites by using a simple cut and paste process.”
Self-service savings
Citizen self-service typically costs £0.32 per transaction, compared with face-to-face at £7.40 per transaction and telephone at £2.90, and it provides a better service too. Personalisation via postcode, RSS feeds and online surveys gives up-to-date, integrated information on property, council services and amenities, in an easily understood format. Mark Young adds, “When a customer uses a map, they’re now easier to navigate, more intuitive and are full screen. Fusion’s built-in cache also speeds up the drawing of base maps and loads them a lot quicker, with faster zooming between different scales – great for users who have slower broadband speeds.”
Usability enhancements
The ‘report a fault’ function can now be tailored to provide questions specific to the request. Customers can upload photos relating to complaints, e.g. of graffiti or potholes, to help staff locate and deal with incidents more effectively. Fusion’s ability to link directly from any page to the councils’ payment websites has eliminated the need for payment via telephone or separate payments page.
Customer insight
RSS feeds can be configured to alert staff to almost any type of event, such as new planning applications. They can also search across multiple types of data in one map – a big step forward from only having one layer of information displayed at a time.
Data sharing
“Upgrading to ArcGIS Server 10 and LocalView Fusion places us in a future-proof position”, commented Mark Young. “The added capability of WFS (Web Feature Service) will allow the sharing of live GI data with other strategic agencies and will allow for more strategic decision making, therefore providing a sound return on investment.”
Future developments
“The ability to have multiple map layers displayed at the same time will prove particularly useful when displaying our Local Development Framework”, said Daniel Ray, Planning Policy and Conservation Assistant. “Surveys can also be configured to record the public’s views on proposed policies within the LDF. Any areas which are of particular interest will be logged as points and we can see at a glance where these areas are.” There are also plans to integrate Fusion with the councils’ Customer Relationship Management systems to streamline the process of fault reporting, reducing manual input and its associated costs.
Mark Young concludes that LocalView Fusion “supports better use of geographic information in general, to increase self-service and lower our operating costs. We can also share data more freely within our organisation and with others in the future.”

The Canal & River Trust
The JumpStart programme was extremely helpful. After just two days, we had set up all our maps, loaded over 60 data sets and sent out invites to 96 users
Keen to develop an online GIS service for its third party contractors, the Canal & River Trust took advantage of Esri UK’s Jumpstart training programme. With only two days of professional support, the organisation was then ready to launch a new service that is already helping contractors to work more efficiently and safely.
The Customer
The Canal & River Trust is the charity responsible for conserving, restoring and enhancing 2,000 miles of canals and rivers in England and Wales.
Contractors can now quickly find the correct work sites on the canal and river network, minimising time wasted, enabling jobs to be completed more quickly
The ArcGIS Online app gives contractors instant access to up-to-date information on the condition of paths, helping to improve health and safety
The organisation’s GIS team gained valuable knowledge and time-saving tips from Esri UK throughout the Jumpstart programme
The Challenge
Through its work, the Trust wants to ensure that its waterways are a haven for both people and nature to enjoy. To help it achieve these aims, the Trust relies on a number of prime contractors, who are appointed to carry out civil and mechanical engineering, diving, dredging, property maintenance, vegetation management and other vital tasks.
Each of these contracts has different requirements. For one contractor, the Trust provides ‘works packs’, which include printed maps indicating the location of jobs. For another, the Trust provides digital data on a physical hard drive at the beginning of each year. The problem was that during the course of a year, or during the contract period, changes could occur that rendered the maps and data out-of-date.
Passing on updates to the contractors was incredibly time-consuming and complicated, as different partners needed different maps and data in different formats. The Trust used to send out data updates on an ad hoc basis, but it was impractical to alert contractors to every small change. Consequently, contractors could potentially be working from mapping data that was up to twelve months out-of-date. This was far from ideal, and there was a desire to provide access to real-time data.
ArcGIS Online will enable us to inform interested parties about our network and help them understand our work
Sarah Temple-Phillips – GIS specialist at Canal & River Trust
The Solution
The Canal & River Trust already relied on ArcGIS, a geographic information system (GIS) solution from Esri, to help it plan and implement its many programmes of maintenance, conservation and development. To meet the needs of its contractors as quickly and easily as possible, it decided to utilise Esri’s ArcGIS Online solution.
In order to expedite the process of setting up ArcGIS Online, the Trust took advantage of Esri UK’s JumpStart programme. A consultant from Esri UK worked on site at the Trust, helping it to get started. He showed the GIS team how to align background mapping and passed on time-saving tips, such as how to bulk upload user details. “The JumpStart programme was extremely helpful”, recalls Sarah Temple-Phillips, GIS specialist at the Trust. “After just two days, we had set up all our maps, loaded over 60 data sets and sent out invites to 96 potential users.”
The JumpStart programme was extremely helpful. After just two days, we had set up all our maps, loaded over 60 data sets and sent out invites to 96 potential users
Sarah Temple-Phillips – GIS specialist at Canal & River Trust
The Benefits
Following the launch of the ArcGIS Online solution, contractors gained 24/7 access to up-to-date data about the canals and rivers of England and Wales. They no longer have to rely on the printed maps supplied in their ‘works packs’, or data sets supplied many months ago, which might be out-of-date. Instead, they can plan jobs based on the latest information from the Trust.
This improvement in the availability of information could ultimately help to improve health and safety for contractors. For example, bad weather may cause a landslip, making a section of towpath impassable in a vehicle. Once this change in towpath condition is recorded on the Trust’s central GIS system, it is then visible to the contractor via ArcGIS Online. Contractors can therefore amend work plans accordingly to ensure the safety of maintenance teams working in the area.
The online application is expected to reduce the amount of time spent locating sites. In the past, if contractors couldn’t find remote footbridges or properties, it could take several phone calls to obtain precise directions. Now contractors can look at ArcGIS Online to help them locate sites, without having to bother the Trust and can therefore get started on works more quickly.
ArcGIS Online will also be highly valuable to the trust during the tender process for new contracts, such as vegetation management. Potential suppliers will be able to view maps and aerial photography via the online application to assess precisely how much work is involved. “Contractors will have a better understanding of jobs and this may result in us receiving more accurate and more competitively priced quotes,” Temple-Phillips says.
The Trust is considering the viability of expanding its use of ArcGIS Online to make selected data sets available to external trustees and partners who are unable to access the internal mapping solutions. “Now that we are a registered charity, more people have an interest in what we do,” explains Temple-Phillips. “ArcGIS Online will enable us to inform interested parties about our network and help them understand our work.”
Aviva
The ability to spatially analyse data means we understand our customers a lot better and sharing this insight with staff helps drive competitive advantage
This leading European insurance company uses Esri’s ArcGIS to increase its understanding of risk factors, such as susceptibility to flooding, at more than 28 million UK addresses. With this improved insight it can make better informed underwriting decisions, handle claims more efficiently and deliver more proactive customer service during major incidents.
The Customer
With 43 million customers across 21 countries, Aviva is one of Europe’s leading providers of life and general insurance and is the UK’s largest insurer serving over 14 million customers.
ArcGIS enables Aviva to run complex models more quickly and more frequently and thereby gain fresh insight into changing risk profiles
The company can respond to major incidents more effectively by using GIS to identify affected properties and policy holders
GIS is being used to identify trends and hot spots for insurance fraud, enabling Aviva to detect and block potentially fraudulent claims
The Challenge
Aviva UK has long been a pioneer in using GIS to rate flood risk at an individual address level. The company wanted to develop this expertise and spread the benefits of GIS across the business.
With GIS being historically desktop based, Aviva also needed to be able to change the way spatial analysis was used and consumed across the organisation. It had to empower users to work with GIS themselves. “
We wanted to develop a more informed view on the 28 million households in the UK through spatial analytics to create new insights, underwrite more accurately and allow us to price more effectively for individual levels of risk,” explained Eleanor Mclachlan, GIS Manager at Aviva UK. “The appetite and demand for GIS was also growing, with teams increasingly asking if data could be mapped. We needed to be able to spread the benefits of GIS to more areas of the business.”
We’re now able to run complex models on 28 million UK addresses more quickly and more frequently. Being able to combine a variety of different data sets in this environment means we can develop new models we couldn’t achieve otherwise. This delivers fresh, valuable insights across the board
Eleanor Mclachlan – GIS Manager at Aviva UK
The Solution
Several Esri developments have allowed Aviva to realise its vision to widen the use of GIS and derive new value from spatial analytics.
Storage of spatial data using Esri’s ArcSDE was the first step in helping the GIS team support the whole organisation. Spatial data now resides on the enterprise database, in the same place as the organisation’s tabular data. This single, central location to manage spatial data has made it easier to share it more freely.
More advanced modelling is being performed using Esri Model Builder, while the use of Python scripting allows the team to automate sophisticated analysis tasks, as Mclachlan explained: “We’re now able to run complex models on 28 million UK addresses more quickly and more frequently. Being able to combine a variety of different data sets in this environment means we can develop new models we couldn’t achieve otherwise. This delivers fresh, valuable insights across the board.”
The latest part of the GIS evolution at Aviva is the application of ArcGIS Server, used to develop and distribute mapping applications to the growing user base. This was part of a vision to give business teams the ability to work with their own spatial data. Aviva has also started to build custom mapping applications for various teams with the Esri Flex Viewer.
“Staff need to interact with their data on a map, they don’t just want a solitary answer or static hard copy map,” said Mclachlan. “Using ArcGIS Server we’re able to start satisfying the growing demand for spatial analytics and to push GIS out into the organisation. Most importantly, staff are able to make better decisions, from underwriting to claims, or fraud to resource planning.”
Our investment in Esri is helping us satisfy the flourishing appetite for location analysis across new lines, plus a whole range of job functions
Eleanor Mclachlan – GIS Manager at Aviva UK
The Benefits
GIS is now delivering new spatial insights to all parts of Aviva, from helping to support better underwriting decisions to improving customer service.
“Sophisticated GIS models are allowing us to understand risk better and underwrite more effectively, while the growing number of mapping applications are delivering new levels of operational value,” said Mclachlan.
At an operational level, GIS is delivering a whole raft of benefits:
Supporting strategic decisions
Staff at all levels are now using spatial analysis and geo-visualisation when making strategic decisions. One example covers improved resource planning for major incidents, while another is national asset management.
Better customer service
During a major incident, accurate answers to a range of difficult questions can be answered using GIS. The findings help Aviva determine the nature of a response, such as how many policyholders might be affected and their location. Granular geographic insights also help response teams to be pro-active, by seeing which addresses might be at risk and who should be contacted first. This makes the claims process as smooth as possible for customers and minimises the impact on the business, as the response activity can progress quickly and efficiently.
Reducing fraud
GIS is helping Aviva tackle fraud at a broad level, identifying where the major fraud hotspots are and whether a claim falls into such an area. At a more granular level, it can help to identify patterns and links between parties involved in a suspected fraudulent claim, providing much more insight than simply recording their postcode.
Social media insights
During the London riots the GIS team experimented with plotting Twitter feeds about rioting and compared them to the location of policies and incoming claims.
The GIS team at Aviva is rapidly becoming a hub, providing GIS services across the whole of the UK business and this is only going to grow as more benefits are achieved.
“Our investment in Esri technology is helping us satisfy the flourishing appetite for location analysis across new lines of business and a whole range of job functions,” commented Mclachlan. “The team has become an enabler, allowing staff to use GIS themselves, to interpret their own data and to make more accurate decisions. The ability to spatially analyse data on the UK’s 28 million addresses means we understand our customers a lot better. Being able to share this insight with as many staff as possible is what helps drive competitive advantage.”
Direct Line Group
GIS technology helps us to gain a better understanding of actual risk factors at individual properties, so we can price policies accurately
The UK’s largest home and motor insurer relies on Esri GIS technology to help it make more informed decisions when underwriting insurance policies in its commercial property division, NIG. The use of GIS gives Direct Line Group a better understanding of actual risk factors at individual properties, so it can price policies more accurately and profitably.
The Customer
Direct Line Group (DLG) is the UK’s largest home and motor insurer, consisting of several well-known brands including Direct Line, Churchill and Privilege. The brand also includes NIG, one of the country’s leading providers of business insurance offered exclusively through insurance brokers.
Increased granularity of risk intelligence means that underwriters can be more selective about what business NIG takes on, improving profitability
The organisation can give customers more accurate quotes and deal with more complex customer requirements, leading to added business wins
The marketing department makes use of the GIS to implement targeted marketing campaigns and offer discounts to low risk prospects
The Challenge
DLG’s primary objective was to improve its assessment of risk when writing business within in its commercial property division NIG, to be achieved through more accurate pricing and better control of accumulations of risk.
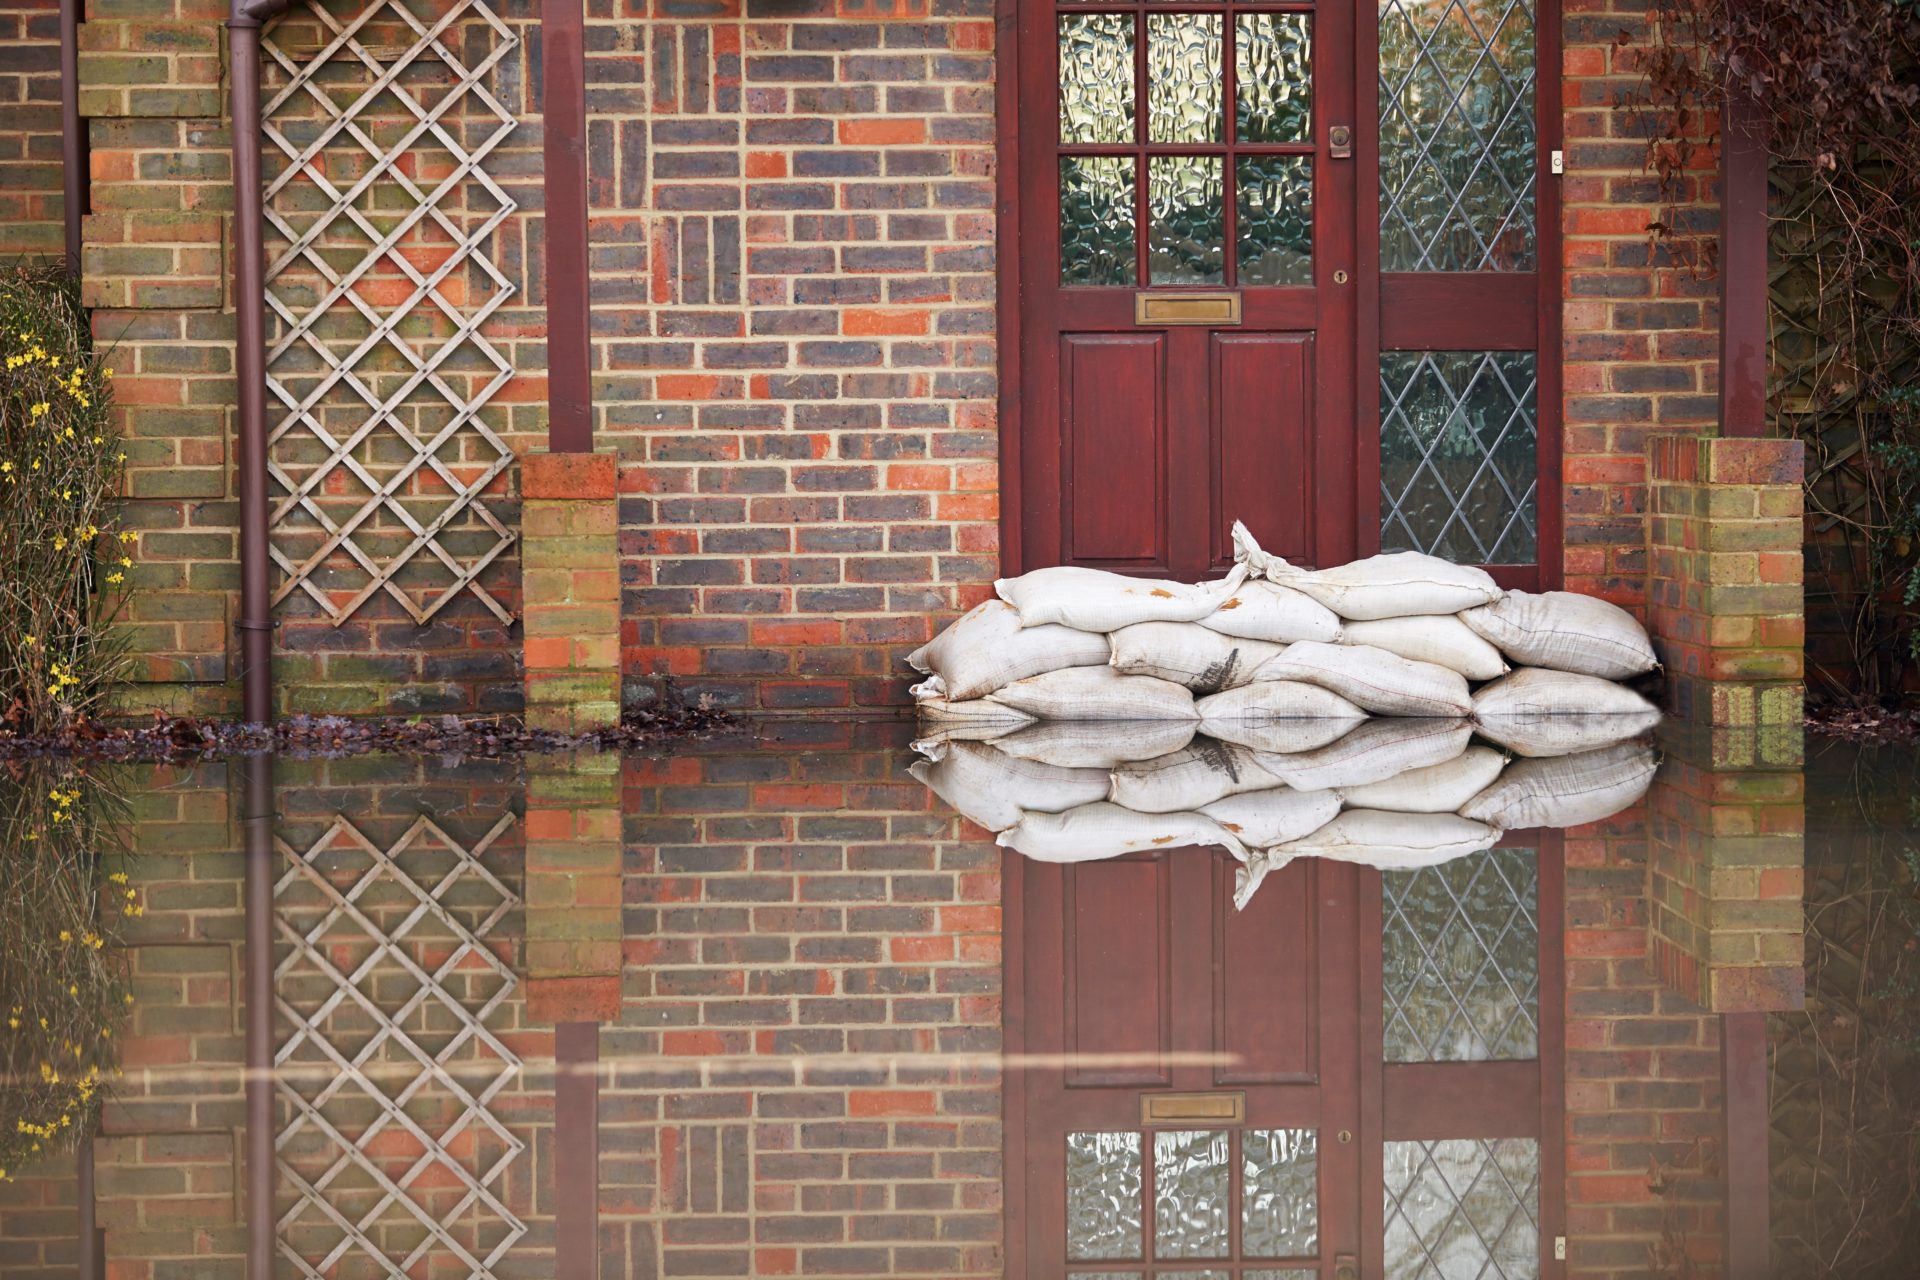
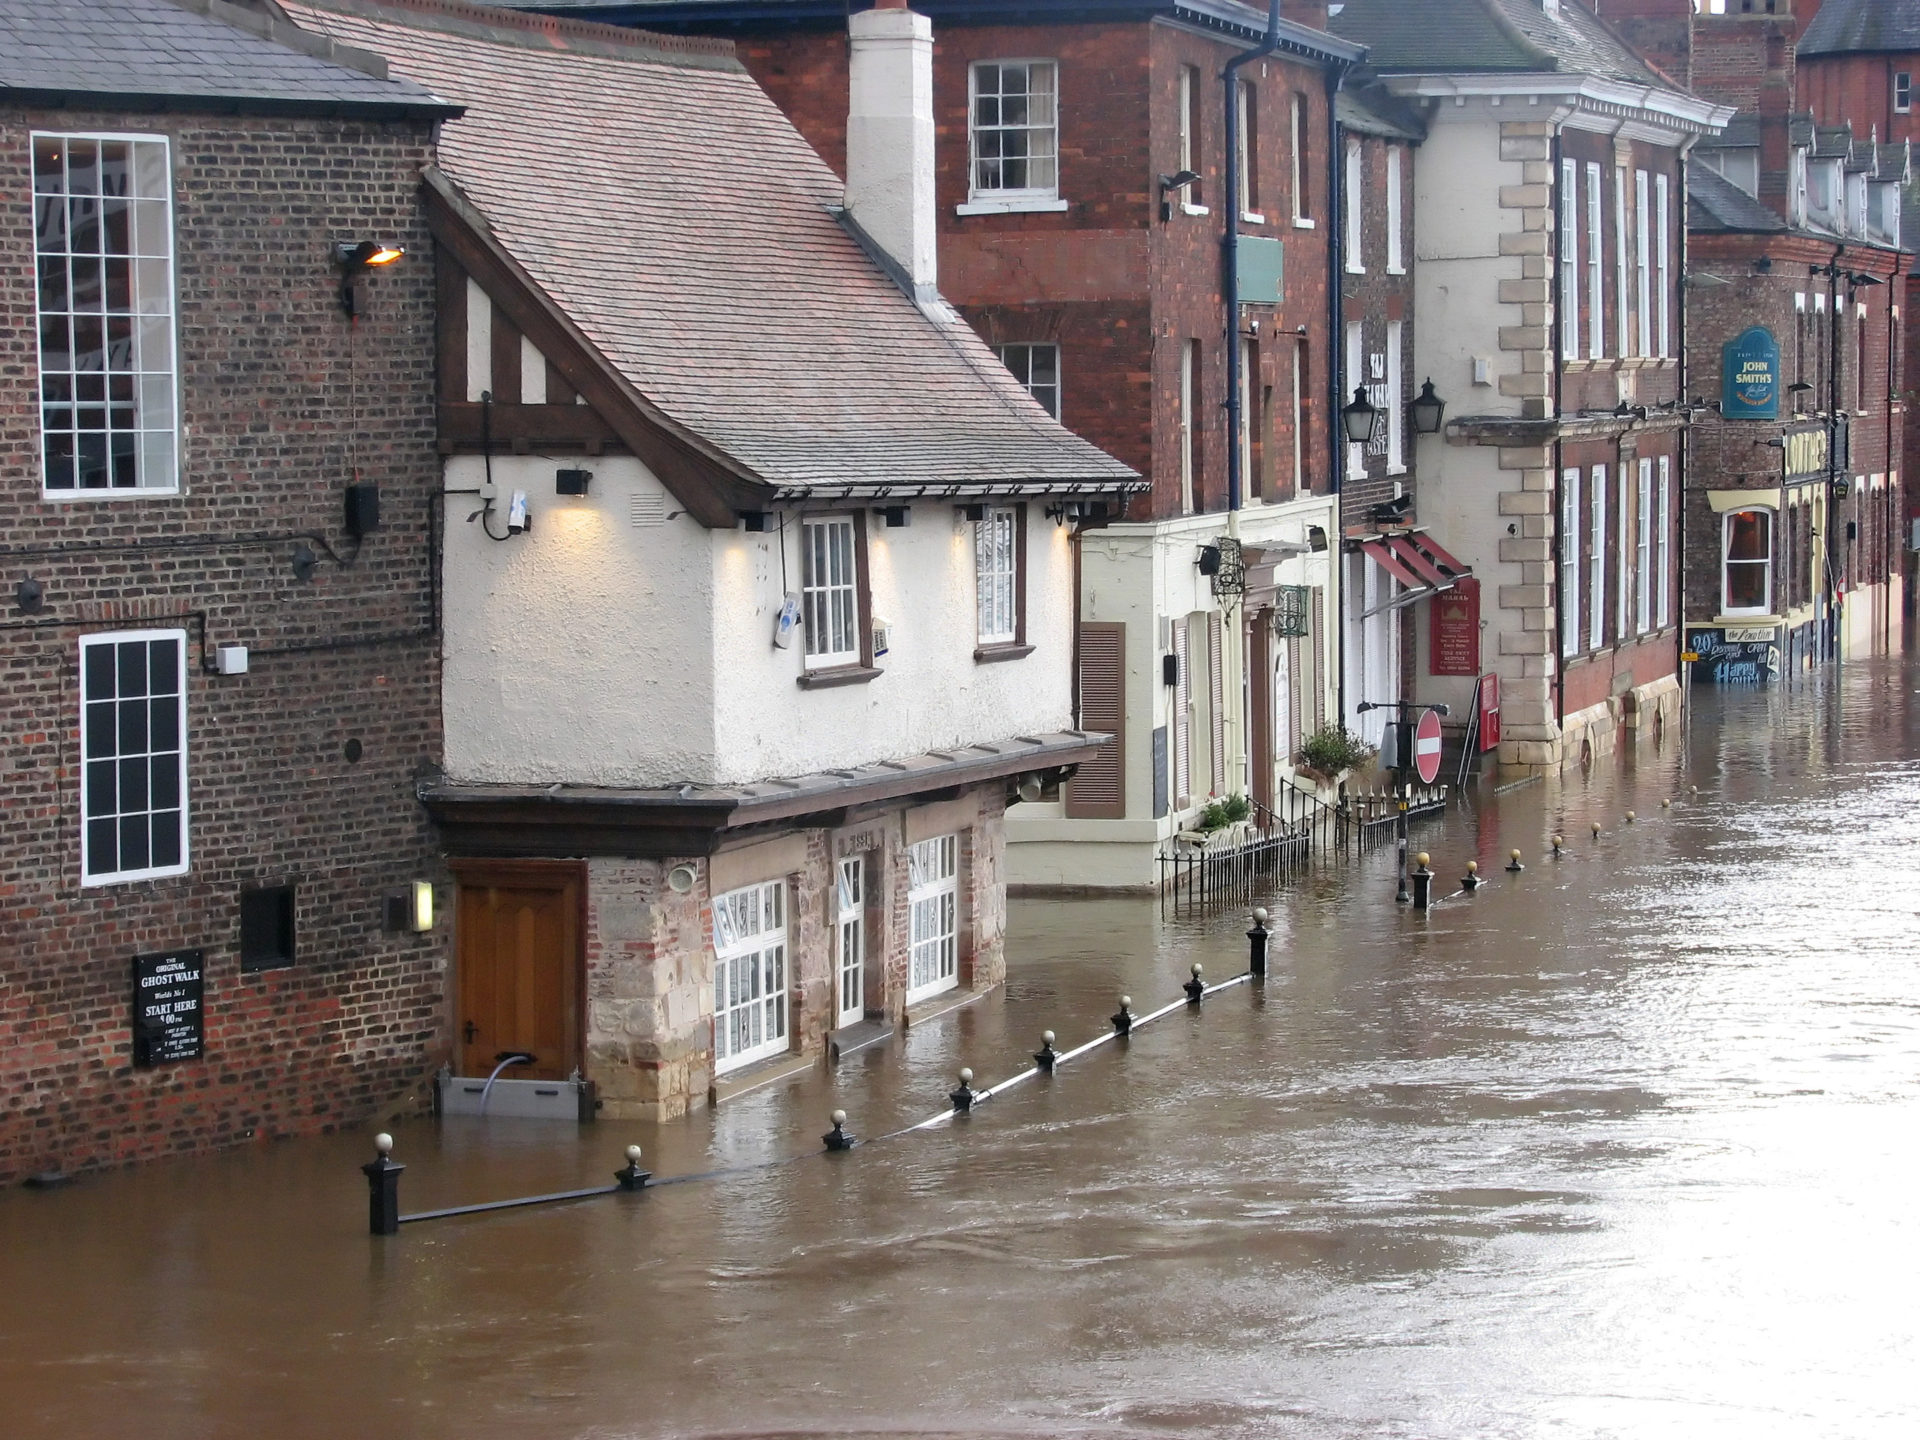
The main catalyst for the GIS project was the UK floods in 2007. The devastating events signalled the need for DLG to have a better understanding of the risks they were writing.
Previous risk assessment relied upon postcode level or district segmentation, while the data needed for writing business was gathered from multiple sources. Underwriters had to move from mainframe system to rating table, and from claims records to the Environment Agency website; to assess the risk of a piece of business. In addition, data was presented in a traditional non-spatial format as numbers on a page.
“The business case for a new Geospatial system was all about improving the risk of our commercial portfolio to reduce the level of claims and run a more profitable business. To achieve this we needed to improve upon the precision offered from using a postcode level of rating,” explained Richard Jones, Head of DLG’s Geospatial Unit.
Our goal was to develop a new system with the industry’s most powerful GIS, to provide greater insight to the business we write and therefore improve our understanding of risk
Richard Jones – Head of Geospatial Unit at Direct Line
The Solution
DLG needed a powerful GIS platform at the heart of its new approach and after a rigorous review process selected Esri UK as its GIS provider.
“Our goal was to develop a new system with the industry’s most powerful GIS, to provide greater insight to the business we write and therefore improve our understanding of risk,” said Jones. “We wanted to be able to differentiate between individual properties on the same street and allow a higher level of interaction with more data, enabling users to drill into maps and view contextual information simultaneously.”
Now DLG can examine a map showing a property anywhere in the UK to assess risk in terms of fire, flood, subsidence, theft or windstorm, with the ability to include additional perils as required.
“Esri UK developed both aspects of our new Geospatial system – the back-end analysis tool plus the front-end underwriter interface Risk Explorer,” said Jones. “The Esri team also developed the geocoding process to convert postal addresses into co-ordinates, which allows the market leading address point risk assessment to be carried out.”
With Risk Explorer, DLG underwriters now have all the information they need in one place, which enhances the whole underwriting process, as Jones explained: “Using the new Esri interface, staff can now visualise what the data is telling them. They don’t have to interpret a series of postcode tables with associated loadings. Underwriters now interact with a map, see where the property is at an address level, and view all of its related contextual information including perils, local points of interest, loadings, discounts and accumulations.”
We’re confident we can identify the level of risk more accurately than our competition and this ultimately means a more profitable business
Richard Jones – Head of Geospatial Unit at Direct Line
The Benefits
By moving from postcode level risk assessment to address level, Geospatial has taken DLG’s understanding of risk another step forward. Primarily concerned with matching price to risk for the commercial division, the models created in ArcGIS are also being used in some Personal Lines pricing. Other insurers might not be aware of the risk and therefore price business at the wrong point, taking on the customer at an unprofitable level.
“Geospatial gives customers more accurate prices, provides our underwriters with a wider range of information and shows reinsurers a more detailed picture of our portfolio risk,” summarised Jones. “The increased granularity of risk intelligence means business is being priced more accurately and consistently and underwriters can be smarter about what business we take on board.”
The system also offers the ability to generate multiple quotes on more than one property in a single action, which gives a vastly improved ability to deal with more complex quotes. Through this, DLG has successfully secured some large new business accounts that previously it would not have been able to compete for.
Geospatial is also adding value in ways that were not thought of initially. Marketing are applying the insight to develop more targeted campaigns, with discounts offered to those who may now pose less of a risk to others. DLG is confident that other insurers who don’t have the same level of intelligence will not be able to offer the same competitive but profitable price.
Another added benefit is when DLG have to model the impact of fictitious scenarios on its portfolio, set by the FSA (Financial Services Authority). Previously this would be hard to do, but now a more scientific approach is applied to demonstrate how a disastrous event would impact their exposure.
By pricing risk at an address level instead of postcode, Geospatial is helping DLG run a more profitable business. It supports both the writing of larger volumes of profitable good risk business and avoidance of writing unprofitable poor risks. Geospatial is now established as an invaluable tool for the underwriting community.

Air Warfare Centre
GIS is incorporated into military training exercise, teaching students how to plan strategically and make fast decisions in critical situations
The Air Warfare Centre has incorporated GIS into a military training exercise to help senior servicemen and women hone their skills in planning and implementing military operations. This inventive application of GIS technology teaches students how to plan strategically and make fast decisions, based on evidence, in critical situations.
The Customer
Part of the Royal Air Force (RAF), the Air Warfare Centre’s training branch conducts a range of courses in the theory and practice of air combat. It aims to help servicemen and women develop the necessary skills for air operations, intelligence, electronic warfare, weapons targeting and battle damage assessment. As well as RAF personnel, the Air Warfare Centre also trains selected members of the Royal Navy and Army, plus military personnel from overseas.
Situational information is displayed on digital maps, making sense of complex and evolving scenarios
The map-based data constantly updates, as the exercise progresses, giving students a dynamic intelligence tool
Students have a high quality learning experience and leave the course equipped with valuable new skills
The Challenge
Every year, up to 200 servicemen and women, mostly senior officers, are selected for the Higher Air Warfare Course and the Air Battle Staff Course. An integral part of both courses is a complex and demanding practical exercise. The exercise is called a wargame, but this name belies its critical importance. Taking place in a fictitious geographic area, the exercise requires students to react to a scenario and to plan and implement an air campaign against an opposing force.
“Wargames are crucial to the training we deliver,” says Squadron Leader Mike Lence, the officer commanding the Air Warfare Centre’s wargames section. “The skills learnt on our course are used to plan and implement missions in situations of conflict all around the world.”
When the wargames were first developed, students had to rely on paper maps and refer to many separate document-based datasets. They looked up information in tables and for geographical reference put yellow sticky notes onto maps. “It was a slow, laborious process,” says Tony Stephens, a member of the wargames team.
The tutors at the Air Warfare Centre were concerned that students were spending too much time finding information and not enough time thinking about the scenario and developing plans. “We wanted to find a way to speed up the process and provide greater insight, so that students could get more value out of the exercise,” says Stephens.
Many students have told me that this was the best course they have experienced in the RAF
Mike Lence – Squadron Leader
The Solution
The Air Warfare Centre explored a number of different options using digital copies of paper maps and various mapping applications. It selected ArcMap, a Geographic Information System (GIS) from Esri. The organisation could export exercise data from database files in its computer model into an Oracle database and then display it using ArcMap.
The team customised ArcMap and created a range of icons to represent items in the database. The students select the attributes that they want to view – such as airfields with bombers, non-military targets or communications centres for example – and icons representing these features are visible on the map. “If it’s in our database, they can see it, and they can see what they want when they want,” says Stephens.
Students create a map view using ArcMap, display it on a large screen, and save ‘views’ to refer to later in the exercise. Data is updated automatically from the databases as the exercise progresses, and students view the progress of their missions day by day. Stephens says: “We started with the intention of creating a static, interactive map, but it quickly became apparent that we had a dynamic intelligence tool. This was a real bonus.”
The Air Warfare Centre team also added colour coding to the icons displaying exercise data. As a location or facility becomes progressively degraded by attacks, it changes colour. Course mentors flick through maps from each stage of the exercise and show students how a situation is changing overtime.
GIS has become pivotal to the delivery of our training, it enables us to bring together all of the information that students could possibly want to interrogate and make it available to them at their fingertips
Mike Lence – Squadron Leader
The Benefits
Students spend less time finding out about the fictional area where the crisis is unfolding and more time analysing the situation and developing military operations. “Students get stuck into the exercise very quickly because they haven’t got to learn the environment,” says Stephens. “They can concentrate on their plan to counter the enemy and learn about operations planning.”
Between sessions, tutors look at ArcMap to check the outcomes of each student’s decision-making and prepare advice or make changes to the exercise parameters to create more challenges.
Students can also look back over time with their tutors and easily see the point where things started to go wrong. In this way, ArcMap helps students to understand and learn from their mistakes.
Major Steve Jones of the United States Air Force attended the wargames exercise as a student. He says: “I have done other military training courses, but in my opinion this course is particularly good. It is tailored to an air perspective, is very thorough and does a much better job helping students to acquire specific skills. Rather than sitting around a table surmising about what the results of our actions might be, we see the impact on a map.”
Today, the Air Warfare Centre’s wargames have become so sophisticated that the organisation believes that it would be difficult to run the exercises without ArcMap. “GIS has become pivotal to the delivery of our training,” says Lence. “It enables us to bring together all of the information that students could possibly want to interrogate and make it available to them at their fingertips.”