Blog Archives

Energy Systems Catapult
We have built an innovative range of data products with ArcGIS that are helping to accelerate net zero strategies.
Established to accelerate innovation in net zero energy, the company Energy Systems Catapult has used ArcGIS to create authoritative new data products. It is now marketing the range, called Net Zero Data, to local authorities and commercial organisations to help them prioritise and deliver their decarbonisation strategies.
Data from circa 30 open, commercial and in-house sources was collated, processed and analysed with ArcGIS Pro
Updates to the Net Zero Data products are analysed and added daily, in an automated process created with ArcPy
Customised demonstrations for customers are built quickly and easily using ArcGIS web apps and story maps
The Challenge
Public and private sector organisations across the UK have aspirations to achieve net zero—but it can be incredibly difficult to understand where to begin. The independent research and technology company, Energy Systems Catapult realised that local authorities, in particular, were setting carbon targets without fully understanding where they could achieve the largest reductions in carbon emissions or which low carbon energy schemes might deliver the best results across their regions.
A lot of open source data was available to local authorities, but it wasn’t always clear which datasets met their needs, were authoritative, could be relied upon, and covered all key use cases. Furthermore, although the data was free to use, there was a hidden cost involved in formatting and analysing it, before it could be used to inform significant investments in decarbonisation strategies and green energy.
“As we are using ArcPy instead of applying updates manually, we can ensure a highly accurate and consistent approach.”
Ben Walters, Senior Modelling Consultant, Energy Systems Catapult
The Solution
Energy Systems Catapult has strong expertise in this field, having developed the Local Area Energy Planning (LAEP) guidance that is widely used across the public sector for producing sustainable energy plans. It also has employees with 30 years’ combined experience of using Esri’s geographic information system (GIS) technology, ArcGIS, with open source, commercial, and in-house developed data. It therefore had the technical skills and knowledge in-house to support local authorities and help them realise their net zero goals.
The company used ArcGIS Pro to collate, process and analyse a vast amount of open, commercial and in-house developed data from around thirty different, trusted input sources. It used tools available within ArcGIS Pro, including Spatial Analyst, to determine the precise attributes of buildings, such as roof shapes and side access, and scientifically calculated the relative decarbonisation potential of each property in Great Britain. It then packaged this intelligence into a suite of datasets in the Net Zero Data range.
Customers can quickly purchase Net Zero Data online through Energy Systems Catapult’s online data marketplace, import it into their own ArcGIS systems, access it via an application programming interface (API) or purchase it as part of a data visualisation package. They can then explore the data on interactive maps to understand the indicative suitability of each building for low carbon and renewable technologies, such as air source heat pumps and photovoltaic panels. Buildings are colour coded on the maps, making it very easy for councils to see and prioritise areas with high concentrations of ‘red’ buildings where decarbonisation projects could have the greatest positive impact.
Energy Systems Catapult uses ArcPy to automate daily updates to the data product range in Net Zero Data. For instance, ArcPy automatically recalculates the potential of different types of green energy at each property, daily, to take into account changes to housing data and other new data sources.
To support the sale process, sales personnel within Energy Systems Catapult use ArcGIS Online to create custom web apps, as demonstrations for customers. They have also created engaging stories with the ArcGIS StoryMaps app. Available via the company’s website, these interactive sales tools provide a clear and engaging introduction to the benefits and uses of Net Zero Data.
“I have not had any formal GIS training but can build customised web apps as demonstrations for customers in ArcGIS very quickly.”
Sandeep Kang, Senior Product Manager, Energy Systems Catapult
Benefits
An innovative and authoritative suite of data products
Through the use of ArcGIS, Energy Systems Catapult has been able to develop and launch an innovative and authoritative new data product that adds value for local authorities and other organisations that are working towards net zero. Net Zero Data enables users to answer specific questions ranging from which social housing stock do we insulate first to where do we put electric vehicle charging hubs. “All the data needed to answer questions is now in one place, in a standardised, easy-to-use, pre-packaged datasets,” says Sandeep Kang, Senior Product Manager at Energy Systems Catapult.
An automated mechanism for updating data
The automated mechanism that Energy Systems Catapult has developed with ArcPy enables it to ensure its Net Zero Data product is constantly refreshed and relevant for its customers. “As we are using ArcPy instead of applying updates manually, we can ensure a highly accurate and consistent approach,” explains Ben Walters, Senior Modelling Consultant at Energy Systems Catapult. “Local authorities don’t need to worry about whether the data is out-of-date and can trust it for their decision-making.”
Lower cost and faster sales cycles
Energy Systems Catapult has used ArcGIS to create a portfolio of versatile and cost-effective tools for promoting its Net Zero Data product. Web apps and story maps are quick and easy to produce, which helps to reduce the cost of sale. “ArcGIS is super, super intuitive,” says Kang. “I have not had any formal GIS training but can build customised web apps as demonstrations for customers in ArcGIS very quickly. The flexibility of ArcGIS goes a long way to supporting our sales process.”
Faster achievement of net zero targets
Energy Systems Catapult is certain that its ArcGIS-driven initiative to make better data available will accelerate its customers’ journeys to net zero. One customer recently used Net Zero Data to prioritise the installation of solar panels on village halls, based on their energy usage. “Our customers can see exactly where to focus their attention and investments to decarbonise faster,” says Walters. “Without ArcGIS, we wouldn’t have been able to deliver that level of accuracy.”


North Sea Transition Authority
The world’s first carbon storage licensing round was supported end-to-end by an ArcGIS-driven process.
The North Sea Transition Authority is responsible for awarding licences for carbon storage as part of its role as the official UK regulator for the oil and gas, offshore hydrogen and carbon storage industries. It successfully completed the world’s first-ever licensing round for carbon storage, using ArcGIS to share information with applicants and manage the bid process.
Carbon storage round information, covering 12,000 km2 of seabed, was collated and processed using ArcGIS Pro
An open data portal for sharing data on carbon storage sites is powered by ArcGIS Hub technology
External and internal users explore information with intuitive web apps built with ArcGIS Online
The Challenge
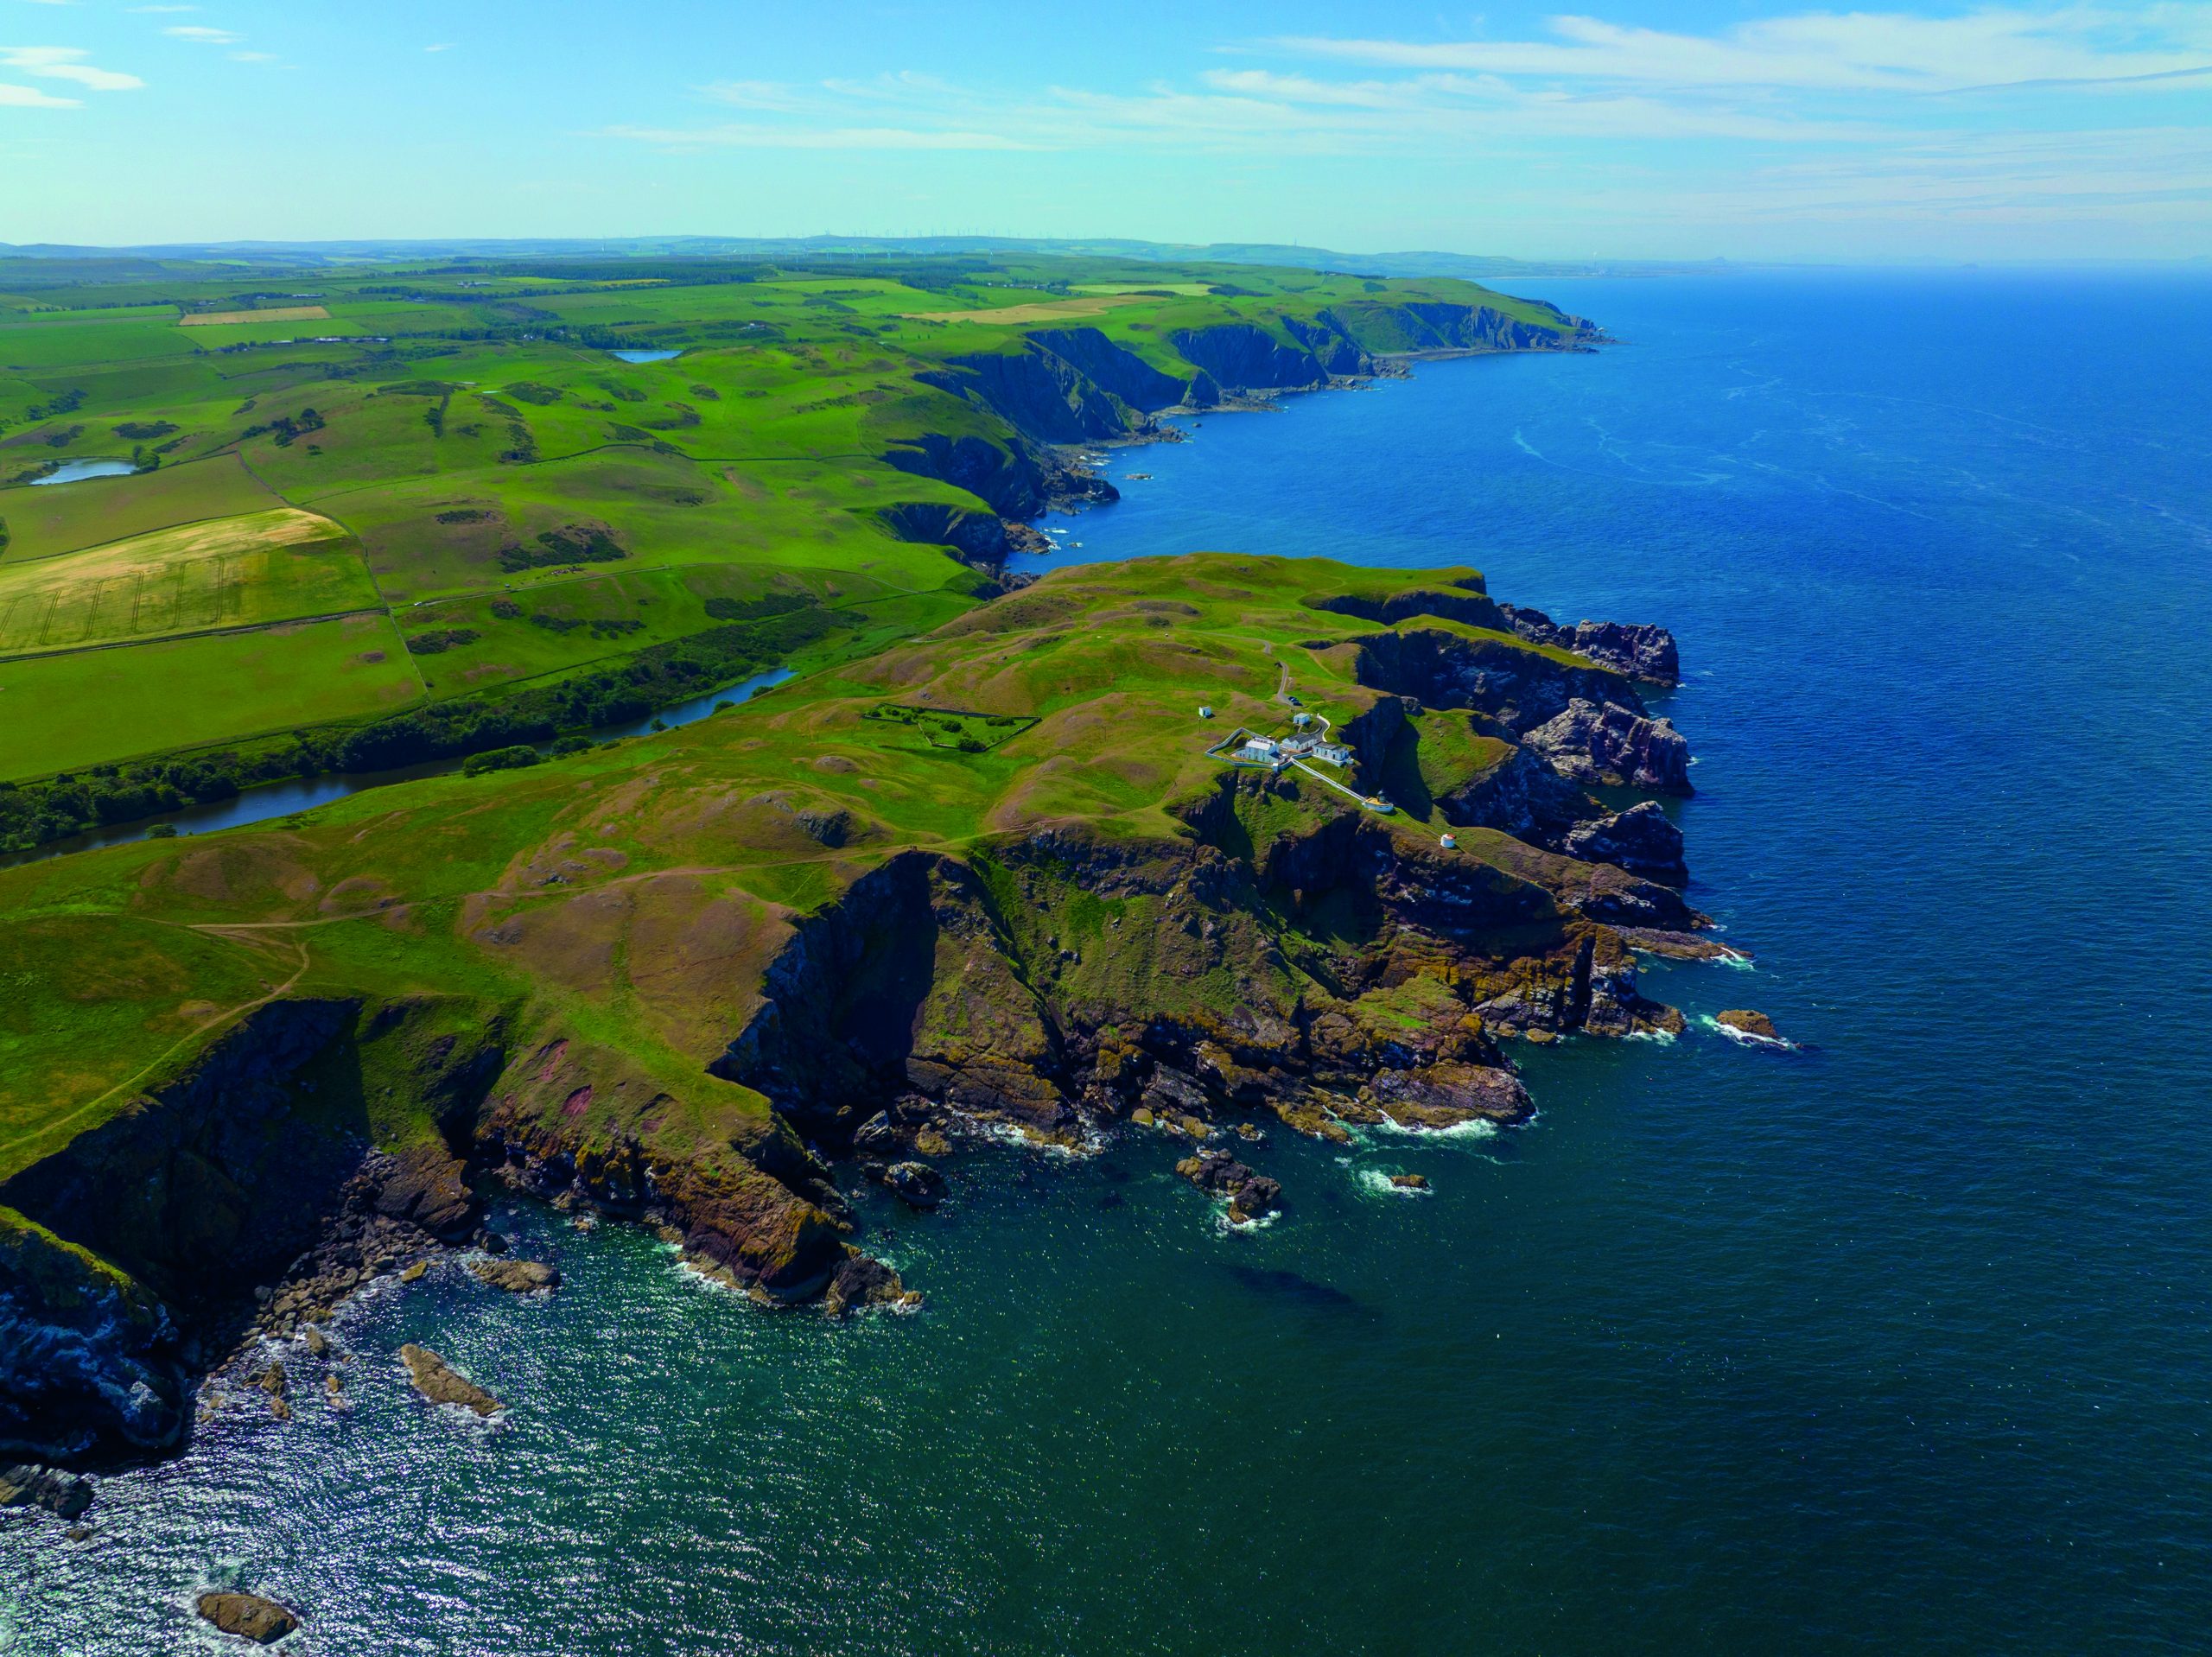
Carbon storage will play a key role in helping the UK to achieve net zero, and there is significant potential to store carbon offshore. In 2022, NSTA announced that it would be holding the world’s first large-scale, competitive bid process to award licences for the development of carbon storage facilities at thirteen marine sites. Located off the coasts of Norfolk, Teesside, Liverpool and Aberdeen, these sites, together, are capable of storing almost 10% of the UK’s total greenhouse gas emissions.
Organising a licensing round of such national importance was a major undertaking for NSTA. It needed to find an effective way to share information with all potential bidders and manage the application process efficiently. At the same time, NSTA needed to ensure that the process was equitable and open to all kinds of potential operators, from the large energy companies already operating in the North Sea to small, niche carbon storage companies.
“We were genuinely delighted by the number and quality of applications that we received and the breadth of organisations that these bids came from.”
Nick Richardson, Head of Exploration & New Ventures, NSTA
The Solution
NSTA had been using Esri’s geographic information system (GIS) technology for many years to share geospatial information both externally and internally, enabling people to make fast, informed decisions. It decided to use a combination of products from Esri’s ArcGIS suite to create new datasets, processes and mapping applications to support the carbon storage licensing process, from start to finish.
The organisation began by using ArcGIS Pro to compile all available data about the thirteen designated carbon storage zones and surrounding marine areas. It included vital information like bidding area boundaries, along with data from The Crown Estate and Crown Estate Scotland, to create a ‘single source of the truth’ that could be used not only internally but also shared with potential bidders.
NSTA then made all this data, covering 12,000 km2 of seabed, available to any company interested in bidding for a carbon storage licence, via its open data portal. Built with ArcGIS Hub technology, the portal enabled bidders to either download or stream the information they were interested in directly into their own systems.
To complement the open data portal, NSTA created an external web app, using ArcGIS Online, that allowed potential bidders to explore live maps and analyse all of the available datasets online, without the need for specialist software or skills. Bidders could see the zones that were available and identify factors that could affect any future appraisal and development including nearby infrastructure, wind farms, and seismic surveys.
NSTA also built an internal web app in ArcGIS Online to support the administration of the licensing process. This app provided a central portal for access to all available information and applications from interested organisations. It facilitated effective collaboration between NSTA’s employees and supported the end-to-end process of communicating with potential bidders, receiving and assessing applications and awarding contracts.
“We have created a process with ArcGIS that is adaptable to accommodate different user needs and that is malleable to future requirements.”
Tanya Knowles, Head of Digital Services, NSTA
Benefits
An efficient, end-to-end licensing process
NSTA’s streamlined, ArcGIS-driven process helped to avoid duplicated tasks and created efficiencies throughout the administration of this first-of-its-kind carbon storage bidding process. All of the bids were submitted in the same format, which helped to create a level playing field for organisations competing for carbon capture licences in the North Sea. The organisation successfully awarded 14 companies 21 licences to store carbon in depleted oil and gas reservoirs and saline aquifers, paving the way for up to 30 million tonnes of carbon dioxide to be stored annually by 2030.
A broad range of applications
The external ArcGIS web app helped to encourage a broad range of applications by making the application process accessible to small, niche carbon capture companies as well as the giants of the energy industry. Regardless of whether they were experienced or novice GIS users, applicants could visualise sites on the ArcGIS web app, find pertinent data about the seabed and historic activity, and assess the potential of the licence areas. “We were genuinely delighted by the number and quality of applications that we received and the breadth of organisations that these bids came from,” says Nick Richardson, Head of Exploration & New Ventures at NSTA.
Lower cost to market for successful bidders
By using ArcGIS Hub technology and an ArcGIS web app to share information that is already available, NSTA is reducing costs for the successful bidders. There are 60+ years of subsurface surveys in its National Data Repository, originally conducted for the oil and gas industry, that can be reused to support the nascent carbon capture industry. Sharing data with ArcGIS in this way has the potential to reduce the cost to market for carbon storage quite significantly, as organisations do not have to go out and repeat the same initial geological surveys.
A proven approach for future licensing rounds
NSTA’s ArcGIS-based approach to transforming access to information has captured international attention, and the organisation was presented with a Special Achievement in GIS award at the Esri User Conference in San Diego in 2024. “We have created a process with ArcGIS that is adaptable to accommodate different user needs and that is malleable to future requirements,” says Tanya Knowles, Head of Digital Services at NSTA. “We will now use this process as the basis for a future process that will be even more sophisticated and robust.”
Rivers Trust
Rivers trusts, conservation organisations and community groups use an ArcGIS Hub to map nature-based flood solutions.
The Rivers Trust is playing a leading role in helping to accelerate the delivery of nature-based solutions to flood risks in Britain. It has built a Natural Flood Management Hub with ArcGIS Hub Premium to enable conservation organisations, community groups, farmers and volunteers to work together more effectively to help protect vulnerable communities.
Around 80 conservation and community organisations share information securely via ArcGIS Hub Premium
More than 5,600 nature-based flood risk interventions are displayed on interactive maps and dashboards
Data and pictures to evidence new natural flood management measures are uploaded via ArcGIS Survey123 forms
The Challenge
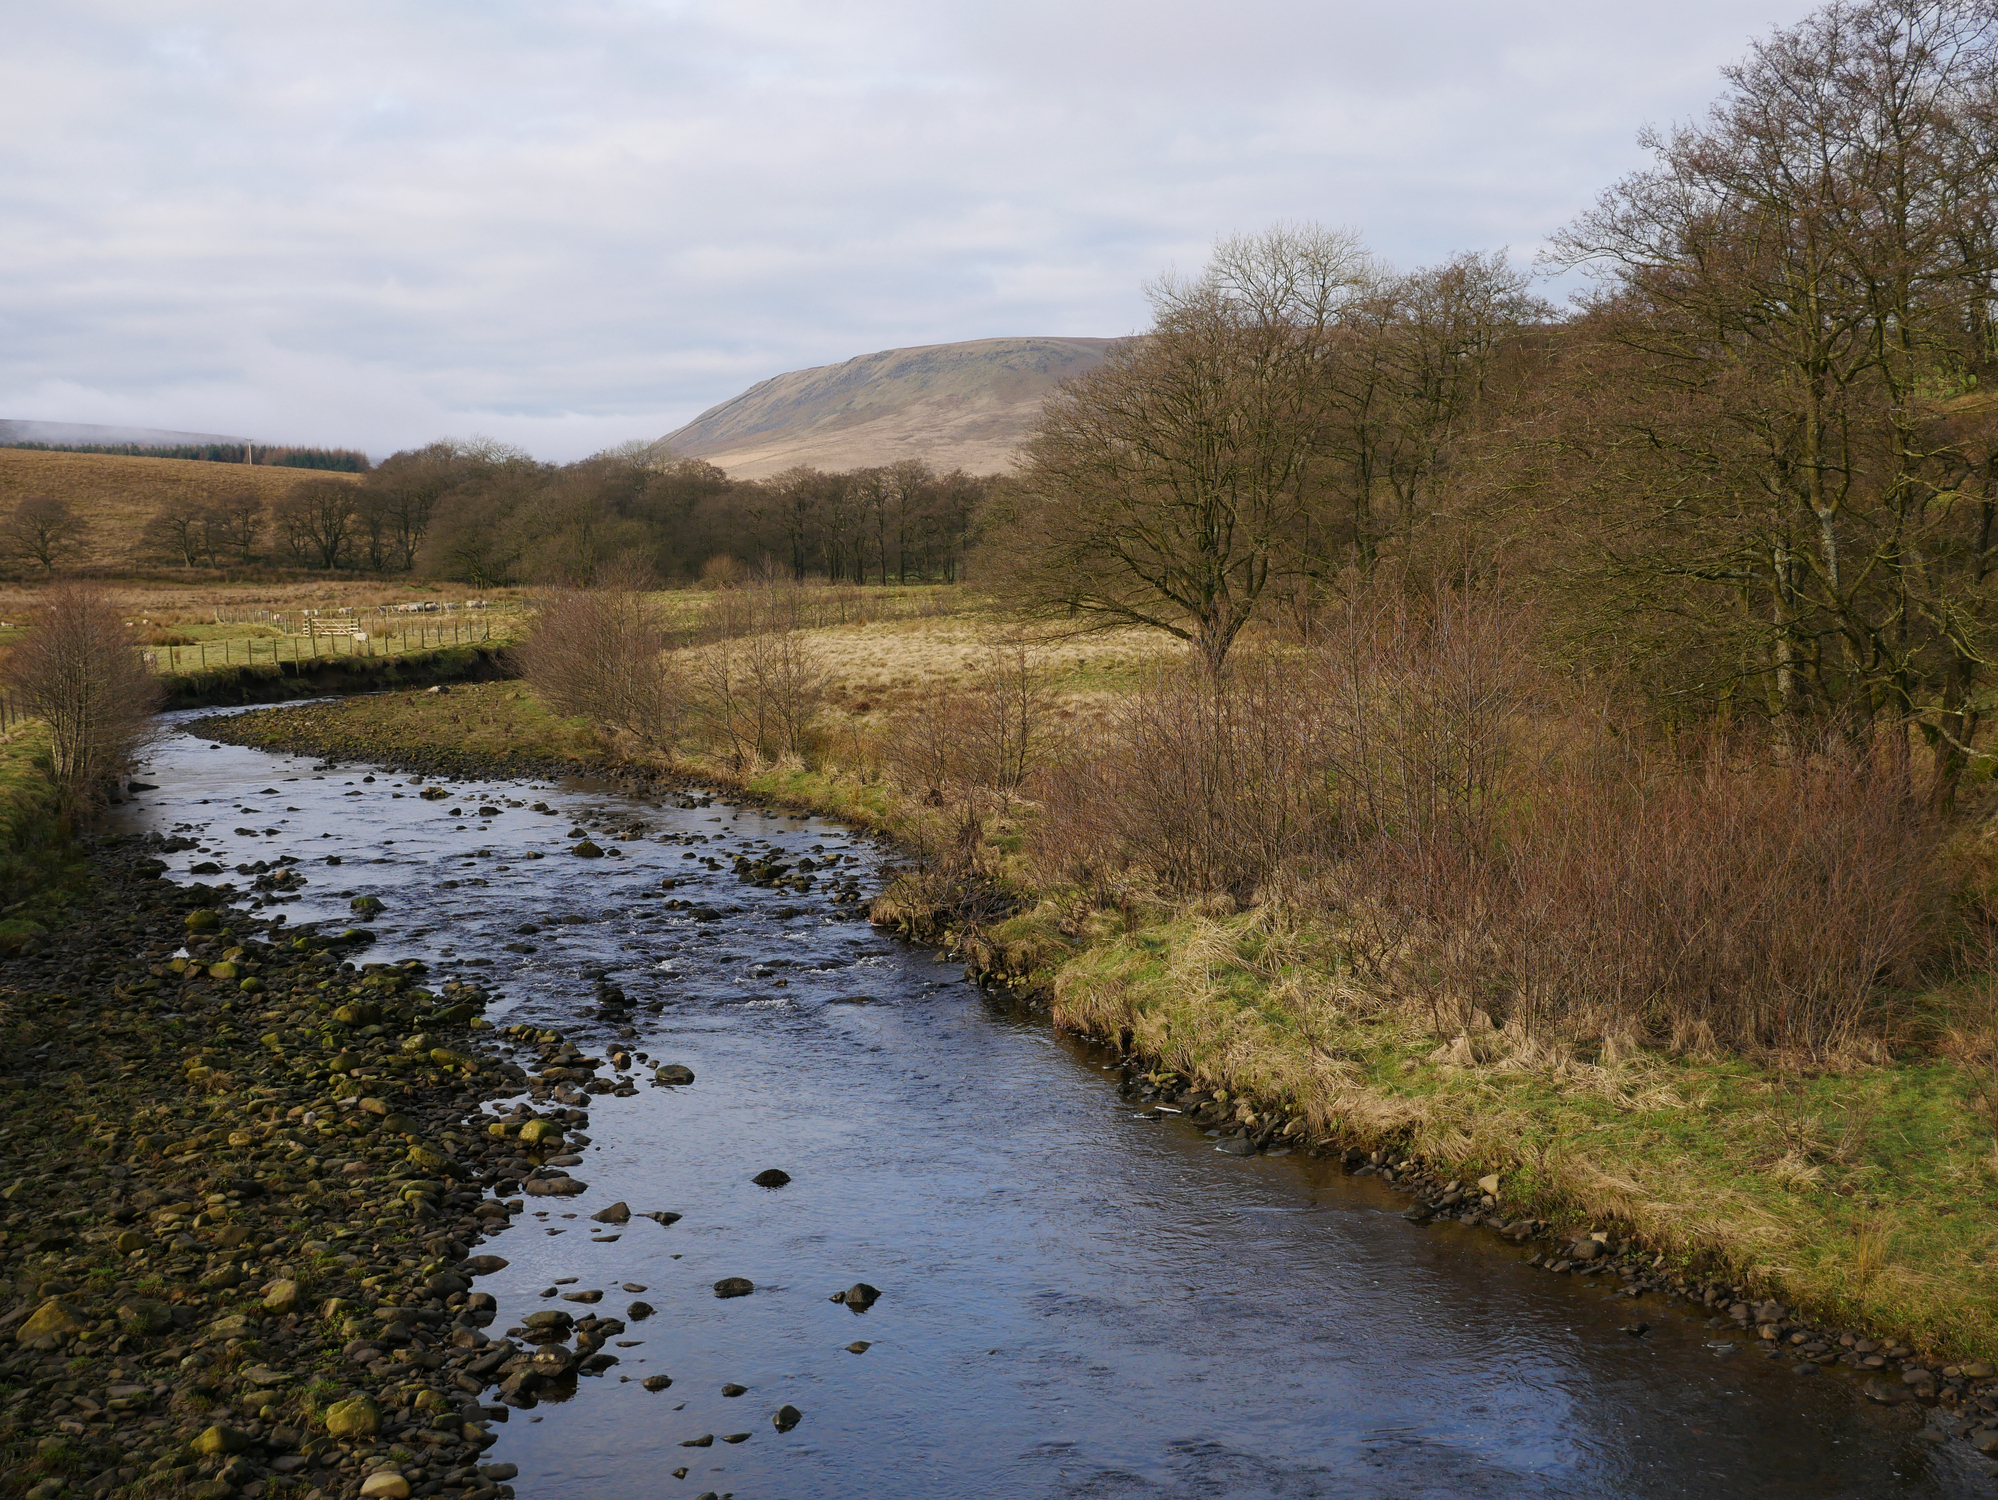
The Rivers Trust is the umbrella organisation for 65+ individual member river trusts and a strong advocate for Natural Flood Management (NFM). This nature-based approach to minimising flood risks involves building ‘leaky barriers’, planting trees and implementing other nature-based flow management measures, to slow, intercept and store flood water upstream and, thereby, reduce flood risks for communities downstream.
As an expert in river catchment conservation, The Rivers Trust has a wealth of data at its disposal that can be used to inform the implementation of NFM schemes. It wanted to make this insight available to member river trusts, local conservation groups and residents to help them track NFM projects. At the same time, the organisation also wanted to improve collaboration between groups working in similar locations, to accelerate the implementation of NFM schemes and improve their effectiveness.
“The NFM Hub is the largest map database of community-managed nature-based solutions that we are aware of.”
Heather Bell, Senior Technical Analyst, The Rivers Trust
The Solution
The Rivers Trust is a longstanding user of Esri’s geographic information system (GIS) technology. With support and funding from the Environment Agency, it used Esri’s ArcGIS Hub Premium and ArcGIS Experience Builder solutions to create a national database of information on river catchments, including NFM projects that are planned, in progress or completed throughout England and Wales, so far.
Called the NFM Hub, the solution was specifically designed to be easy to use by people without any experience of GIS. It is now used by around 80 groups, and growing, from member river trusts and conservation charities to small community-led flood action groups, enabling all these organisations to discover information about their local river environments and gather evidence of the need for nature-based solutions such as wetlands, river meandering and riparian tree planting.
Within the NFM Hub, each organisation has secure access to its own dashboards and can view information visually on interactive maps. Users can take advantage of integrated survey forms, built with ArcGIS Survey123, to collect and upload information about their own projects. They can explore other nearby projects, identify opportunities for collaboration and edit their own data all in one place.
Currently, the NFM Hub shows the locations of more than 5,700 NFM interventions and records the creation of over 1.7 million m3 of water storage and more than 43.3 million m3 of surface ‘roughness’ for slowing the flow of flood water. “The NFM Hub is the largest map database of community-managed nature-based solutions that we are aware of,” says Heather Bell, Senior Technical Analyst at The Rivers Trust.
“ArcGIS is an incredibly powerful tool. We couldn’t have done anything about the issues seen in our catchment without looking at data and evidence.”
Thomas Myerscough, General Manager, Wyre Rivers Trust
Benefits
Easy access to river catchment data
The NFM Hub provides local organisations with easy access to high quality data and evidence that they can use to inform new NFM schemes and better protect communities. For example, the Wyre Rivers Trust has used the NFM Hub in its work with the Churchtown Flood Action Group, a group formed to help prevent a repeat of the devasting flooding of 2015. “ArcGIS is an incredibly powerful tool,” says Thomas Myerscough, General Manager of Wyre Rivers Trust. “We couldn’t have done anything about the issues seen in our catchment without looking at data and evidence.”
Improved collaboration between organisations
As the above example clearly illustrates, the NFM Hub is proving highly effective in supporting and facilitating collaboration between river trusts and community groups. “It’s only by working together that we are actually going to see the changes that we need in the environment,” observes Bell. “The NFM Hub makes sure that everyone can see what is happening in their local area and maximises opportunities for collaboration.”
Effective empowerment of local communities
The NFM Hub has empowered local communities, including residents, landowners and volunteers, to drive change, by giving them the information they need in a format that is easy to understand. Andrew Metcalf is a farmer in Wyresdale, who has been supporting the creation of leaky dams, buffer strips and woodland blocks on his land. “To see it on a map puts it all into place,” he says. “From the Wyre Rivers Trust to farmers to individual people in the communities, we can do so much if we work together.”
A mechanism for attracting investment
By recording planned NFM projects, as well as completed ones, the NFM Hub displays a pipeline of investible projects which investors can see and then fund. Consequently, The River Trust’s work on the NFM Hub has provided a mechanism to encourage investment in regional NFM projects. The Wyre NFM project, mentioned above, has successfully raised £1.5million of green and blended finance and uses the NFM Hub to engage with stakeholders.
Accelerated delivery of nature-based solutions
The Rivers Trust anticipates that the NFM Hub will ultimately help to accelerate the delivery of nature-based flood solutions, by speeding up the process of engaging with stakeholders and contributing to faster decision-making. The NFM Hub will support a data- and evidence-based approach to the collaborative delivery of NFM that is already being used to plan and deliver £25 million of future investment, which will hopefully increase in the future as confidence in Nature Based Solutions grows.

Mott MacDonald
ArcGIS played a central role in enabling us to survey biodiversity at 14 separate sites and deliver a fast, high-quality service for our clients
The global engineering, development and management consultancy Mott MacDonald has used ArcGIS to survey habitats and assess the health of nature at 14 separate hospital sites across Wales. The use of ArcGIS facilitated the collection of highly accurate, consistent data and led to the creation of attractive, visual plans for biodiversity improvements.
Data cleansing in ArcGIS Pro reduced data processing from days to hours
28 detailed site plans produced with ArcGIS symbology in under a month
Interactive ArcGIS web app improves collaboration with healthcare client
The Challenge
All public authorities in Wales have a statutory duty to maintain and enhance biodiversity on their land. Under the terms of Section Six of the Environment (Wales) Act 2016, public sector organisations, including health boards and health trusts, are required to consider their impact on ecosystems and publish a plan explaining what they will do to maintain and enhance biodiversity and promote resilience.
Faced with this responsibility, two hospital groups in Wales, Powys Teaching Health Board and Aneurin Bevan University Health Board, asked Mott MacDonald to survey their estates and provide nature enhancement recommendations. This was a huge undertaking because, across the two organisations, there were 14 separate hospital sites, of different ages and sizes, ranging from vast general hospitals to small mental health facilities.
“ArcGIS Field Maps enabled us to collect consistent, geographically accurate data.”
Matthew Law, GIS Consultant, Mott MacDonald
The Solution
Mott MacDonald is an established and experienced user of Esri’s ArcGIS technology. It has a single, global ArcGIS platform, through which it makes advanced geospatial tools and data accessible to all of its global employees. Right from the outset, it was clear that ArcGIS would play a central role in the biodiversity project for Powys Teaching Health Board and Aneurin Bevan University Health Board.
First, Mott MacDonald created base maps for the project with Ordnance Survey MasterMap data. It used ArcGIS Pro and FME software, accessed via the ArcGIS Data Interoperability Suite, to carry out a pre-classification process and assign likely habitat types to each parcel of land, across the 14 sites, according to the UK Habitat Classification System.
These base maps, showing probable habitats, were then used as the foundation data layer in a mobile data collection app, built with ArcGIS Field Maps. Ecologists from Mott MacDonald’s Cardiff office used this solution to survey each of the 14 sites, verifying the habitat types, collecting evidence of species, recording locations for habitat improvements and taking photos. “The pre-classification process proved highly valuable as it meant that ecologists weren’t starting from scratch in the field,” explains Matthew Law, GIS Consultant, Mott MacDonald. “They could edit areas and amend habitat classifications but didn’t have to draw everything, which saved time and improved accuracy.”
Once every site had been surveyed, Mott MacDonald used ArcGIS Pro and FME as part of the process for creating 28 high-quality, map-based plans, two for each site, showing which habitats exist and opportunities for enhancements, such as hedgehog boxes and orchard restoration. The organisation used ArcGIS Pro to set up symbology and layout templates, to ensure consistency across all sites. The plans were then produced as hard copy, full-colour, A3 visuals, providing an attractive and easy-to-understand overview of the full ecology reports.
As an extension to the project, Mott MacDonald created a web map for one of the hospital boards, enabling it to explore its biodiversity data, add more data and make comparisons over time. Created with ArcGIS Online, this web app was made available to the hospital board using Esri’s AEC Project Delivery mechanism, a subscription service that enables professional service companies to share their internal GIS content securely with their clients.
“The project has been accomplished and delivered on time, on budget and above and beyond the expectations of the project brief.”
Anthony Fenn, Head of Technical Services, Powys Teaching Health Board
Benefits
Consistent, accurate survey method
ArcGIS Field Maps provided an effective way for ecologists to collect baseline habitat and biodiversity data in the field, while retaining the accurate geometry of features. At the same time, Mott MacDonald could ensure that the data was recorded in the same way, at every location. “ArcGIS Field Maps enabled us to collect consistent, geographically accurate data,” says Law. “This was especially important in a project of this size, in which we had to collect data in a standardised way across 14 sites.”
Fast, high-quality project delivery
Taking advantage of ArcGIS tools enabled Mott MacDonald to deliver this client project very efficiently and deliver the final reports and visualisations on schedule. In particular, the use of ArcGIS Pro helped to minimise post-survey data cleansing, and processes that could easily have taken days only took a few hours. Anthony Fenn, Head of Technical Services at Powys Teaching Health Board, testified that “The project has been accomplished and delivered on time, on budget and above and beyond the expectations of the project brief.”
Clear visualisations of biodiversity plans
Mott MacDonald was able to take advantage of the sophisticated cartography tools in ArcGIS to present fairly complex plans, incorporating maps, aerial imagery, text boxes and symbology, in a clear and attractive way. The organisation’s GIS team produced 28 plans of 14 sites in under a month, and Lorraine Woolley, Ecology Team Lead at Mott MacDonald, was delighted with the results. “We had a meeting with the clients and they were extremely excited about the plans, which are beautiful, engaging and informative,” she related.
Effective management of biodiversity improvements
The ArcGIS Online web app, developed for Powys Teaching Health Board, provides a platform that this client can use to manage biodiversity enhancements effectively. It can view, analyse and update the baseline biodiversity data collected by Mott MacDonald’s ecologists and explore the recommendations in the reports and plans in more detail. The health board can also add more information over time, to build up a record of how it is meeting the statutory regulations and achieving biodiversity improvement.
RSK Group
With an Enterprise Licence Agreement, we are expanding access to advanced GIS capabilities across more than 200 businesses and optimising our use of ArcGIS.
The integrated environmental, engineering and technical services group RSK is expanding its use of Esri’s ArcGIS system after taking the strategic decision to enter into an Enterprise Licence Agreement with Esri UK. Now, teams in around 200 businesses have the opportunity to use ArcGIS solutions to improve their business efficiency, collaborate effectively with stakeholders and identify opportunities for business growth.
Over 2000 ArcGIS licences are now shared between RSK companies through an Enterprise Licence Agreement
A centralised ArcGIS Online portal provides easy access to all of the group’s geospatial data and apps
Teams make extensive use of ArcGIS solutions and apps on the desktop, in the field and online
The Challenge
RSK Group is the driving force behind diverse global projects, across sectors including water, energy, food and drink, infrastructure, urban development, mining and waste. The group has grown through acquisitions and currently comprises more than 200 businesses, many of which use geographic information system (GIS) solutions routinely for collecting, analysing and sharing geospatial data.
An audit of GIS usage revealed that, within RSK, there were twelve separate licence agreements with Esri UK for Esri’s GIS software. In addition, across the group, RSK businesses were making use of a variety of GIS software solutions but wanted the opportunity to expand their use of GIS to improve their process efficiency. It became clear that there was an opportunity to centralise access to GIS services and data and, thereby, make more licences and capabilities available to more businesses within the group.
“The efficiencies we make with ArcGIS are helping to reduce survey times and the amount of post-processing required, allowing us to undertake projects of greater scope that otherwise may not have been possible.”
Anthony Jones, Principal GIS Consultant, RSK Group
The Solution
In place of the twelve separate licence agreements, RSK Group entered instead into an Enterprise Licence Agreement (ELA) with Esri UK. This strategic decision enabled RSK Group to make GIS services and solutions available to more teams throughout the organisation and opened up a plethora of new opportunities.
The ELA provided a catalyst for the creation of a centralised repository for geospatial data and apps in ArcGIS Online, known internally as RSK Atlas. “For the first time ever, we now have a central GIS hub that is available to everyone across the business and provides access to a growing amount of data and content,” says Anthony Jones, Principal GIS Consultant, RSK Group.
Within the group, many teams now use ArcGIS Online and ArcGIS Pro for data management, data analysis, data interpretation and data sharing. For example, ArcGIS Pro is used for interpolating survey data, producing visual impact assessments and mapping land use in agricultural land management.
In the field, several businesses rely on ArcGIS mobile solutions, including ArcGIS Survey123 and ArcGIS Field Maps, to collect data efficiently and accurately on everything from ecological surveys and landscape assessments to building structural surveys and social questionnaires. In social surveys across Europe, Africa and the Middle East, for example, ArcGIS Survey123 has been used to solicit the views and status of local communities about proposed developments.
ArcGIS Experience Builder is used extensively for building interactive web apps and websites for sharing project information with colleagues, clients and subcontractors. Indeed, RSK Group has developed literally thousands of web maps within its ArcGIS Online portal supporting hundreds of projects across the world. Such web apps provide a central “single source of truth” for projects that include a variety of stakeholders and can cover large geographical areas, making collaboration and coordination of project resources far easier.
Some teams have used ArcGIS Experience Builder and the ArcGIS StoryMaps app to create engaging stories for sharing information with the public and other stakeholders. ArcGIS Experience Builder has been used to support a variety of public consultations, allowing stakeholders to visualise proposed developments in the context of their own location and in some cases provide feedback via embedded forms.
“There is real potential to use ArcGIS more as a business development tool, rather than just as a project support tool.”
Anthony Jones, Principal GIS Consultant, RSK Group
Benefits
Wider access to advanced GIS tools
With its ELA providing more licences, RSK Group has been able to make the sophisticated functionality of ArcGIS available to more teams and businesses, throughout the group. “ArcGIS has become such an integral part of many of our processes that it is difficult to imagine how we could deliver our work these days without the tools that we have access to now,” comments Jones. “ArcGIS offers advanced functionality that allows our GIS professionals to develop bespoke tools and automate previously manual processes.”
Cost-efficient business processes
Those teams that have replaced paper-based data collection methods with ArcGIS mobile apps have significantly improved the efficiency of their processes. They no longer have to enter data manually or carry out lengthy data quality checks, saving hours of effort on every project. “The efficiencies we make with ArcGIS are helping to reduce survey times and the amount of post-processing required, allowing us to undertake projects of greater scope that otherwise may not have been possible,” Jones says.
Effective communication with stakeholders
ArcGIS supports effective communication with a wide range of stakeholders, by making complex project data easy to understand. ArcGIS can be used to facilitate collaboration between colleagues on multi-disciplinary projects, as well as improve engagement with the public and clients. In one recent initiative, RSK used ArcGIS Online to published a digital preliminary environmental information report summary, making it easier for people to explore information about the environment in the study area and see the significant effects in a geographical context.
Opportunities for business development
RSK Group now intends to make more strategic use of ArcGIS to help it grow and win more business. It is already using ArcGIS to gain a deeper understanding of projects at the tender stage, fine tune costings and prepare detailed, competitive bids. Next, it plans to use ArcGIS to improve understanding of where its specialist teams are located and where opportunities exist for new acquisitions or new project proposals. “There is real potential to use ArcGIS more as a business development tool, rather than just as a project support tool,” notes Jones. “There are so many possibilities for using ArcGIS throughout the group.”
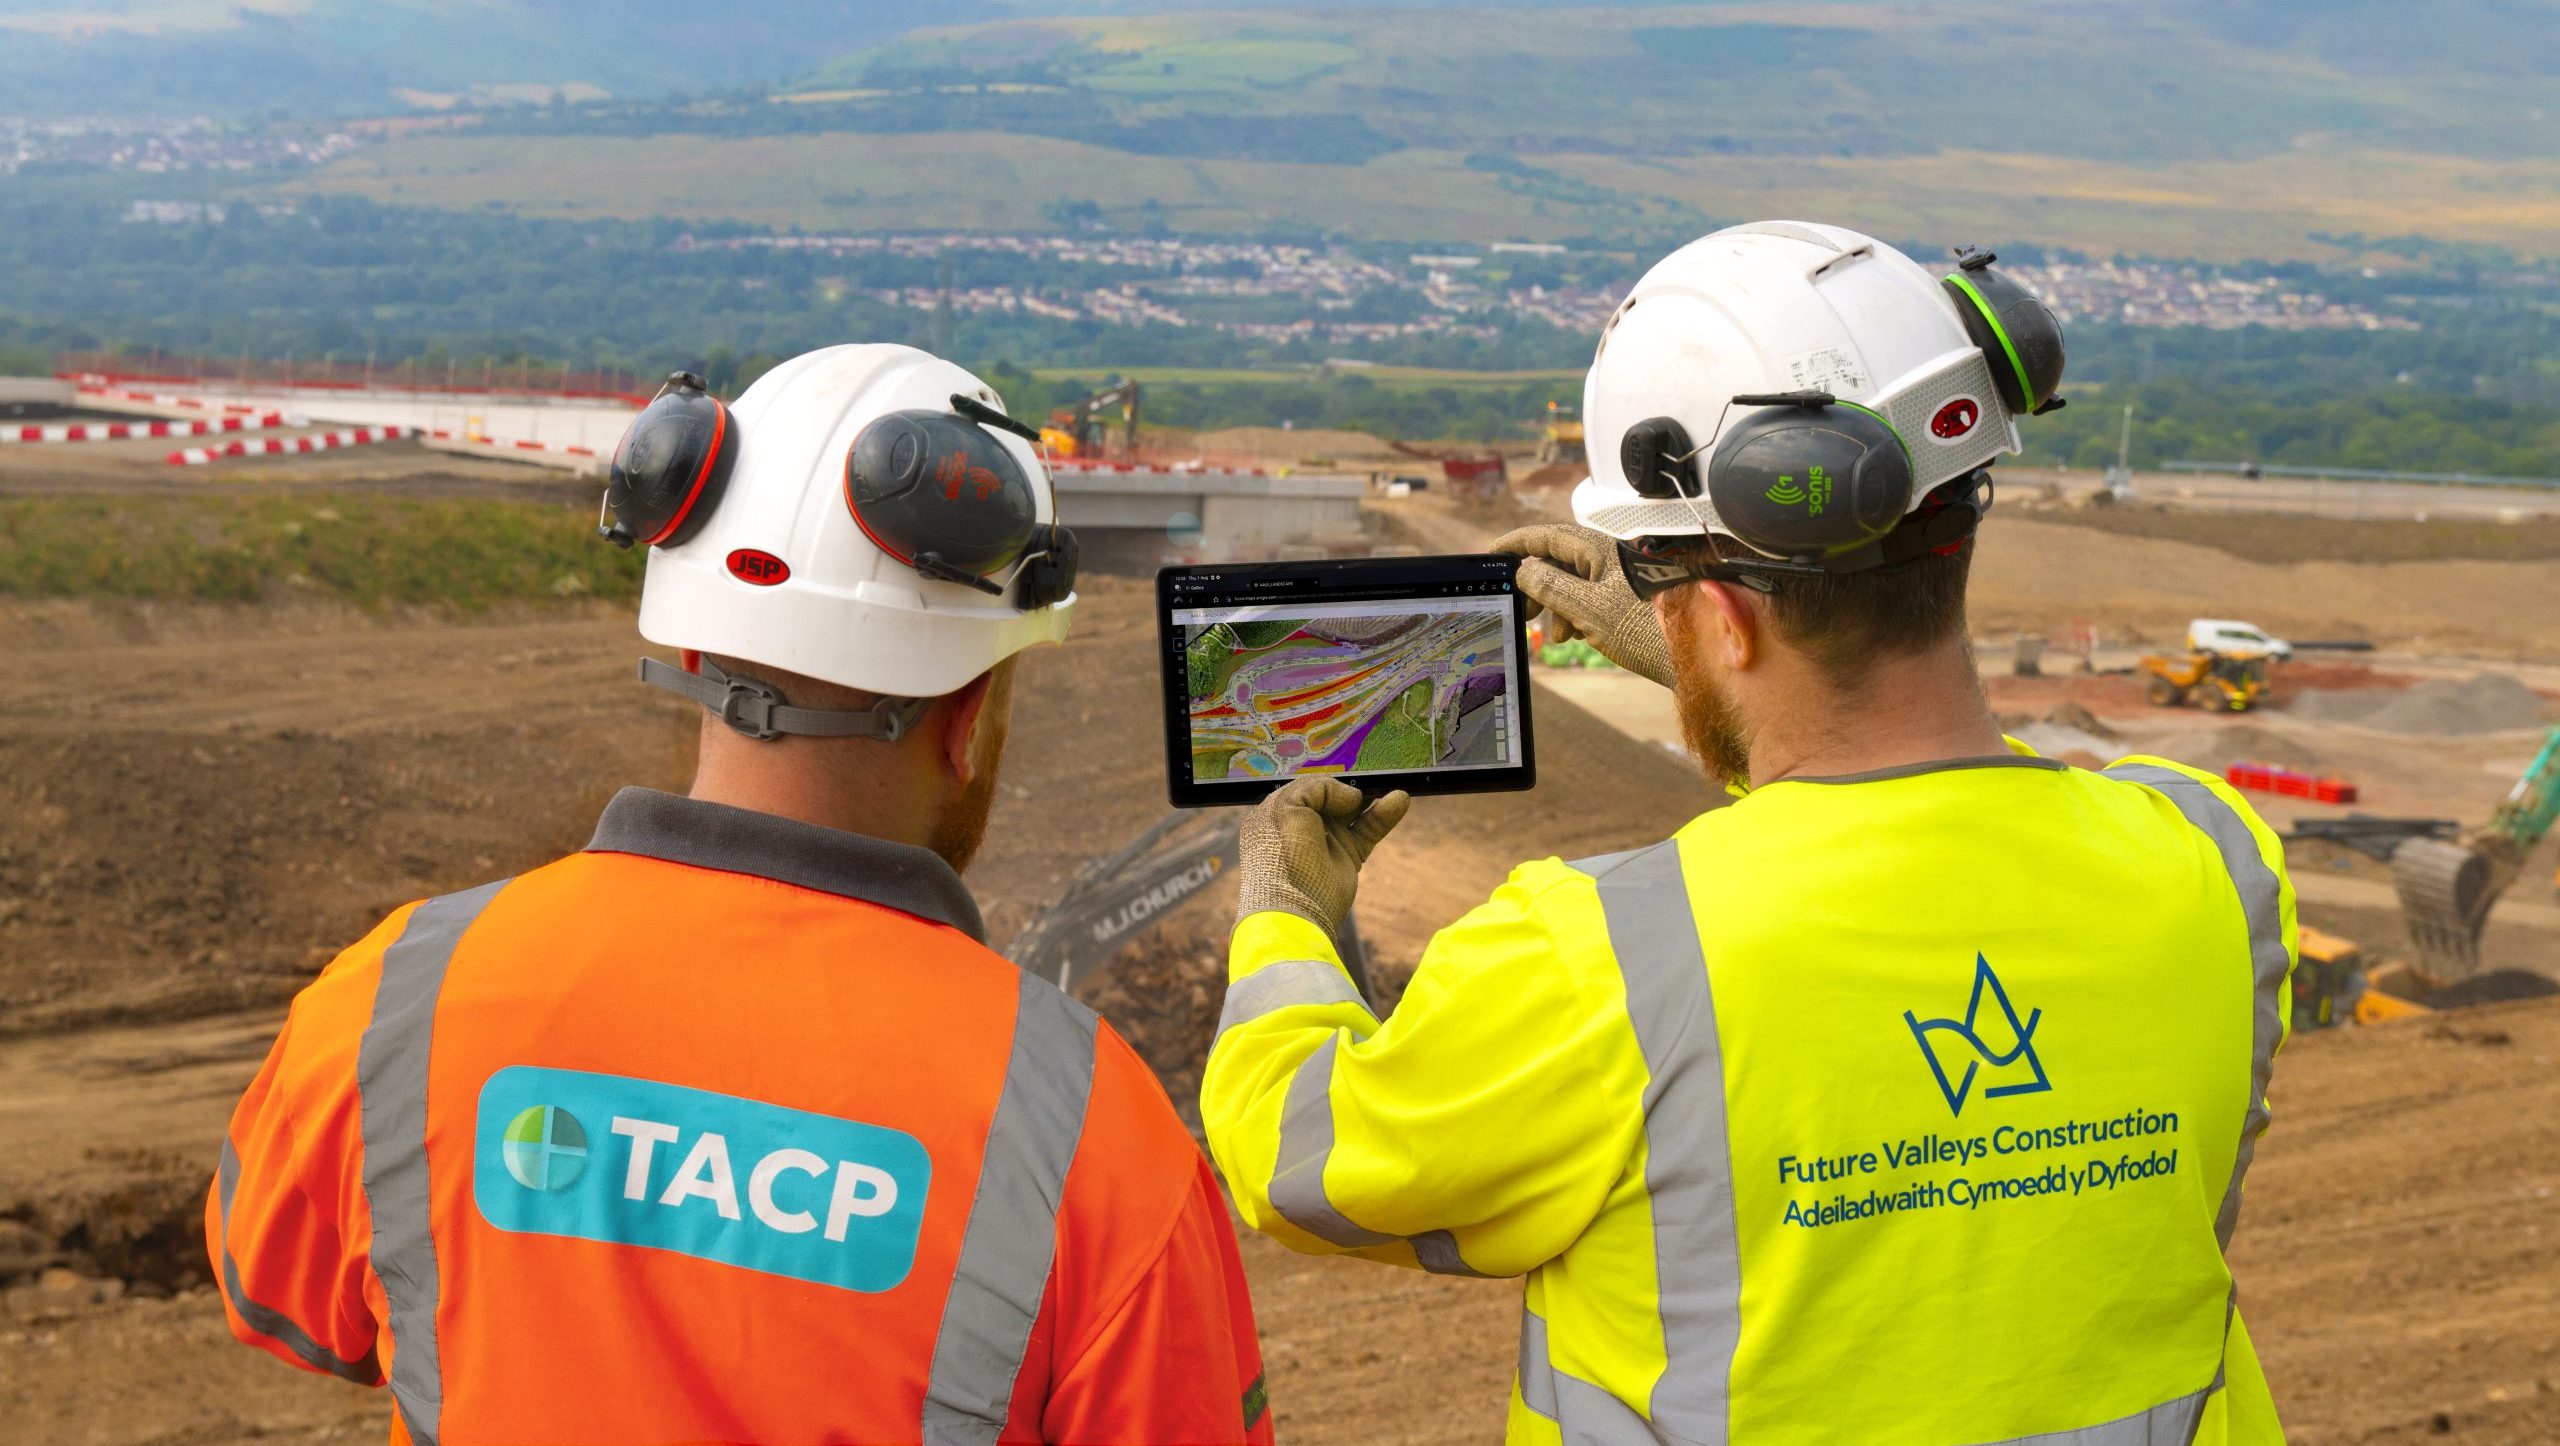
TACP
ArcGIS is embedded into everything we do and supports all aspects of our environmental projects.
The inter-disciplinary environmental consultancy TACP (UK) Ltd is using ArcGIS to improve efficiency throughout the full lifecycle of the projects it delivers, from the initial feasibility study and planning phases through outline and detailed design, construction and evaluation. Its end-to-end approach has delivered substantial cost and time savings and contributed to high quality project outcomes for clients.
Ecologists use ArcGIS mobile app to record environmental observations and conduct surveys in the field
Teams rely on ArcGIS web apps and dashboards to share information on large complex projects
Up-to-date project information is shared with clients, subcontractors and the general public with ArcGIS Online
The Challenge
Geospatial information plays a critical and central role in all the work that TACP does. Whether the organisation is designing nature-friendly urban centres, monitoring the environmental impacts of major construction projects, exploring cultural connections with the landscape or devising green infrastructure strategies, it needs to have an effective way to collect, visualise, analyse and share geospatial data throughout its projects.
“With its wealth of apps, tools and capabilities, ArcGIS now supports the entire lifecycle of our projects, from initial strategy to construction, aftercare and evaluation.”
Tim Wroblewski, Associate Director, TACP
The Solution
In 2015, TACP migrated from legacy and open source geographic information system (GIS) products to Esri’s ArcGIS suite of solutions. “ArcGIS provided the complete holistic package,” recalls Tim Wroblewski, Associate Director at TACP. “With its wealth of apps, tools and capabilities, ArcGIS now supports the entire lifecycle of our projects, from initial strategy to construction, aftercare and evaluation.”
Ecologists use mobile apps including ArcGIS Sweet, ArcGIS Survey123, ArcGIS QuickCapture and ArcGIS Field Maps to record environmental observations and conduct surveys in the field. Teams collect data in a consistent and time-efficient way for a wide range of activities from bat and dormouse sightings to the brightness of lights at night and the potential visual impacts of new developments on landscape and residential views.
Using ArcGIS Online and ArcGIS Experience Builder, TACP has created a wide range of web apps that give project teams, clients and contractors instant access to project data, whether they are working in the office, at home or on a site. During the landscape monitoring phase of a project, landscape architects use ArcGIS Field Maps on site to identify their location and associated landscape plot, input data on the success of planting and seeding, and confirm requirements for maintenance and plant replacement.
TACP makes extensive use of ArcGIS Online for visualising data and sharing information with stakeholders, including clients, subcontractors and the public. It has created several operational dashboards, using the ArcGIS Dashboards tool, which are especially useful in the construction phases of projects for keeping contractors aware of environmental constraints, such as the locations of badger setts and environmental incidents that require contractor attention.
Teams throughout the organisation use ArcGIS Pro to conduct detailed spatial analysis of proprietary, open and third party data. For instance, they can identify hot spots of reptile activity and create buffer zones around ponds occupied by protected great crested newts. TACP has also used ArcGIS Pro to analyse and prepare inputs and updates for LANDMAP, a nationally consistent landscape baseline for Wales, managed by Natural Resources Wales.
TACP appreciates how well ArcGIS integrates with other third party software, including computer-aided design (CAD) packages and process automation software. This has enabled the organisation to create highly efficient workflows for escalating health and safety concerns, and it has recently developed a robust permit-to-work system that is being used on the Banwell Bypass project in North Somerset to enhance environmental compliance.
“The ArcGIS outputs were graphically engaging and provided a clear direction to identify optimal land use.”
Zoe Maddocks Dodson, GIS Analyst, TACP
Benefits
Significant improvement in operational efficiency
Since the migration to ArcGIS, TACP has witnessed a significant improvement in the efficiency of its data collection processes, including habitat surveys. Teams no longer have to type up hand-written notes, degraded by the weather, and the data collected can be mapped in minutes. “We save hours of time for each project helping ensure that projects are delivered to time and under budget,” says Wroblewski.
Time- and cost-effective service for clients
TACP is confident that its operational efficiencies are contributing to cost savings, enabling it to offer a more time- and cost-effective service to its clients. For instance, for the A487 Caernarfon to Bontnewydd Bypass project, TACP’s subcontractors used to conduct bat surveys on paper. By using ArcGIS Survey123 and ArcGIS Quick Capture, and providing licences to its subconsultants, TACP has enabled bat surveys to be conducted and processed more time efficiently and cost effectively.
Well-informed project proposals
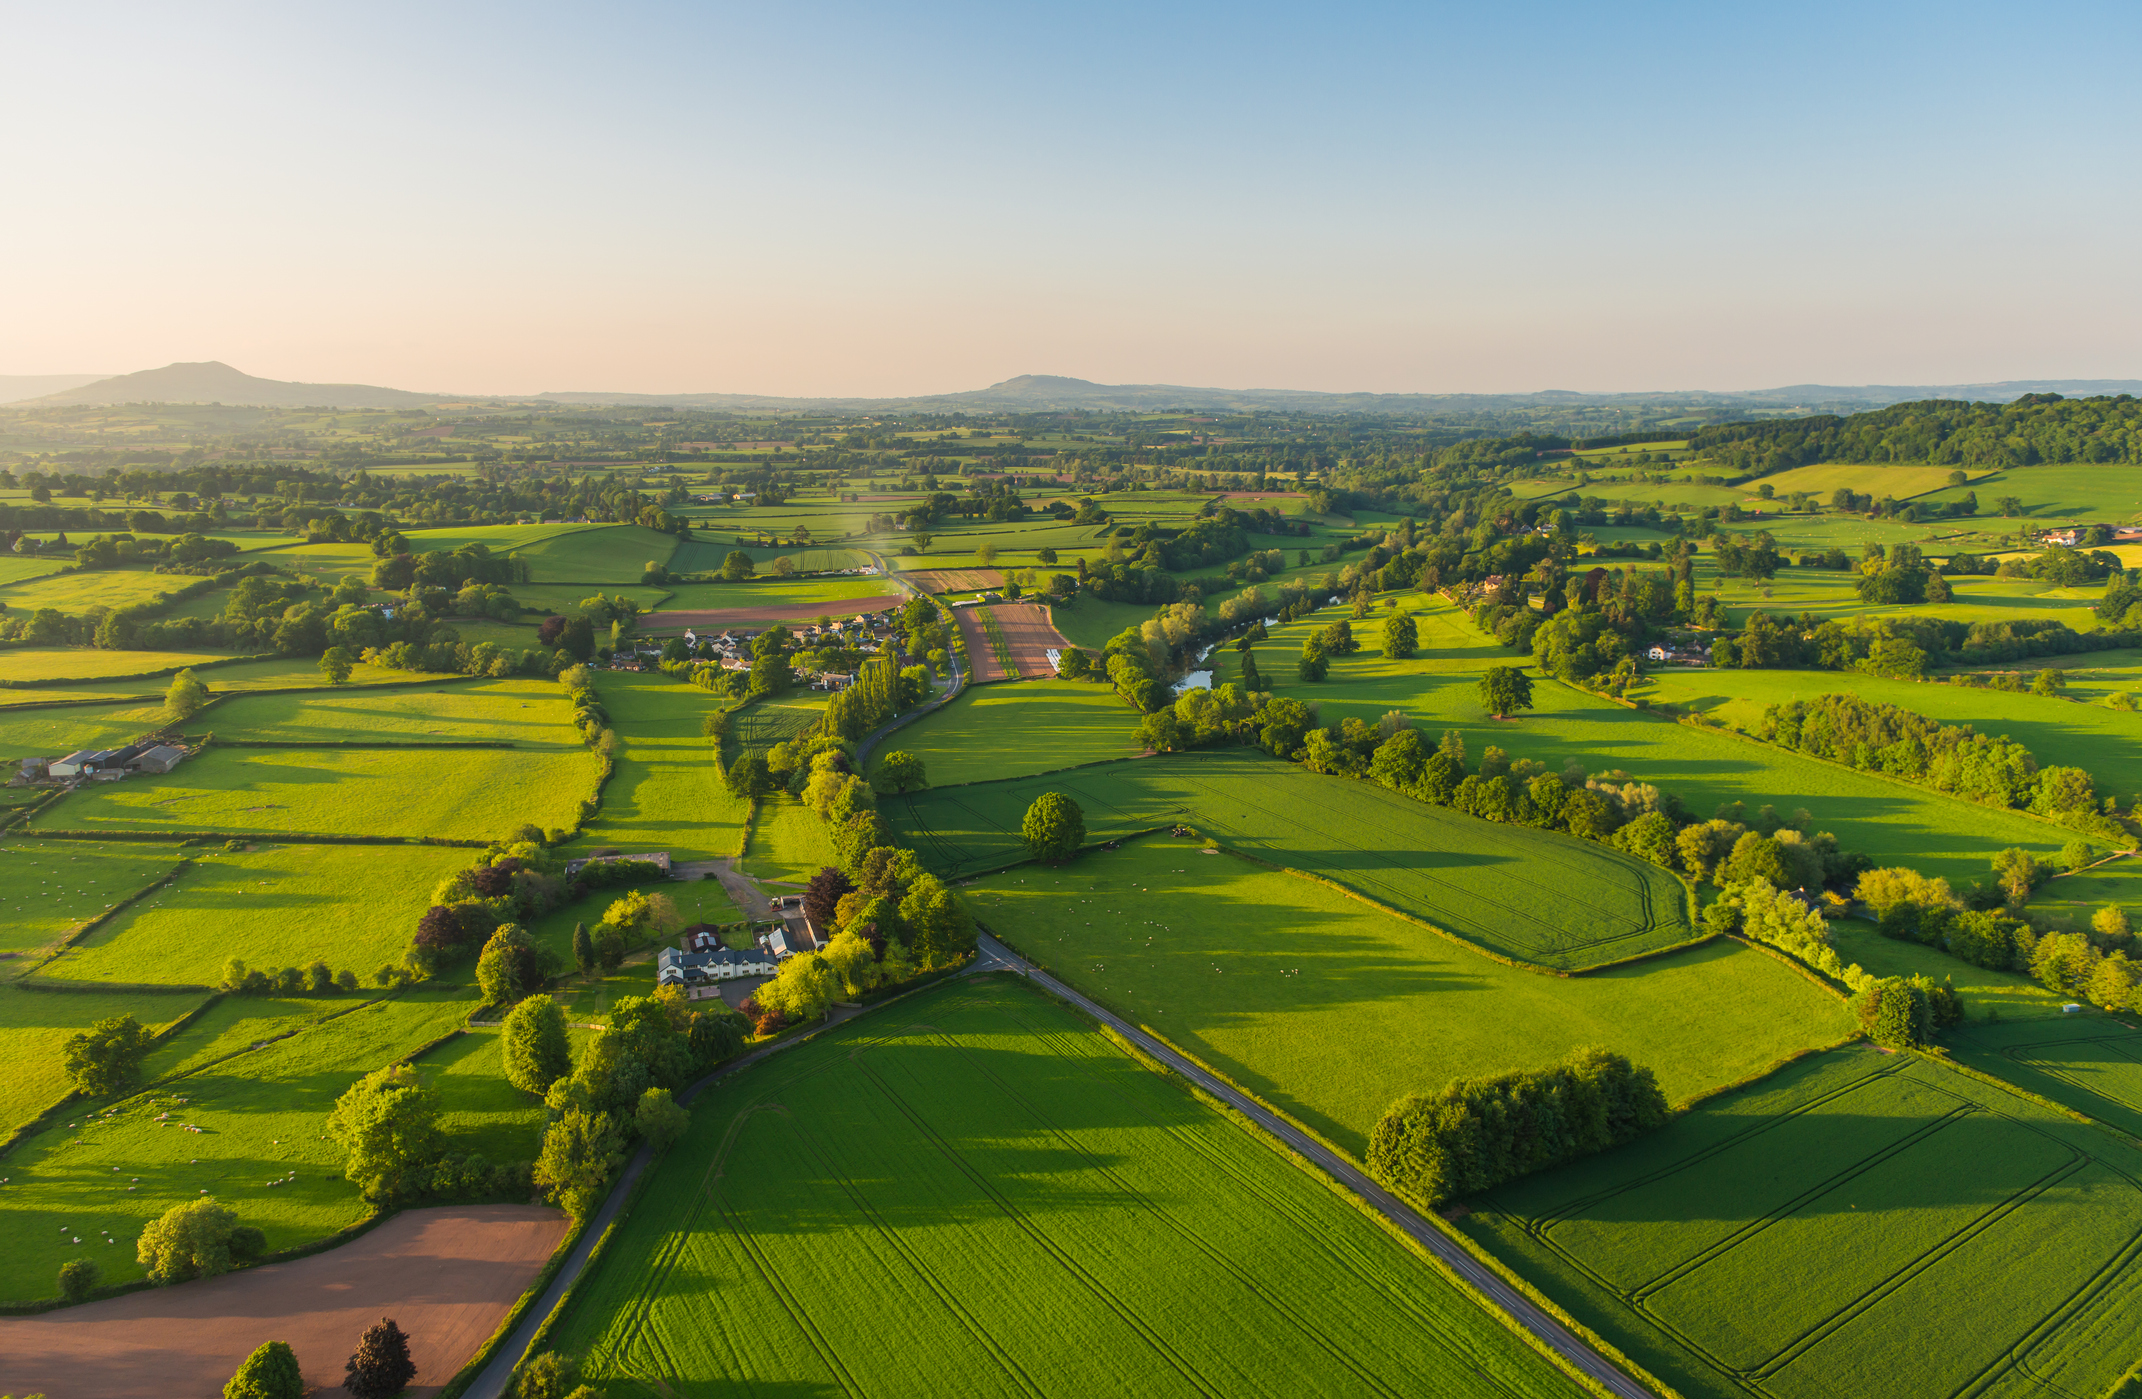
TACP relies on ArcGIS Pro to help it analyse data and put forward well-informed, statistically-accurate project proposals. In a recent project, the organisation used ArcGIS Pro to undertake multi-criteria analysis and objectively weight opportunities for woodland planting, solar and wind developments in the Marches region (Herefordshire, Shropshire, Telford and Wrekin). “The ArcGIS outputs were graphically engaging and provided a clear direction to identify optimal land use,” says Zoë Maddocks-Dodson, GIS Analyst at TACP.
Effective collaboration and data sharing
Through the use of ArcGIS web apps, TACP’s employees, subcontractors and partners have access to all the data they need to do their work, whenever they need it. In the A465 Section 5 and 6 project, for instance, TACP is one of nine contractors who share project information via an ArcGIS-based project portal created by the principal contractor and TACP’s client, FCC Construcción. As Juan Ramon Mena from FCC Construcción says, “Collaborating with TACP via the ArcGIS platform has helped all stakeholders work towards meeting project programme and budgets.”
Clearer understanding of local issues
Using ArcGIS Online and ArcGIS StoryMaps, TACP can present information clearly to stakeholders, such as local residents and community groups, helping them to understand environmental or local issues that impact them. For a Welsh language and landscape initiative in South East Wales, TACP created a story map to engage a group of local people in a discussion about how local place names were being lost. “The story map was a great way of connecting people with the local, physical and cultural landscape,” says Harri Evans from TACP’s client, Merthyr Tydfil County Borough Council.
Royal Commission on the Ancient and Historical Monuments of Wales
We are providing insight into 400 years of landscape change by bringing ancient maps back to life in ArcGIS
The Royal Commission on the Ancient and Historical Monuments of Wales is using ArcGIS to digitise, enrich and share maps showing 400 years of Welsh history. This ambitious project is bringing almost-forgotten historical maps back to life, shedding new insight into centuries of landscape change and renewing interest in local history.
Ancient maps from 1620 to 1874 digitised, georeferenced and overlaid on modern maps using ArcGIS Pro
A free-to-use Deep Mapping app built with ArcGIS Online, giving open access to historical maps
35,000 new polygons created, enabling historical landscape features to be analysed geospatially
The Challenge
It has been estimated that there are over 50,000 carefully preserved paper maps still in existence, showing the estates, townships and parishes of Wales as they looked in the 17th to 19th centuries. These precious historical documents are dispersed across national archives, regional museums and private estates all around the world, making them not only hard to access, but also unknown to most people who have an interest in Welsh history.
The Royal Commission on the Ancient and Historical Monuments of Wales (RCAHMW) or Comisiwn Brenhinol Henebion Cymru in Welsh, in conjunction with Bangor University, wanted to find a way to collate these invaluable ancient maps of Wales and make them accessible to everyone. Rather than simply scanning each map and creating a database of digital copies, however, the organisation wanted to knit them all together and overlay them onto modern day mapping to help people see and understand land changes over centuries.
“ArcGIS Pro has enabled RCAHMW to take the accuracy of today and apply it to the past.”
Jon Dollery, Mapping Officer, RCAHMW
The Solution
Initially, RCAHMW focused on six parishes in North East Wales and assembled maps from dozens of sources, including the Duke of Westminster’s Grosvenor Estate. These ancient maps included tithe maps, originally commissioned to support the collection of taxation between 1836 and 1860, as well as enclosure maps from 1800 to 1830, drawn up at the start of the industrial revolution in Wales. Looking further back in time, the project team compiled hand-drawn estate maps from the early 1700s, and some even older old estate maps dating from 1620, decades before the English Civil Wars.
RCAHMW digitised these old maps, along with the earliest Ordnance Survey maps, created in three scales between 1869 and 1874. It used ArcGIS Pro to geographically align all these historic resources with modern mapping. This was achieved by creating as many as 500 control points, such as the corners of fields, which are unlikely to have changed much over time. The organisation then used the spline feature in ArcGIS Pro to gently adjust the hand drawn lines and features from the ancient maps until they lined up with the same features in the most up-to-date geographical surveys.
As part of this georeferencing process, RCAHMW vectorised 35,000 individual polygons (such as fields and rivers) over an area of 125 km2. It also captured supplementary information from the ancient paper maps that may have been forgotten over time, such as the names of landowners, commonly used field names, tenants, land use, the extent of common areas, township boundaries and the usage of estate buildings.
Next RCAHMW created a web app in ArcGIS Online, called Deep Mapping Estate Archives, that allows people to explore the maps through the ages and carry out geospatial analysis. Users can compare landscapes at different points in history and click on any location to open a pop-up box and discover who the landowners or tenants were hundreds of years ago, for example. The web app is presented in a Deep Mapping website, originally created with ArcGIS Web App Builder and recently updated to ArcGIS Experience Builder, that presents information about the project bilingually in English and Welsh. Some of the maps are also available to be viewed in 3D, utilising ArcGIS Web Scene.
“Maps that were locked away in archives around the country are now in one place, where everyone can find and enjoy them.”
Jon Dollery, Mapping Officer, RCAHMW
Benefits
Modern-day accuracy applied to ancient maps
Through this project, RCAHMW has demonstrated how ArcGIS Pro can be used to effectively capture, geo-reference and vectorise ancient maps. The organisation has transformed historic documents with variable quality into a geographically-accurate, modern-day digital atlas. Recognising this, Jon Dollery, Mapping Officer at RCAHMW, observes, “ArcGIS Pro has enabled RCAHMW to take the accuracy of today and apply it to the past.”
Easy access to rare archived records for everyone
By creating a Deep Mapping app with ArcGIS Experience Builder in ArcGIS Online, RCAHMW has achieved its goal of making exceptionally rare, archived, paper maps accessible to everyone. Free to use, the app is already igniting the interest of members of the public, local historians, educators, academics, social history researchers, local developers and environmental consultants. “Maps that were locked away in archives around the country are now in one place, where everyone can find and enjoy them,” Dollery says.
Greater insight into 400 years of landscape change
By enabling historic maps to be analysed and compared with modern maps, the Deep Mapping app reveals 400 years of landscape changes in Wales that were previously unknown or unrecorded. It is possible to see, for example, where hedgerows have been lost and how river courses have moved over time. RCAHMW anticipates that this insight will be used by developers, environmental consultants and local councils to inform development and conservation initiatives, such reinstating woodland in places where it used to exist.
A deeper appreciation of local history
The Deep Mapping app has received enthusiastic feedback from the residents North East Wales who are fascinated to learn more about their villages and towns. People are using it to see who common land was awarded to 300 years ago, learn where medieval strip farming took place, rediscover lost place names, explore historic estates and gain a deeper appreciation of their local areas. As Dollery concludes with pride, “This initiative really is stimulating interest in local history, and we look forward to expanding it to cover the whole of Wales.”

Scottish Fire & Rescue
With an ArcGIS-based risk model, we can be better prepared for emergencies right across Scotland.
The Scottish Fire and Rescue Service (SFRS) responds to fires and other emergencies across a vast and diverse terrain. It has used ArcGIS to analyse, measure and compare risk levels throughout Scotland and is now using an advanced risk model to help it better protect communities.
A decade of incident data was analysed alongside socio-economic and environmental indicators in ArcGIS Pro
A state-of-the-art risk model was built and statistically verified using ArcGIS Pro and machine learning
Senior officers query the risk model using highly visual and easy-to-use ArcGIS Dashboards and ArcGIS web apps
The Challenge
SFRS operates across an area of 79,900 km2 and responds to emergencies in large cities as well as on busy motorways, remote villages, narrow mountain passes and inhabited islands. Given the diverse geography of Scotland, the risks from fire, traffic accidents, flooding and other incidents varies enormously from one location to another. SFRS wanted to find a way to measure and compare risk levels in every community to give it a better understanding of how to optimally allocate its resources.
“This project was the ideal opportunity to show what ArcGIS could really deliver.”
Damien Griffith, Community Risk Manager, Scottish Fire & Rescue Service
The Solution
Identifying that a spatial approach would be needed to address this challenge, SFRS decided to make better use of Esri’s geographic information system (GIS) technology. The organisation already had ArcGIS licenses but had not been making full use of the product’s capabilities. “We effectively had a Formula One racing car in the garage, but no-one was really putting it to the test,” says Damien Griffith, Community Risk Manager at SFRS. “This project was the ideal opportunity to show what ArcGIS could really deliver.”
SFRS started by mapping historic fires and emergencies over the previous ten years in ArcGIS Pro and ranking them from higher priority (e.g. dwelling fires) to lower priority (e.g. animal assistance). It organised this incident data by local area, using Scotland’s 6,976 data zones, adding supplementary data on socio-economic indicators, including the Scottish Index of Multiple Deprivation and household profiles from Acorn. It then tested relationships between variables using two regression models within a customised R script to generate a risk metric value for each of the 6,976 areas, forming the baseline Community Risk Index Model (CRIM©).
With assistance from Sweco, a leading European engineering and environment consultancy, SFRS then enhanced CRIM© by incorporating natural and built environment risk factors, including data on flooding, built-up areas, road networks, land use, buildings and addresses across Scotland. At various stages during the project, SFRS also engaged statisticians from the University of Nottingham and the University of Edinburgh to validate the risk calculations and provide statistical proofing using machine learning algorithms.
Using the risk intelligence derived from the enhanced model, SFRS created an interactive ArcGIS Dashboard that allows senior officers to zoom into any area of the country and see colour-coded risk levels. SFRS and Sweco also developed dedicated ArcGIS Dashboards for the flood and built environment risks, as well as a compelling ArcGIS Experience Builder web app that captures Scotland’s 3.8 million individual buildings in 3D, colour-coded according to risk level. With these intuitive online solutions, senior officers can view the risk profiles of communities, pinpoint high-risk buildings in context and run fly-throughs to identify where risks are greatest.
“We cannot predict where the next fire will be, but we can use the digital portfolio of meaningful risk data that we now hold to focus on more vulnerable communities and become better prepared for the future.”
Damien Griffith, Community Risk Manager, Scottish Fire & Rescue Service
Benefits
Deeper understanding of risk across diverse communities
Through the use of ArcGIS, SFRS now has a deeper understanding of risk across the different urban, suburban, rural and island communities of Scotland. It can see patterns and relationships between areas and clearly identify buildings with large numbers of residents, including multi-storey buildings, while using these insights to be better prepared in the event of an emergency. Griffith comments, “We cannot predict where the next fire will be, but we can use the digital portfolio of meaningful risk data that we now hold to focus on more vulnerable communities and become better prepared for the future.”
Precisely targeted fire prevention activities
SFRS is now using its ArcGIS-based risk model to carry out targeted interventions as part of its prevention work, to keep communities safe from the risk of fire and other hazards. For example, Operational Intelligence teams use the built environment web apps to identify high risk buildings and organise risk assessment visits. In the lead up to the United Nations’ COP26 Conference in Glasgow, SFRS used the risk model to assess the risk profiles of properties within a mile of key venues and put effective mitigation plans in place for any high-profiled event.
Well-informed, strategic resource deployment decisions
The ArcGIS-based risk model is currently being used by SFRS to help inform its Strategic Service Review. Senior officers can use the ArcGIS web apps and dashboards to investigate alternative operational asset configurations and align services and resources with the geographical risk levels identified by the risk model. For instance, the service is ensuring that its high-reach appliances are based in the higher-risk locations with the largest concentration of high-rise buildings, where they are most likely to be needed. “It is well-informed decisions like this that help to make communities safer,” Griffith says.
Increased public awareness of fire risks
SFRS plans to continue to develop its risk model in ArcGIS by, for example, adding data on anonymised population health and wildfire risk locations. SFRS will also consider making a dedicated ArcGIS web app publicly available, to enable property owners to check the risk rating for their own properties and encourage them to take precautions to reduce the risk. “There is huge potential to use ArcGIS to increase public awareness of fire risks,” comments Griffith. “This risk model project has so many possible offshoot benefits for other parts of the service, as well as for protection, prevention and preparedness measures.”

Crimestoppers
Crimestoppers provides police forces with exclusive information and ArcGIS Dashboards plays a vital role in sharing this accurate and insightful data, driving more impactful local crime prevention campaigns.
The charity Crimestoppers works closely with police forces and Police and Crime Commissioners across the UK to share and evaluate information about crimes reported anonymously by the public. Its National and Regional Managers now have access to a self-service portal powered by ArcGIS Dashboards, allowing them to more efficiently report on and review local crime trends, supporting their ongoing engagements with PCCs and police forces.
Users now self-serve data from one intuitive screen and produce more accurate reports, more quickly than ever before
Location-specific searches with local crime trend filters provide information needed to support hyper-local crime prevention campaigns
The new system was rapidly configured by non-GIS experts and in-use after only one training session for intended users
The Challenge
Crimestoppers provides a service for people to pass on what they know about crime whilst staying completely anonymous. Each year, over 200,000 reports are shared with local police forces, supplying crucial information that aids investigations, arrests and prosecutions.
The responsibility for reaching vital communities who may need the Crimestoppers’ service lies with the charity’s 14 National and Regional Managers, who work across the United Kingdom. They liaise with their respective Police and Crime Commissioners (PCCs) and forces to understand strategic policing priorities and jointly develop local campaigns aimed at encouraging the public to share tip-offs anonymously.
However, the reporting mechanism used by the Managers was too time-consuming. Each report naturally includes a location element, yet the system lacked postcode or spatial data fields to provide the correct geographic visual context to a report. As a result, consolidating reports often took weeks and there became a pressing need for automated geographic filtering and enrichment to more effectively communicate local issues, trends and patterns.
“Our Regional Managers simply needed better tools to help them do their jobs,” said Crimestoppers’ Chief of Staff, Karen Ogborn. “We also sought the ability to more easily demonstrate to PCCs and forces the impact of Crimestoppers’ work on the communities they serve and to uncover previously undetectable patterns of crime.”
“Our Regional Managers can now speak about their data with a new confidence. They can get more projects off the ground, provide better support to Crimestoppers’ partners and work in the communities which need our support the most.”
Karen Ogborn, Chief of Staff, Crimestoppers
The Solution
Esri has been collaborating with Crimestoppers since 2011, with ArcGIS Online enabling call handlers to geo-locate calls from the public about criminal activity. In early 2024, Crimestoppers partnered with Kalago Digital to make updates to their ‘Self-Service’ portal, a tool being used by Crimestoppers Regional Managers to analyse and report on disseminated crime information. During the redevelopment of the portal, Kalago recognised, in conjunction with Esri, that ArcGIS Dashboards could play a crucial role in sharing spatial information.
Despite having no prior GIS experience, the Kalago team quickly and easily configured ArcGIS Dashboards, tailoring the information to meet the specific requirements of the National and Regional Managers, with only light-touch contact from Esri UK. Incoming reports are now automatically updated and integrated into the system, giving Managers access to virtually real-time data. Having this information at their fingertips makes them more responsive, giving them time to analyse the data and identify trends, rather than merely respond to queries and generate data-heavy reports.
The feedback has been overwhelmingly positive. One Regional Manager shared, “I’ve already made use of it today! I had to send some information on the number of hate crime reports to a local council, and it’s already done. It’s so easy to use and I feel really confident that the data it provides is accurate.”
“We are significantly expanding the number of reports we share with the police and, by using dashboard reporting, we can deliver accurate, essential data that will inform and shape more effective crime prevention strategies.”
Mick Duthie, Director of Operations, Crimestoppers
Benefits
Accelerated responsiveness
Only one internal training session was needed to get the National and Regional Managers up-to-speed on how to use this intuitive, self-service reporting portal. Managers can now self-serve and view data through intuitive maps, bar-charts and different filters giving them the means to produce reports and insight more quickly than ever as well as respond to incoming enquiries.
Improved resource management
As Managers become more efficient with self-serve ArcGIS Dashboards, they can dedicate more time to developing hyper-local campaigns tailored to specific PCC requests. Additionally, Crimestoppers’ former gatekeeper for data requests can now use their time far more productively and do more with their role, such as contributing to the executive management team by providing new insights that drive strategic and operational decision-making.
Rapid configuration
The Kalago team was able to set up the new ArcGIS Dashboards within a matter of days despite having no GIS experience. The interface was simple to edit so the Regional Managers have all the information they need, at a glance, on a single screen. Data is automatically updated daily, providing users with near real-time information thereby optimising the accuracy of data and reporting.
Supporting better crime prevention
With the new geographically based dashboards, Regional Managers can instantly run specific location searches and filter results based on reported crimes, ranging from incidents like romance fraud to shoplifting. PCCs now have faster access to these insightful reports and can collaborate promptly with their Crimestoppers’ Regional Manager to develop and implement hyper-local crime prevention strategies and campaigns.

NatureScot
With funding from the Scottish Government, we have created a toolkit of digital solutions to help pupils learn about biodiversity and climate change and take positive action to improve their school grounds for nature.
Working on behalf of the Scottish Government, NatureScot has delivered a toolkit of digital solutions that will support teachers to deliver the national ‘Learning for Sustainability’ curriculum in Scotland. Built by Esri UK’s Professional Services team, the six apps in the toolkit will help connect children with nature, improve the biodiversity of school grounds and equip young people with new digital skills for life.
Pupils use ArcGIS mobile apps in their school grounds to record habitats and sustainability features and monitor change
Teachers have easy-to-use ArcGIS web apps and dashboards for encouraging classroom discussion and planning positive changes for nature
Around 2,500 schools across Scotland will have access to the toolkit via an ArcGIS Hub Premium site
The Challenge
Sustainability lies at the very centre of the Scottish education system. Ever since 2012, the Scottish Government has had an innovative ‘Learning for Sustainability’ curriculum, but it wanted to provide teachers with new digital tools that they could use to help them embed sustainability into their lessons. It approached Scotland’s nature agency, NatureScot, and asked it to provide a toolkit of apps and other digital solutions that could be used at around 2,500 primary, secondary and special schools in Scotland.
The project aimed to build on the concept of the National Education Nature Park initiative in England and help schools record and improve biodiversity in their school grounds. Yet it also aimed to promote sustainability, encourage learning outdoors in local greenspaces and help young people develop the digital skills that they will need in their future careers.
“The ArcGIS Nature Discovery Map Scotland toolkit will help us to engage and empower school children to make a difference.”
Sue Munro, Greenspaces Officer, NatureScot
The Solution
NatureScot co-designed the toolkit in tandem with teachers across Scotland during a pilot and identified features that teachers specifically wanted, such as the ability to print maps. Esri UK’s Professional Services team then built the toolkit, working closely with NatureScot and harnessing the capabilities of Esri’s ArcGIS system to deliver precisely the capabilities needed, in easy-to-use, intuitive tools.
Named Nature Discovery Map Scotland, the toolkit includes a Nature Mapper web app, built with ArcGIS Experience Builder, that allows teachers to zoom into their school, explore data on landcover and habitat type and annotate and print the map if required.
There are two mobile apps for pupils to use, the Discoverer App for early stage users, created with ArcGIS QuickCapture, and the Explorer App for older stage users, created with ArcGIS Survey123. These mobile solutions enable pupils with different ability levels to capture data outside on all kinds of biodiversity and sustainability features including hedgerows, trees, long grass, solar panels, compost bins and ‘wee habitats’ like bird boxes and bug hotels.
Another web app for teachers, called Mark It, allows teachers to verify the data collected by pupils before it is published to the maps. There are then two dashboards, built with ArcGIS Dashboards, that allow classes to view changes in the biodiversity of their schools over time, as well as compare their school to other schools in different locations nationwide.
Teachers can access some elements of the toolkit without registering. To upload data, teachers log into a secure area of the website or ‘hub’, built with ArcGIS Hub Premium. The hub also contains a collection of resources, created with the ArcGIS StoryMaps app builder, that clearly explain the tools available and show how schools can use them as part of a circular approach of looking, discovering, planning and acting.
“With our ArcGIS-based toolkit, we are upskilling the next generation and giving them the digital skills to help address the biodiversity and climate challenges that they have inherited.”
Sue Munro, Greenspaces Officer, NatureScot
Benefits
Effective delivery of sustainability curriculum
The ArcGIS-based toolkit gets children learning outside, a key element of the ‘Learning for Sustainability’ curriculum in Scotland. As it focuses pupils’ attention on everything from insect habitats to bicycle racks, it effectively combines education on biodiversity and climate change action in one toolkit. “The Nature Discovery Map Scotland toolkit contextualises learning,” explains Sue Munro, Greenspaces Officer at NatureScot. “There is no more powerful way to get pupils to understand a concept like biodiversity loss than to get them to actually step outside and look at it.”
Improved biodiversity on school grounds
The availability of the new toolkit empowers primary and secondary schools, as well as special schools, to look at their school estates, really understand what biodiversity exists and how to take steps to improve it. In particular, the toolkit encourages teachers and pupils to consider ‘Could we improve this for nature?’ and focuses attention on where there is opportunity to make positive change. “The ArcGIS Nature Discovery Map Scotland toolkit will help us to engage and empower school children to make a difference,” Munro ascerts. “They can capture photographs to monitor change over time and see the impact that they are having on the quality of their natural habitats.”
Thriving nature networks across Scotland
The Nature Discovery Map Scotland toolkit helps pupils to understand the vital role that school grounds can play as stepping stones for nature. By exploring the web apps and dashboards, they can see the habitats that surround their schools. They can then understand how their schools form part of wildlife corridors and use the toolkit beyond their school grounds to map, for example, local tree planting projects. “Schools can play a part in helping to build thriving nature networks across Scotland and take pride in the positive impact they are having within their wider community,” comments Munro.
Improve digital literacy in young people
Pupils will gain experience of using industry-standard digital data capture tools, interactive web maps and dashboards. They will, therefore, become familiar with geographic information system (GIS) technologies at an early age and gain the confidence and skills to use GIS in their future careers. “With our ArcGIS-based toolkit, we are upskilling the next generation and giving them the digital skills to help address the biodiversity and climate challenges that they have inherited,” Munro says. “The Nature Discovery Map Scotland toolkit will help to connect young people to nature, encourage them to value nature and give them the skills to look after nature.”