Feature reports
Feature Reports is one of the new capabilities of Survey123 that came to life recently. It allows you to generate high-quality printable documents out of submitted surveys. This is very useful when you need to present your Survey123 data in a pre-defined format or layout. Unlike the summary report capability (Overview and Analyse tabs in the Survey123 website) that aggregates data across multiple surveys, Feature Report presents data from a single survey record. Say for example you use Survey123 to support asset inspections and you want to generate one document for each inspection performed.
Configuring feature reports is quite simple:
-
Configure the look and feel of your report template using Microsoft Word. You can set a header and footer, define font formatting, and customise the way you want it to look.
-
Include keywords referencing survey questions you want to be in your report. These keywords will be replaced with the data from the survey. You can write these keywords using feature report syntax which also allows you to customise them and do other more interesting things. Learn more about feature report syntax in this blog.
-
Associate your report template with your survey. You can do that simply by uploading your Microsoft Word document to the Survey123 website. Note that you can associate more than one report template with a survey.
-
Finally, start generating reports right from within the Survey123 website. By clicking the Generate button, a Microsoft Word document will be created and saved in your own content. You can download the report straight from your browser. To create more than one report at a time, select multiple records manually or by applying a filter to your Survey123 data.
The feature report functionality can be triggered from the data tab of the Survey123 website as shown above.
Survey123 feature reports are generated through an ArcGIS Online premium service and consume ArcGIS Online credits at a rate of 2.5 credits per survey report generated.
Line and polygon capture
There are many common scenarios for capturing line and polygon GIS features in surveys, such as delineating a treatment area or highlighting an assessed section of pathway. Previously, capturing these features alongside Survey123 required switching to Collector for ArcGIS. A workflow might have involved collecting attribute information in a Survey123 form, launching Collector (through a URL in the form), digitising a line or polygon geometry in Collector and returning to Survey123 to submit the form. With the latest release of Survey123, you can now collect line and polygon features directly within Survey123 - without the need to bounce to and from Collector.
To set up line and polygon questions in your survey, just follow these steps:
-
You need to use the new geotrace and geoshape XLSForm question types through Survey123 Connect. The geotrace question is used to create and edit lines while the geoshape question is used for polygons. Both questions work in the same way that geopoint questions do, allowing you to bring a map question into your survey.
-
Once your form is published, end users can start sketching or digitising the corresponding features (line or polygon). Note that geotrace and geoshape questions are supported in both Survey123 field app and web app. So you will still have the same experience when working with lines and polygons no matter which app you prefer using.
-
When survey data is submitted, you can view, check, and filter all captured data using the Survey123 website. Accessing the Data tab allows you to visualise data collected through the geotrace and geoshape question types, in a map and individual response views. You can also include line and polygon data in your feature reports.
The experience of capturing a polygon in a web browser using a geoshape question.
If you are interested to learn more about how lines and polygons can be used in Survey123, there are quite a lot of advanced tricks in this blog.
There are many use cases where the image-map appearance can be very useful.
Range question
Ever wanted to restrict your user input to a well-defined range? Or set up your survey based on an existing feature service that uses a range domain? This can now be done, thanks to the range question. This question type allows users to capture integer or decimal input within a specific range using a horizontal slider. This feature works well with touch screens where you can easily shift the slider to select a value - although you can also change the values using the left and right arrow keys when the control has the focus.
To set a range question in your survey follow these steps:
-
In Survey123 Connect, add a range under type column and fill in the name and label of the question.
-
By default, the slider values range from 0 to 10. To change that into a range that suits your use, you need to specify the start, end, and step in the parameters column. Say for example you want to set a range that only accepts values of any whole number between 0 and 5, you will need to write this as:
Start=0 end=5 step=1The field created for the feature service depends on whether the parameters' values are integers or decimals.
-
To customise the colours of your slider, specify three style parameters under body::esri:style column: startColor for the colour of the leftmost side of the slider, endColor for the rightmost side, and color for the colour of the space between the left side of the slider and the current value.
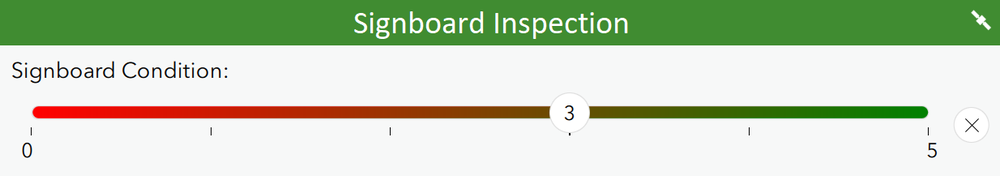
Restrict users input to a well-defined range.
A final couple of functions…
Single choice grid
Single choice grid allows you to compact a series of choice list questions that share the same set of answer choices. This feature helps make your forms more easily readable as well as reducing the need for end-users to scroll down the form. Single choice grid has been available in the Survey123 web designer and the web app since version 2.8, but is now included in Survey123 Connect and the field app.
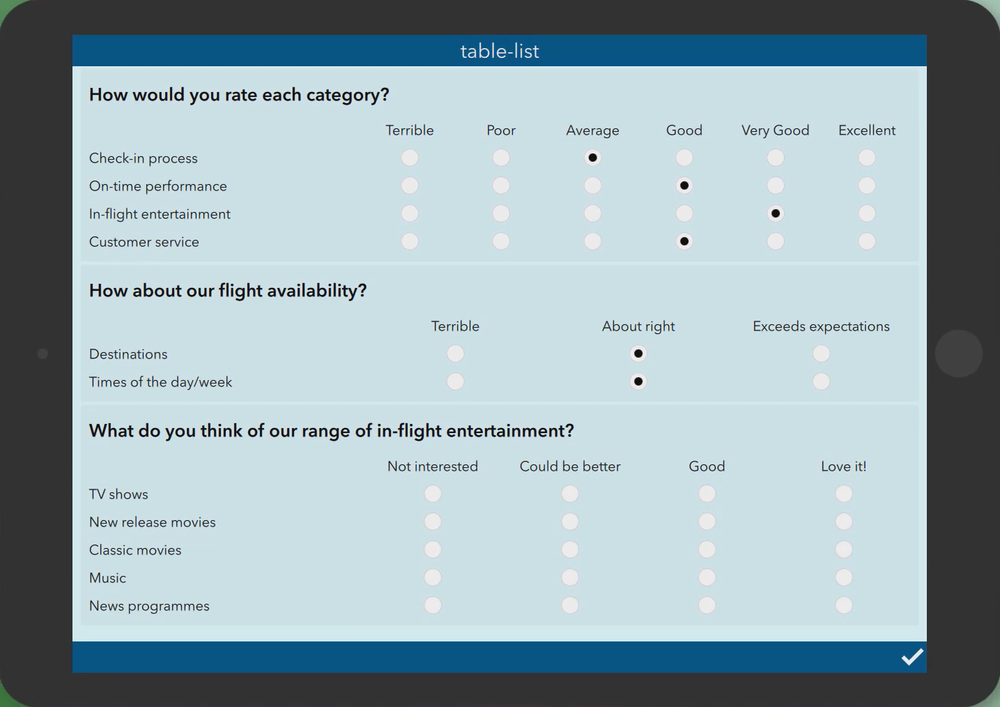
Compact series of choice list questions that share the same set of answer choices.
Form preview bezels
Ever wondered how your forms will look on different devices? The new form preview bezels in Survey123 Connect allows you to design them to ensure end-users can use the forms without any difficulties. You can select any bezel (a frame around the form preview) from the built-in options or you can build your own.
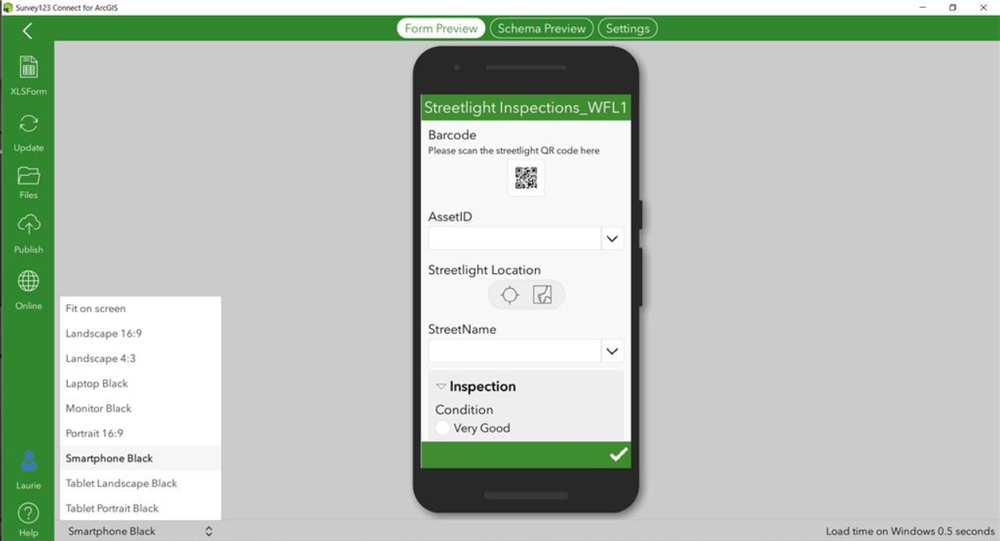
Select any bezel from the built-in options.
If you feel that you haven’t had enough from this blog, head over to this one for even more about recent updates.
Update: Survey123 3.7 is now available across all platforms. Find out more about this enhancement and bug fix release here.