The first batch of the Covid-19 vaccine has reached the UK and the first vaccinations are underway. The initial availability of the vaccine will is limited, but the hope is that as other vaccine programmes move from trials to release the supply will steadily increase. But how do you efficiently vaccinate a population of 66 million?
Understanding the geography of the pandemic and being able to share that knowledge with the public has been key to the management of the pandemic. The vaccination programme that began today will be on a scale that the nation has never faced. GIS can help with the planning, delivery and reporting of this logistically challenging health care programme. Este Geraghty wrote a really informative view of the role GIS can play in this blog.
I’m going to focus on some of the challenges more specific to the UK. Please note that the examples and maps in this blog were created to illustrate the types of analysis that might be useful.
Identifying the best locations for vaccination centres
The first vaccine available requires careful storage and handling. It is initially being managed and distributed from hospitals. Some hospitals may already have the capacity to act as a vaccination hub but it’s important to understand what area those hospitals can cover. Looking at planning questions using administrative boundaries doesn’t always give an accurate view of the connections between locations. GIS allows us to understand how places are connected by transport networks. A useful first look is to calculate the service area for a set of locations. I’ve used hospitals as the vaccination hubs, derived from the Ordnance Survey Points of Interest data, but the approach could equally be applied to GP practices. Assuming there is a practical journey time that defines the reach of a vaccination hub we can generate service areas for candidate locations.
Do the selected vaccination sites provide the coverage required?
For the example below I used the proximity analysis tools in ArcGIS Online to generate service areas for a thirty minute drive from a selected set of hospitals in the area around Derby (check the credit use before running). The service area for Nottingham City Hospital (highlighted) extends less far to the west and the hospital in Derby might also be needed.
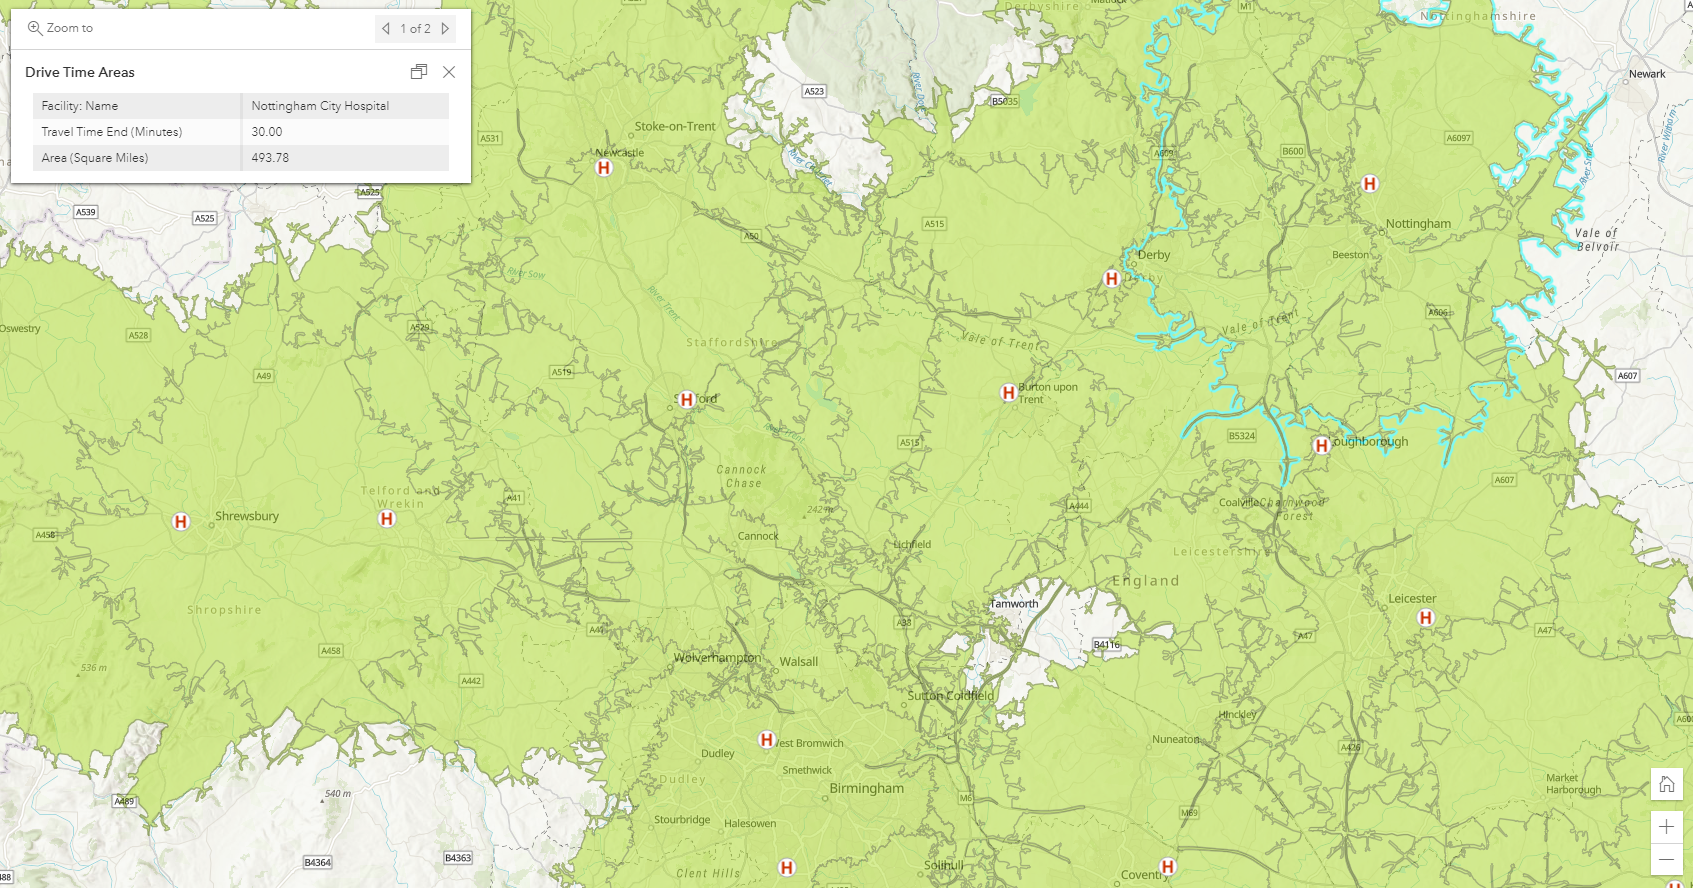
Calculated service areas for hospitals based on a thirty minute drive. The area for Nottingham City Hospital is selected.
As the programme progresses it might be possible to open up new locations as vaccination centres. How reachable are candidate sites and how would they supplement the existing locations? This can easily be modelled for road, pedestrian and – thanks to one of our data partners – public transport connections.
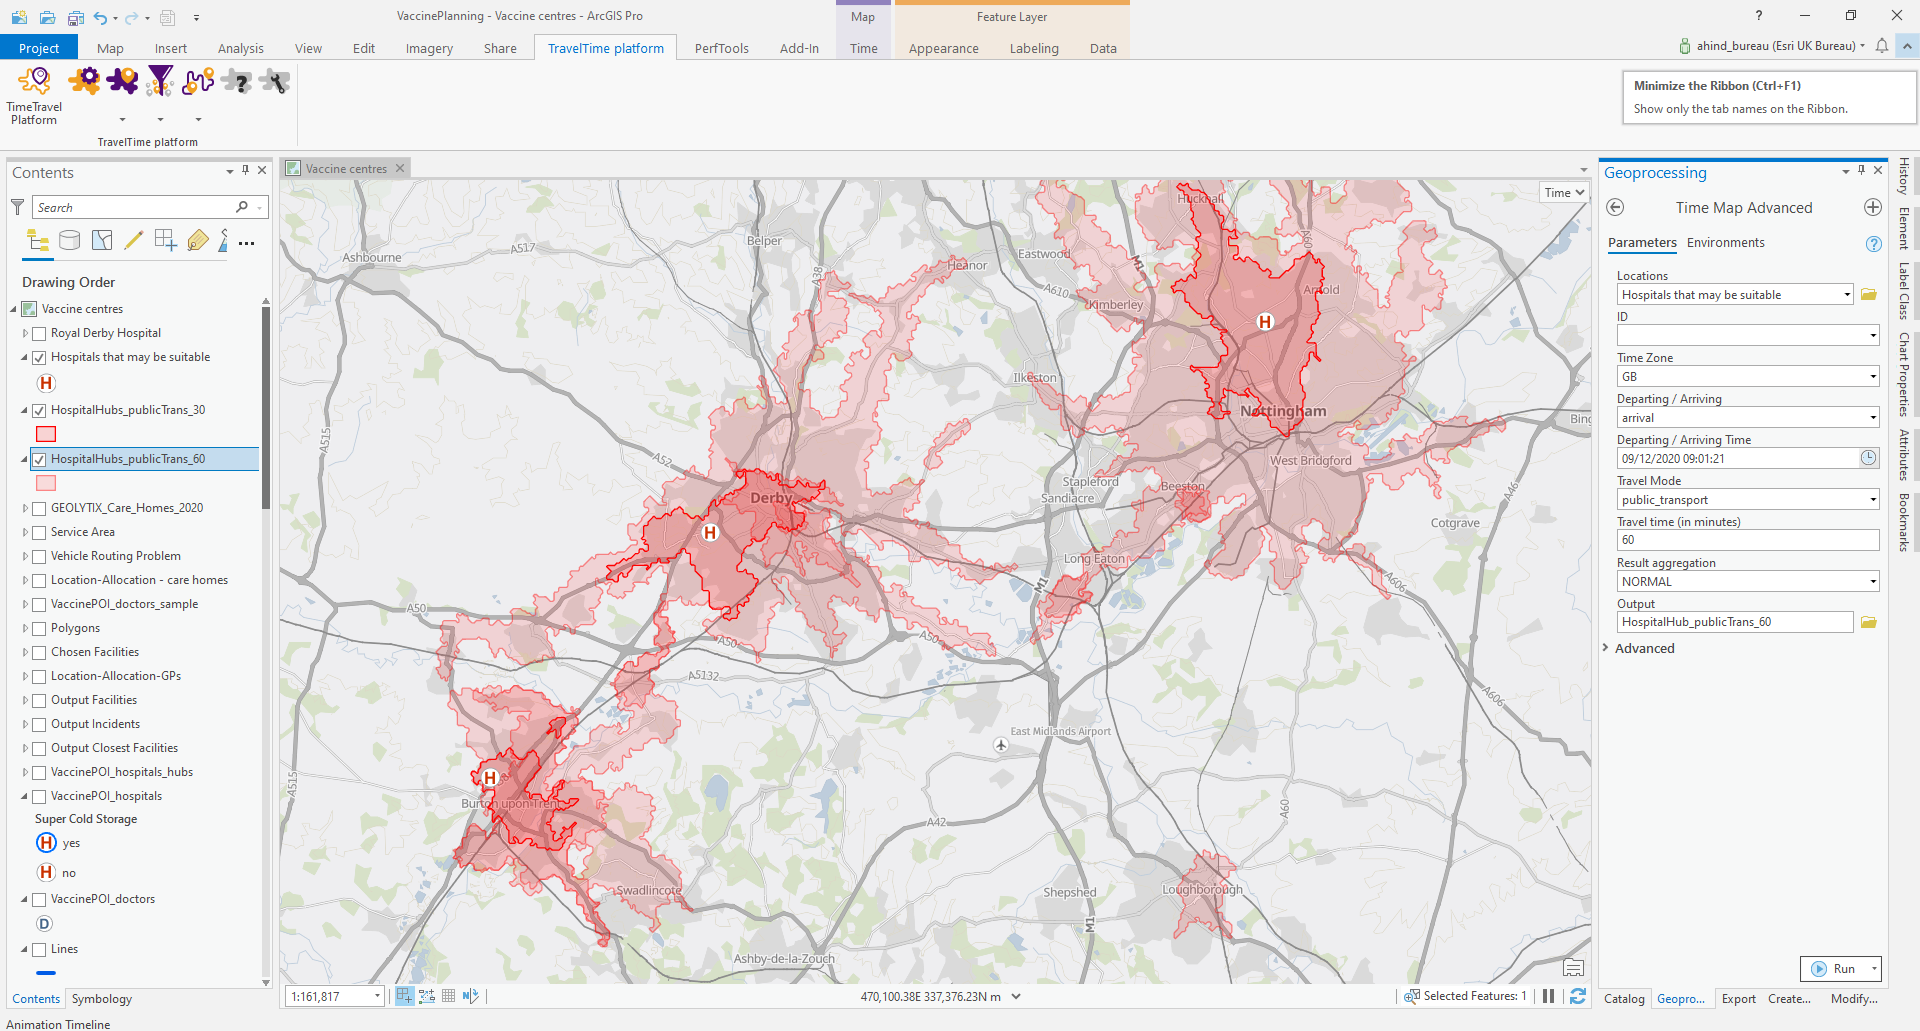
Areas within a thirty and sixty minute public transport journey of selected hospitals. These were generated using a partner solution from TravelTime.
What population would be served by a vaccination centre?
We’ve used a practical geography to define the area that a vaccination hub will serve and we can combine this with data on the local population. The ArcGIS Living Atlas gives us access to the 2011 census data which details population size and key demographics for a range of geographies. One way to get more up to date data is to add demographic data from Michael Bauer Research (this uses credits). This can be done for specific geographies so we can quickly add demographic data to our service areas:
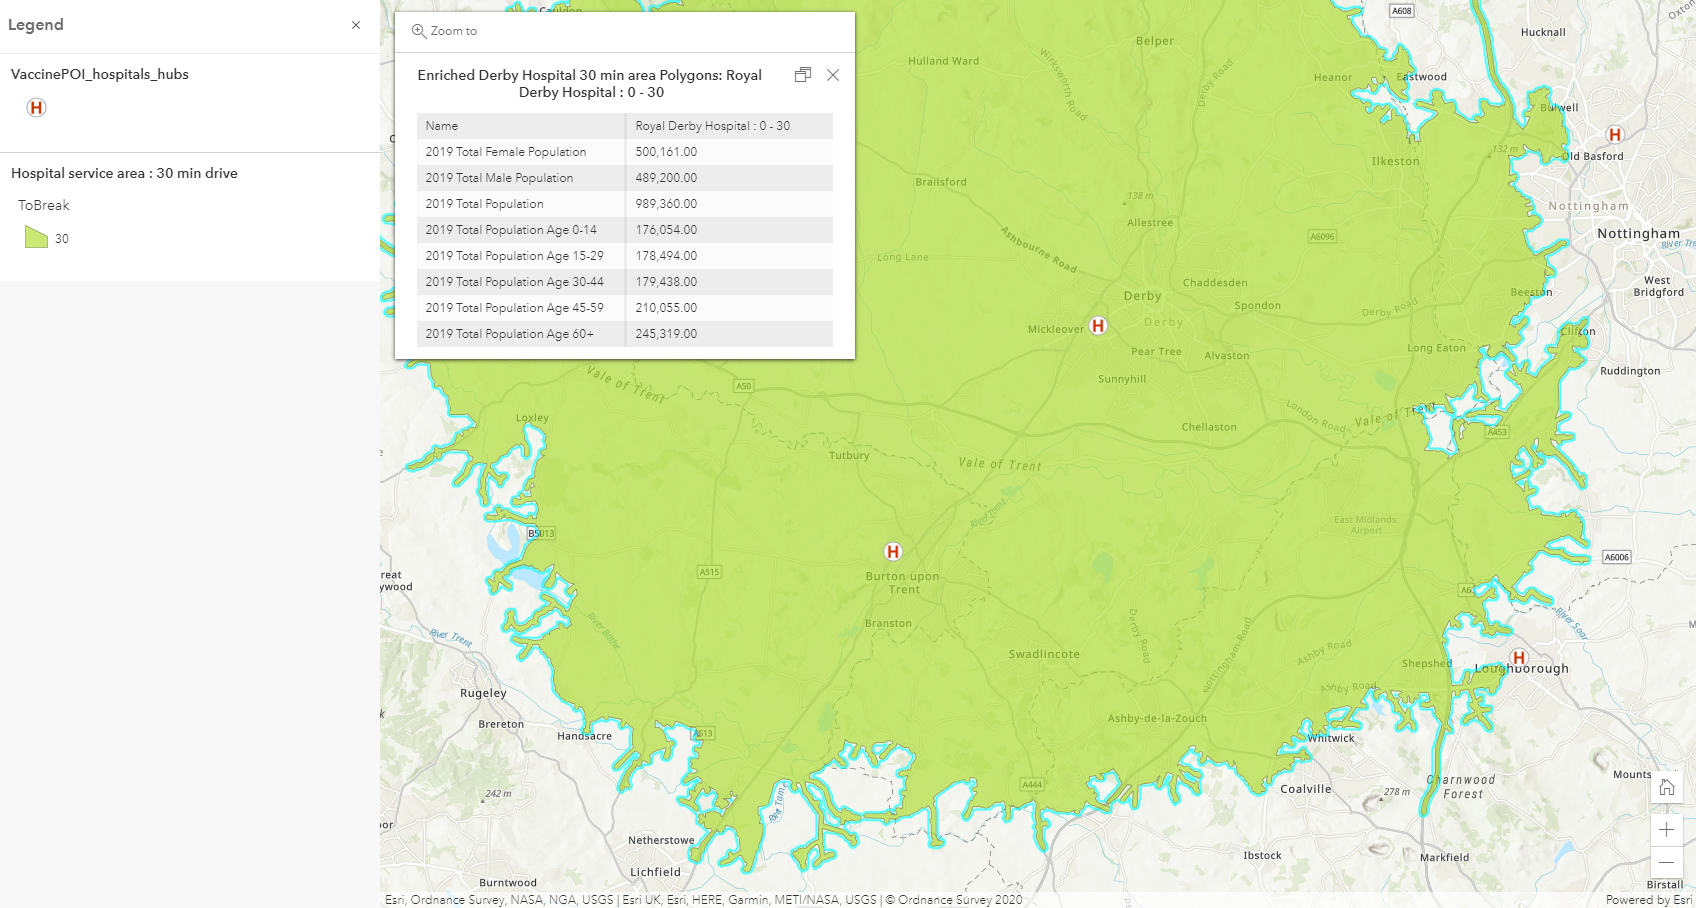
The ArcGIS Online Enrich Layer tool was used to add 2019 population data to a 30 minute drive service area.
Another valuable data repository is Instant Atlas and if you have access to this you can add data layers to your maps. As we move towards mass vaccination planners will need to understand where different parts of the population are located and how this relates to the locations they can use as vaccination centres – whether that’s delivery through GPs in rural areas or the setting up of mass vaccination centres to serve areas of high population.
How do you gradually vaccinate a population and manage the geographically variable spread of a pandemic? As the pandemic has progressed we have moved between managing it at a national level to managing at a local level – with national lockdowns recurring in some parts of the UK. Will the vaccination programme be targeted at areas with high case numbers or focus on population characteristics such as the age distribution, population density or economic conditions? GIS allows us to view and understand the spatial patterns and relationships between different data sets. We recently added a data service to the ArcGIS Living Atlas for the UK Covid-19 cases.
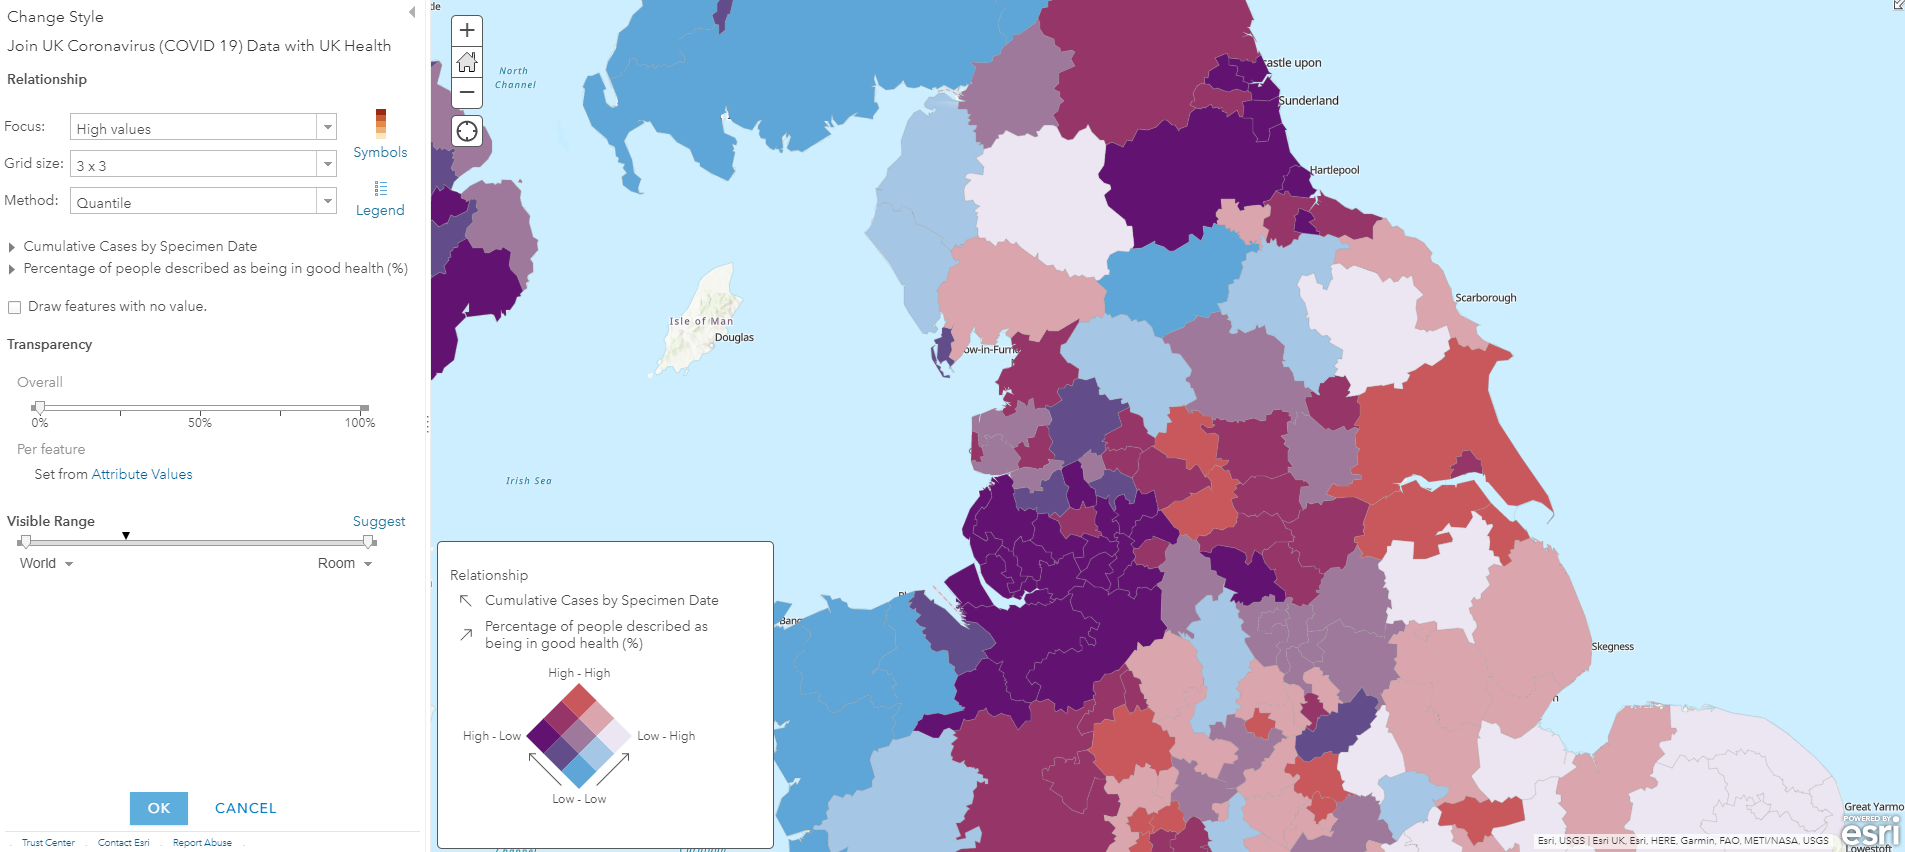
A bivariate map allows the relative value of two statistics to be displayed. Here the cumulative Covid-19 cases and a health indicator are show for local authority areas.
Modern GIS uses web services and easy to use, focused web apps to put the data and analysis tools directly into the hands of practitioners. The service areas and data enrichment examples above are both accessible through a web app. A colleague created this example of dynamically adjusting criteria for three population statistics to identify key areas using Community Analyst:
GIS allows us to view and understand the spatial patterns and relationships between different data sets, using a range of tools, and present that in different ways to different stakeholders. The example below shows an infographic style report for a potential location in Belfast:
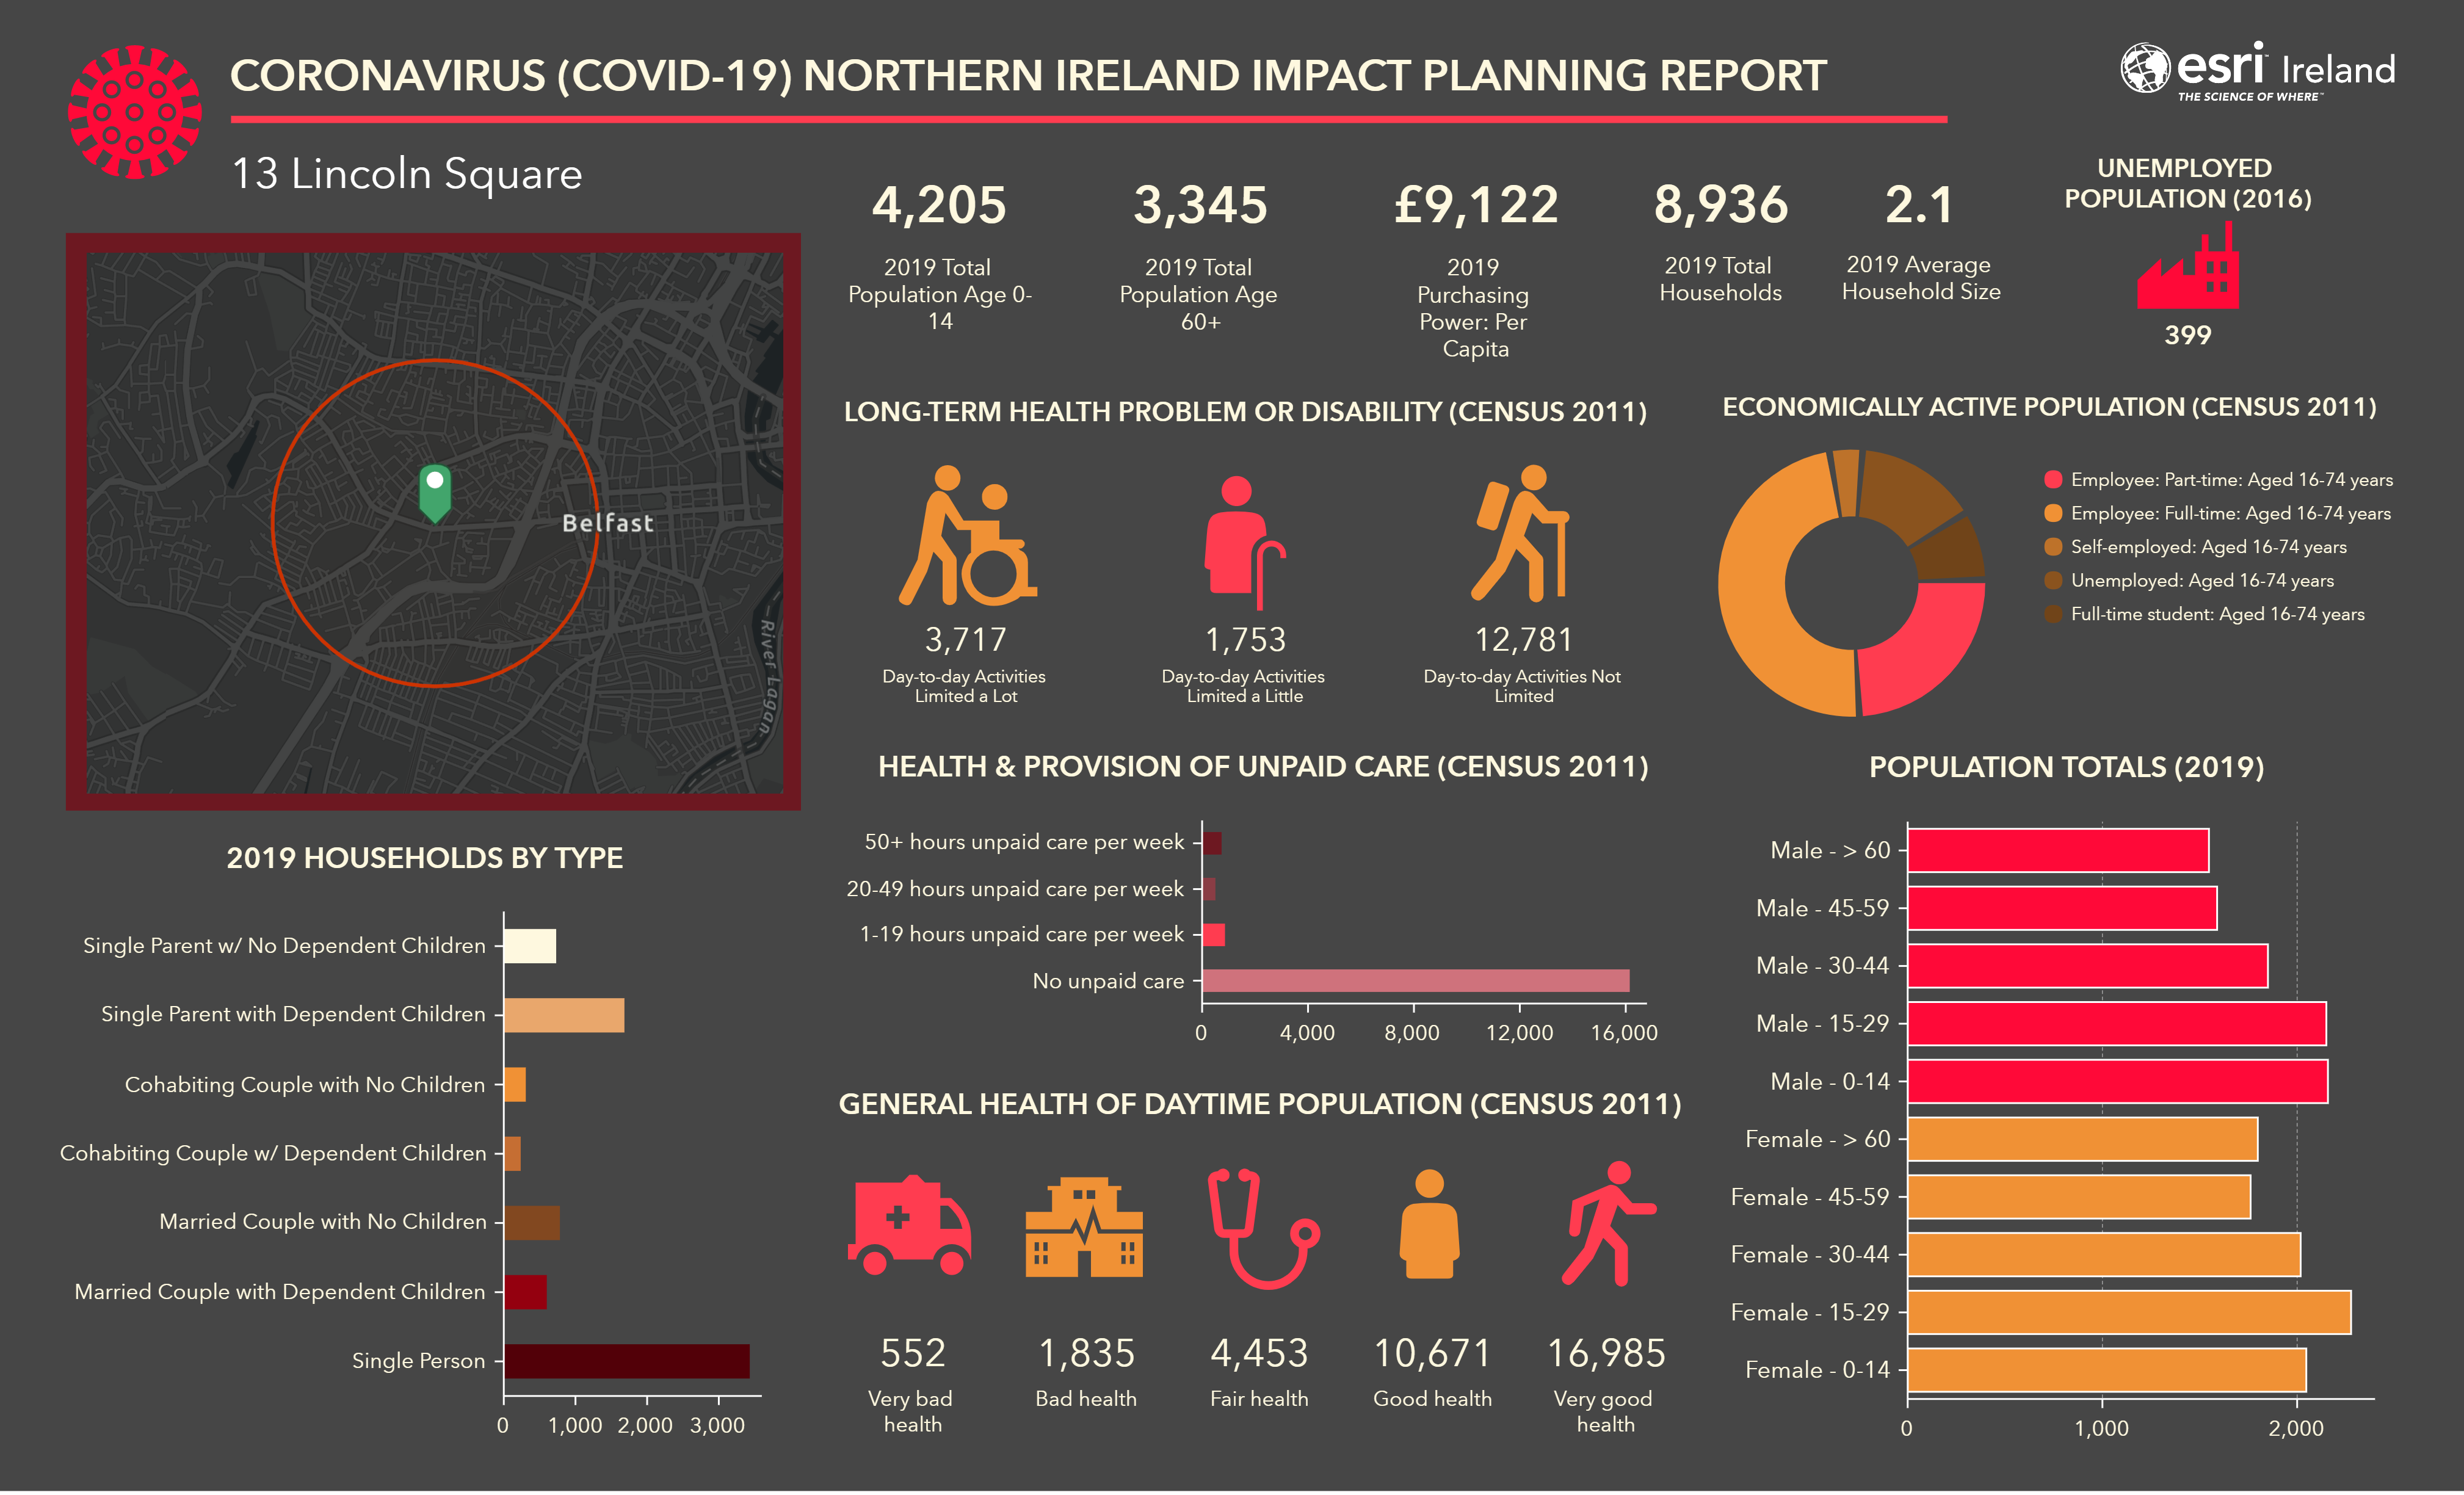
An infographic that summarises data for an area around a candidate vaccine centre. Created using Community Analyst.
Delivering vaccination where its needed
The vaccines will come online in limited quantities and with different handling requirements. The vaccination program will be targeted at key groups at different stages of the program. Where are these groups located? Can they reach a vaccination centre, or do they need to be targeted by a mobile team? For each phase the patterns will shift.
With the vulnerability to Covid-19 of people in care homes they will be targeted early in the vaccination programme. Since they aren’t in a position to come to a vaccination centre they will need mobile units to come to them. We need to be able to understand how the care homes in an area are distributed in relation to the vaccination hubs.
What’s the most efficient way to allocate care homes to vaccine hubs?
GIS allows us to tackle scenarios like this using the connectivity of places through the road network. In ArcGIS Online the Find Nearest tool can help to identify which hub should serve a care home based on drive time. For a more sophisticated optimisation tool I switched to ArcGIS Pro and the Network Analyst extension. In the example below I have set up a Location-Allocation analysis to optimise the assignment of care homes to vaccination hubs. The care home data is a subset from the GEOLYTIX Care Homes 2020 layer in the ArcGIS Living Atlas and is included as part of ArcGIS. Location-Allocation allows you to mark key facilities as required and others as candidates. The optimisation can then identify additional sites that would be needed to serve the demand locations within a travel cut off.
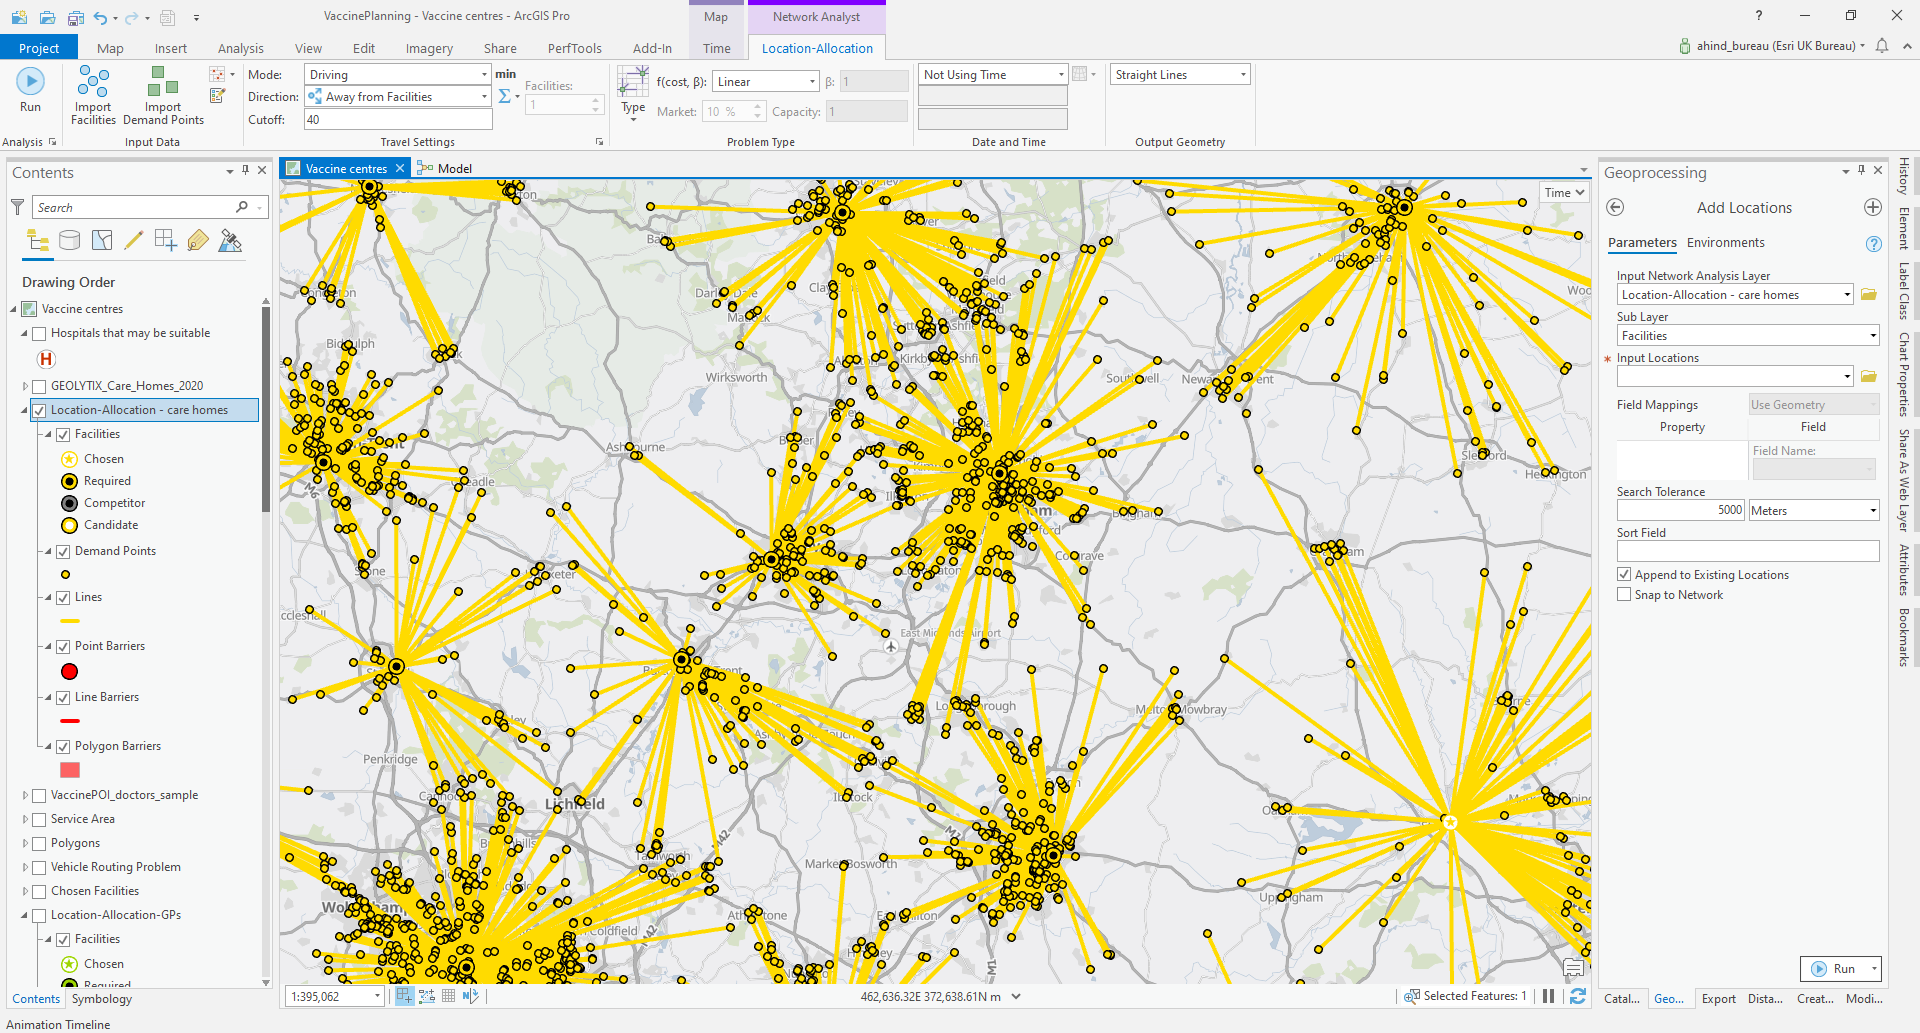
The example output from running Location-Allocation suggests which care homes would be assigned to which hospitals to fulfil the requirement they are within a 40 minute drive.
How quickly can the planned mobile units visit the care homes assigned to them?
Moving to this more local scale, the Vehicle Routing Problem (VRP) tools allow you to plan the work of mobile vaccination teams to visit the care homes in their area. To illustrate this I set up a VRP with two mobile teams working over six days (using a Route for each team for each day). With data about the number of patients and staff in each care home you could model the amount of time different homes would take to vaccinate. I resorted to a fixed value and also assumed each team can take enough vaccine to cover more than one care home in a single trip.
An example optimised schedule for two teams working over six days to vaccinate care homes.
How much quicker would it be with more teams?
I could add additional sets of Routes to represent the deployment of more vaccination teams. Repeating the analysis would show how many more care homes could be vaccinated in the modelled time. Questions like this can only be accurately answered by understanding location connections using their connectivity on the road network. For a planning exercise on the scale the country faces the potential for efficiency savings could be significant.
Monitoring and sharing progress
As the vaccination programme runs its course the proportion of the population vaccinated will vary between different areas. How do you track vaccination levels and monitor these alongside changing case numbers? How do you keep the population reassured of the progress being made but informed about the ongoing risks before vaccination is complete? Maps and dashboards – like the John Hopkins dashboard – allow information to be presented in an informative and up to date way. I’m sure they are going to continue to help us all understand how the pandemic unfolds.
Within the ArcGIS platform we have range of options to make accessing and understanding interactive maps easy for different audiences. The platform also supports the secure sharing of data between teams and even between stakeholders in different organisations. For more examples of how GIS can help with vaccine planning have a look at this resource site. For UK resources and information please visit our Covid-19 site. Or if you want to talk to us about how ArcGIS might help with the challenges you face please reach out to your Esri UK contact or email us at sales@esriuk.com