Blog Archives

Massive Drop in Business Travel Could Be Permanent
Business travellers provide revenue to many companies. What happens if a third of them stop travelling?
In a holiday travel season crimped by COVID-19’s spread, a group of business experts and travel industry veterans predicts that business air travel could remain down by more than a third even when the rest of the economy rebounds.
In an analysis that stretched over months, Wall Street Journal columnist Scott McCartney sifted data and insight from airline industry veterans and landed on a prediction with deep economic implications across sectors. After COVID-19 retreats, there will likely be 19 to 36 percent less business-related air travel than in the pre-pandemic era, he found.
If that prediction holds true, consequences for the airline industry will be profound. Other sectors that benefit from business travel could suffer as well. For hotels, convention centres, and meeting spaces; restaurants; retailers with airport locations; consulting companies; and service providers that cater to travelling business professionals, a decline of this magnitude demands new thinking and new tools to support smarter location strategies.
Article snapshot: A recent analysis predicts that business travel could be down more than a third even after the COVID-19 pandemic recedes, creating new challenges for companies—across all industries—that subsist on business travelers.
One Overlooked Cause of Less Travel—The Net Zero Effect
With COVID-19 vaccines now on their way to people worldwide, some business forecasts have improved. Analysts at Goldman Sachs expect economic growth of more than 5 percent in 2021. But for pockets of the economy—including those affected by business travel—sales likely won’t return to previous levels.
McCartney says travel reductions will be driven by classic business influences such as efficiency and cost. One factor he doesn’t mention is the corporate push toward net zero carbon emissions. As more CEOs pledge to go net zero by 2050 or earlier, they’ll take a dim view of business activities that contribute to emissions, including travel by airplane. (Flights tend to be a “dirtier” form of travel than other means, according to a recent analysis.) Earlier this year, health-care provider Bupa Global found that a quarter of business executives plan to reduce international travel in the post-COVID era to lessen their carbon footprint.
Regardless of their motivation, 91 percent of CEOs in a May Fortune survey said they expect business travel to be less frequent [subscription]. If such predictions pan out, companies that rely on business travelers will face a planning challenge. They’ll need to understand where people consume products and services, and use that insight to create a profitable location strategy for stores, offices, warehouses, and other facilities.

Business travel makes up 21 percent of the nearly $9 trillion worldwide travel and tourism market, and a less-than-healthy rebound will create a smaller pie for service businesses to capture.
Long-Term Location Strategy Meets Short-Term Consumer Shifts
To adjust to significant economic shifts, industry leaders need fast and accurate location insight. In the digital age, that’s more accessible than ever. With anonymized information on where consumers are and no-code technology like a geographic information system (GIS) to illustrate changing patterns, company leaders are locating new business opportunities.
Executives are making those adjustments faster than they used to. Traditionally, decision-makers set location strategies for the long term, weighing where to sign multiyear leases for stores and offices or build manufacturing facilities and warehouses. That began to change prior to the COVID-19 pandemic, as CEOs sensed changes in shopping patterns and pushed for shorter commercial real estate leases. During the pandemic, the trend has accelerated. The average lease length in the US fell by 15 percent during the first five months of this year, according to JLL.
The most obvious reason for this decline is the uncertainty created by COVID-19. Business leaders are now more sensitive to unforeseen events, and need to adjust location strategies for factors like lockdowns, work from home, and business travel declines.
Shorter leases are a means to that end—a tactic to help companies become more agile. But understanding how to put that agility to use—how to change business plans as economic realities change—requires location intelligence.

Reliable information is key to understanding current customer needs and possible future customers. Demographics including age, gender, income, and spending habits can be linked by GIS technology to a physical location or catchment area, helping brands identify opportunities and define actions.
Richard Bezuidenhout, Swarovski
Location Intelligence: See Changes Sooner
One indispensable tool for understanding changing economic patterns is a smart map. As Swarovski’s Richard Bezuidenhout wrote recently in WhereNext, companies that use smart maps to fine-tune their location intelligence are more likely to weather disturbances and spot new business opportunities:
With smart maps, business leaders can zoom in to a region or city and take the temperature of stores there through indicators such as customer relationship management (CRM) data, survey data, and demographic information.
GIS-based maps help business planners see where people are spending time and buying products and services. With millions fewer business travelers moving through the country during any given week in the future, companies that contextualize this kind of location data will make adjustments that competitors won’t anticipate, Bezuidenhout notes:
Location technology can highlight microtrends specific to one city avenue where a shop is located, or industry-wide changes that shape an entire national network.
The COVID-19 pandemic will be remembered for its profound impacts on human health and its quick reshaping of the economy. In addition to decreased business travel, it has accelerated trends such as carless cities and remote work, forcing business executives to plan in a fluid environment. Those who do so with the help of location intelligence may find an advantage in a volatile world.
This article was originally published in the global edition of Wherenext

COVID-19 Vaccines, an Urgent Global Need, and a Supply Chain Challenge
COVID-19 vaccines will be distributed through a global cold chain that is inherently inefficient. Location intelligence will be key.
In November, as soon as Pfizer, Moderna, and AstraZeneca announced promising results from their respective COVID-19 vaccine trials, the public’s attention began to shift from research and development toward distribution.
Urgent and worldwide demand for vaccination creates an immense logistics challenge. Distributors and health-care providers will need to navigate the vaccine cold chain, a specialized, temperature-controlled supply chain hampered by inefficiencies and limited infrastructure.
As leaders work quickly to optimise and reinforce the cold chain, many will turn to the location technology they’ve used to optimize supply chain management for decades.
Article snapshot: The development of COVID-19 vaccines has broken speed records at a time when the world desperately needs rapid solutions. The next global challenge: distributing vaccines effectively through the cold chain.
Minimizing Risk in Real Time
Improving a supply chain often starts with operational visibility. IoT sensors and real-time data analysis tools can be key tools for logistics companies to collect data throughout a product’s manufacturing and distribution. Adding location technology, like a geographic information system (GIS), creates valuable tracking and visualization capabilities.
In the case of the vaccine cold chain, the combination of IoT and GIS could be key to preventing losses. Vaccines degrade quickly and must be kept within a specific temperature range—public health guidelines note that even minor deviations can render a vaccine ineffective.
Approximately 25 percent of shipped vaccines are compromised due to poor temperature management, according to a 2019 report from the International Air Transport Association. The report estimates that temperature-related pharmaceutical damage costs the health-care industry in excess of $34 billion each year.
For the people and economies depending on a COVID-19 prophylaxis, ineffective cold chain management will be especially costly.
These are precisely the kinds of risks that can be minimized with location intelligence and greater supply chain visibility. The concept has been applied to reducing perishable food waste by using IoT sensors to track temperature shifts during shipment. Using smart maps to track a shipment’s location and temperature adds vital environmental context and transparency in a segment of the supply chain where the risk of disruption is high.
Businesses that monitor live data on a GIS-based map are able to react in real time, as FedEx does to manage its fleet of planes. For vaccine distributors, such situational awareness can expose flaws in the cold chain and help prevent spoilage. Supply chain managers might reroute a delivery if the power is out at its planned destination, or alert transporters if temperature inconsistencies are detected in transit.
For many products—and especially the COVID-19 vaccine—the ultimate goal is faster delivery with fewer losses. Location-based visibility will help cold chain distributors achieve this level of efficiency as the world inches closer to the pandemic’s end.
Finding and Filling Critical Gaps
Efficiency is one attribute of successful vaccine distribution; equity is another. The COVID-19 virus can’t be stopped unless the vaccine is broadly administered. But the cold chain, with its specialized equipment and processes, is inherently an inequitable system. It favours high-resource communities with ample transportation options, a consistent power supply, and a trained workforce. Places and populations that lack these amenities must be identified, and steps must be taken to ensure vaccine accessibility—tasks more easily accomplished with smart maps that highlight coverage gaps.
A Digital Twin Illuminates a Moving Target
The Port of Rotterdam has made a name for itself as a supply chain innovator, and its Container 42 project underscores the value of digital twins. Using sensors, real-time data streams, and location technology, these cutting-edge shipping containers provide a nuanced view of goods in transit to help manufacturers, logistics providers, and retailers plan their supply chains more effectively.
With the cold chain in focus for COVID-19 vaccine distribution, supply chain innovations like this take on heightened importance. Learn more about the Container 42 project in this article.
Such maps could take the form of a supply chain digital twin (see above), a virtual copy of the real world that can be used to test a variety of scenarios and enable smarter responses to supply chain conditions.
For example, each of the three vaccines currently up for approval has different storage requirements. The Pfizer vaccine’s temperature range can only be maintained with an ultracold freezer or dry ice. Moderna’s vaccine must be kept frozen, but standard freezer temperatures suffice. AstraZeneca’s can be stored in a standard refrigerator.
With a digital twin, stakeholders can plan their distribution strategies. Some parts of the US, for instance, have pre-ordered from Pfizer but don’t have ultracold storage. Many plan to rely on dry ice—but what if high demand causes a shortage similar to recent runs on PPE supplies, and as a result, dry ice prices rise? If it turns out to be more cost-effective to install an ultracold freezer, planners will need location intelligence to identify the most strategic location within the community.
Alternatively, some places won’t have the option of freezer storage at all, including certain regions of Africa that rely solely on solar-powered refrigerators. Local leaders will need to ensure that these communities have access to an approved vaccine that can be stored safely at warmer temperatures. A digital twin of the cold chain could highlight pathways to equitable distribution in those areas.
A Location-Based Solution for a Location-Based Virus
Just as COVID-19 has spread from place to place, the vaccine must follow geographic pathways to support a global recovery. Unlike the virus, however, the vaccine’s possible routes are limited by the cold chain. Location intelligence is the key to understanding where vaccines need to go and how to get them there.
As public health organizations continue to approve vaccines and the distribution process begins in earnest, location technologies will likely prove themselves an essential tool in supply chain optimization.
This article was originally published in the global edition of WhereNext
Documenting oral history through maps and ArcGIS StoryMaps
For us Matawai, the process of creating the map gave birth to the oral history project ... to make decisions about which stories should be shared and which stories should not be shared. We were able to put the story … Continue reading →
For us Matawai, the process of creating the map gave birth to the oral history project ... to make decisions about which stories should be shared and which stories should not be shared. We were able to put the story of the Matawai on the world map, so that people everywhere can know that we exist. - Rolien Sallons
Rudo Kemper is a geographer with a background in archives and international administration, and a lifelong technology tinkerer. He is passionate about co-creating technology and maps to support Indigenous and other marginalised communities in defending their right to self-determination and representation, and safeguarding traditional knowledge of their lands.
In a recent discussion with Esri’s StoryMaps team, Rudo shared his experiences with map-based storytelling and the recent Lands of Freedom project—an ArcGIS StoryMaps collection about the oral history and cultural heritage of the Matawai Maroons in Suriname. Read a snapshot of the discussion below.
 Rudo Kemper, featured storyteller
Can you tell us about the mission and work of the Amazon Conservation Team?
The Amazon Conservation Team (ACT) partners with Indigenous and other local communities in South America to protect tropical forests and strengthen traditional culture. ACT was founded in the mid-1990s with the observation that the most pristine and continuous forests were not in parks, but on lands inhabited and controlled by Indigenous people. ACT sees a future where healthy tropical forests and thriving local communities together contribute to the well-being of the planet.
What’s your role within the organisation?
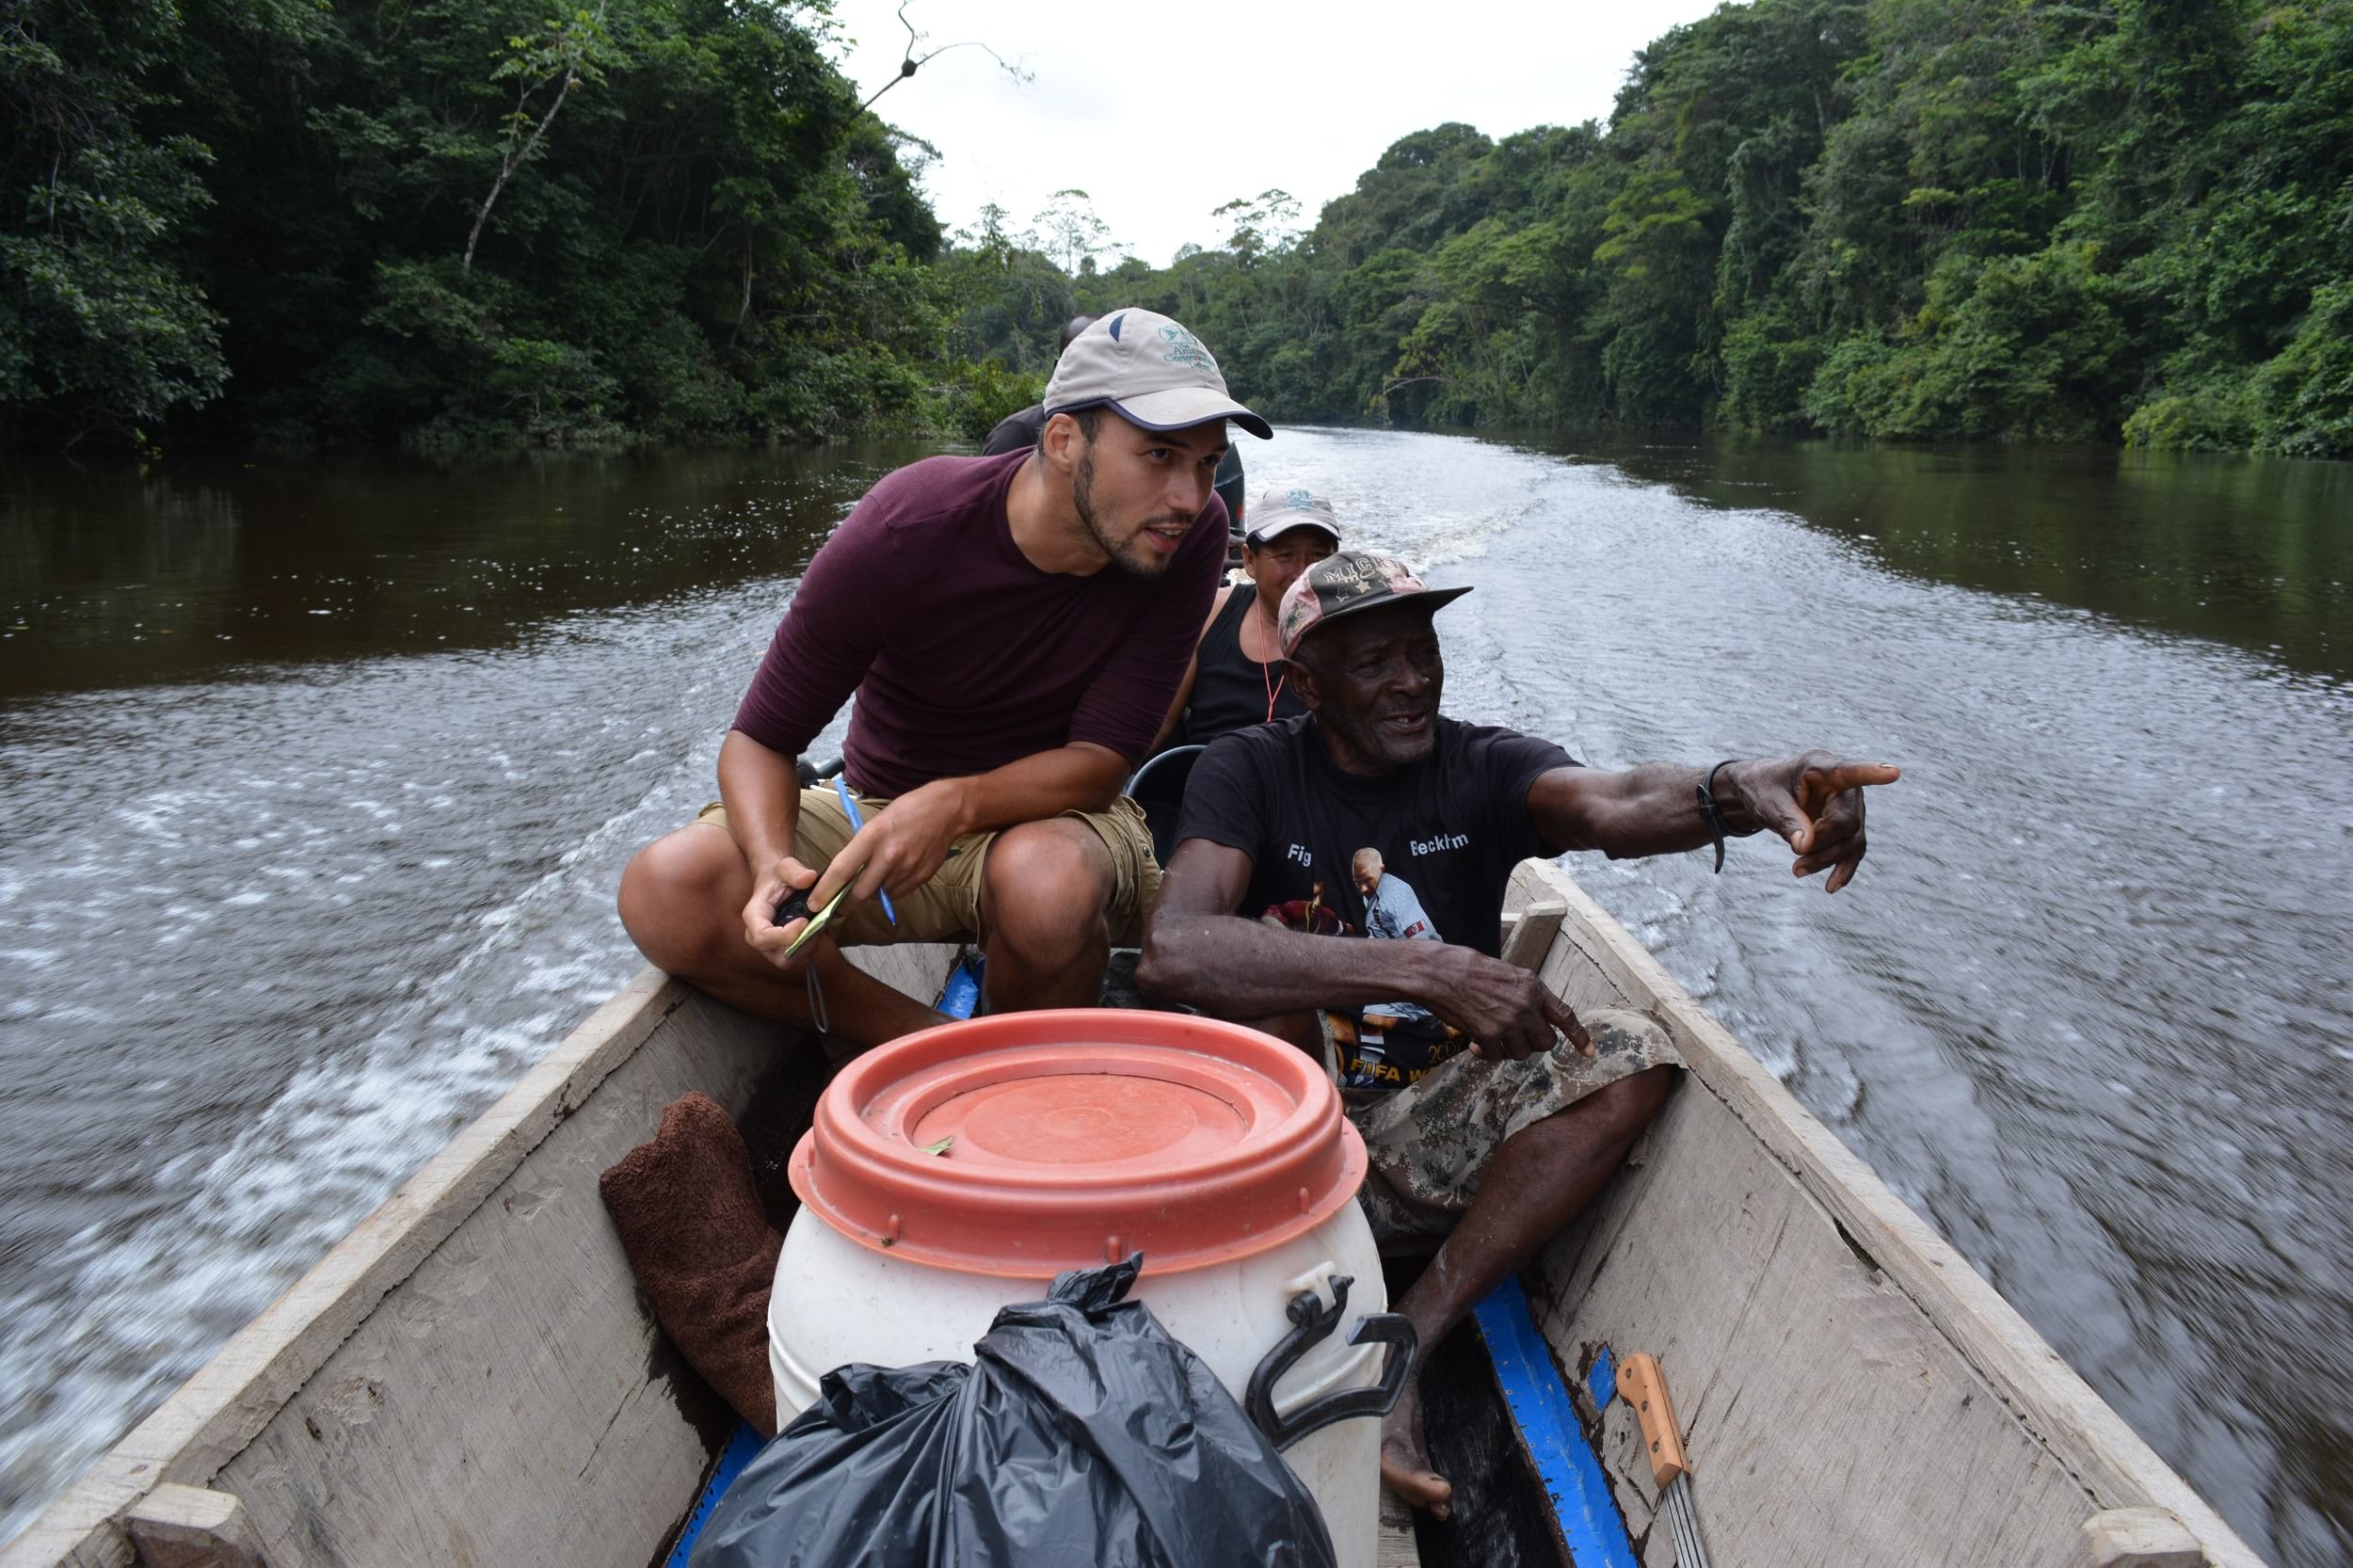
As an anthropologist by training and a geographer by trade, my principal role at ACT was to help Indigenous and other forest communities make maps of their lands. ACT embraces the practice of participatory mapping, where we help local communities undertake their own data collection and mapmaking. Working with rainforest communities involves a lot of time in the field giving trainings and workshops, accompanying community members on expeditions, and researching technology that can work well in the jungle.
I recently transitioned to another organisation more focused on building technologies for Indigenous communities, but I continue to support ACT with mapping and cultural heritage work in Suriname and the Guiana Shield.
How do Esri’s storytelling platforms fit within that work?
From early on, ACT cartographers recognised the importance of story in mapmaking. In the early 2000s, ACT helped the Tarëno community of southern Suriname and northern Brazil make large-scale ancestral lands maps. These incredible maps, pioneering at the time of production, show millions of hectares of Indigenous place names, sacred sites, the locations of natural resources and hunting grounds, and more.
To produce these maps, young Tarëno cartographers like Keeng Kumu—whose life and work were later chronicled in this story—interviewed community elders and came to learn centuries-old oral histories about these places.
 View the Keeng Kumu: indigenous cartographer story.
When the ACT mapping team learned about Esri’s storytelling platform, we immediately understood the remarkable potential for bringing maps and stories even closer together. In 2015, we made our first Esri story—a Map Journal about the gold mining sector in the rainforests of Suriname and the impact of the industry on the lands and livelihoods of the communities. That story was followed shortly thereafter by a beautifully designed cartographic journey into the travels of ethnobotanist Richard Evans Schultes and the Indigenous cultures that he encountered in the rainforests of Colombia and Brazil.
In the past five years, ACT has created seven major stories about Indigenous cultures, the threats and environmental pressures posed by resource extractivism, and the organisation’s work to protect and establish Indigenous reserves. Our stories have evolved over time to use the latest Esri product enhancements.
Can you give us an overview of the Lands of Freedom project?
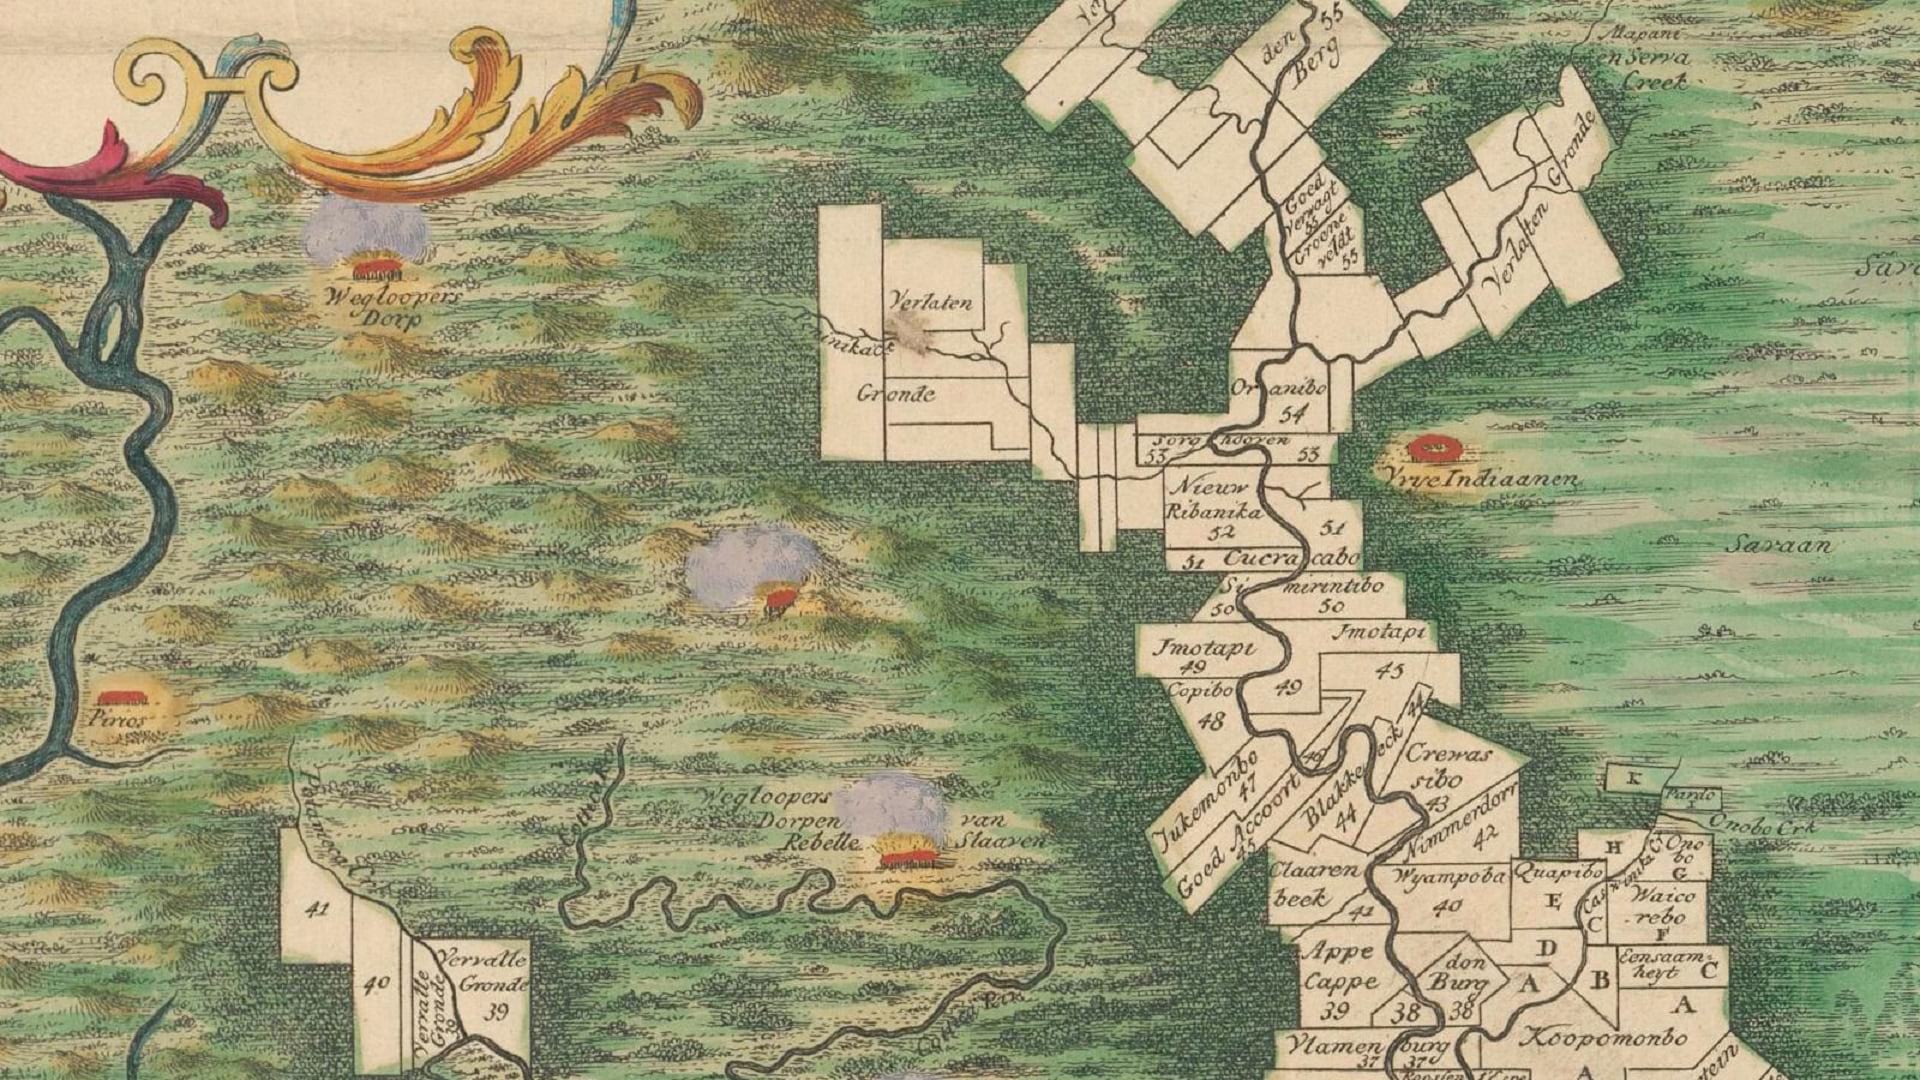
Our latest story, Lands of Freedom, is about the place-based oral histories of the Matawai in Suriname. The Matawai are a Maroon community, which are descendants of formerly enslaved Africans who escaped into the rainforests over three centuries ago. They fought with the colonial powers for their right to exist in what is now their ancestral lands. The Matawai proudly recall enormously rich oral histories about their ancestors’ struggles to find their way in the rainforest and to make it their own, and then identify hundreds of sites related to that history.
During a joint mapping project, our Matawai counterparts frequently lamented the loss of their storytelling traditions in the contemporary era. So, ACT offered to teach younger Matawai important interviewing and mapping skills. In 2017, we partnered with a local Matawai community organisation named Stichting voor Dorpsontwikkeling Matawai on a multi-year oral histories mapping project that culminating in mapping over 700 place names and recording detailed stories for roughly a quarter of those places so far.
The project focuses on the Matawai oral histories that the community has chosen to share. It uses interactive and historical maps, videos, archival materials, and community-created content to bring those stories to life in an extraordinarily vivid way. From our (ACT) side as allies, we also created several chapters focused on the history of Suriname as a plantation colony, setting the stage for a broader public to understand how the story of Maroon communities like the Matawai unfolded.
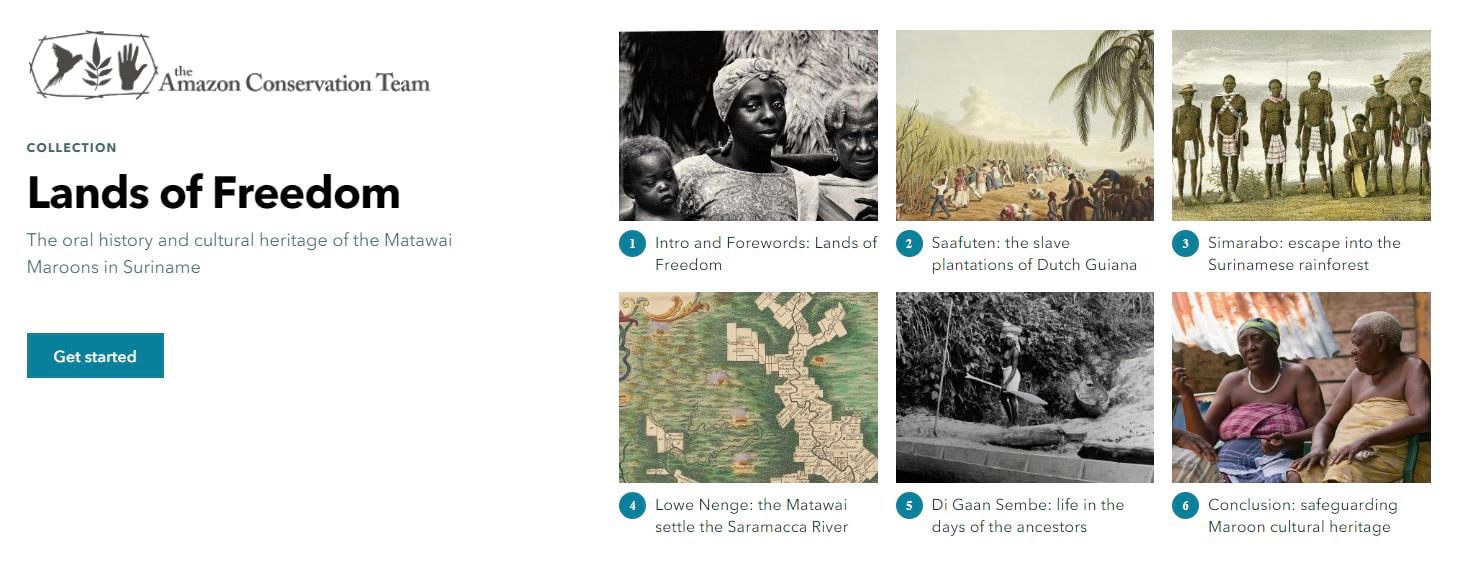 Browse the Lands of Freedom collection.
Why ArcGIS StoryMaps?
When the project began, the Matawai had a few different outcomes in mind. They needed to create a comprehensive archive of stories, maps, photographs, and other materials for internal purposes and as a means to safeguard their cultural heritage. But the Matawai, particularly the youth, also wanted to share their story more widely in an interactive and fun format, with the ability to easily share on social media. For this, we couldn’t think of a better-suited format than Esri’s storytelling platform!
How did the Matawai help you “tell their story?”
Well, on one hand, the ACT team really committed ourselves to reversing that order as much as possible, thinking of ourselves as helping the Matawai tell their story. What does that mean practically? We emphasised their stories over archival documentation, and the community decided which stories and photos would be shared. Rather than acting as the lead, we were partners with a local Matawai organisation to gather individual stories and share them with traditional leadership and elders.
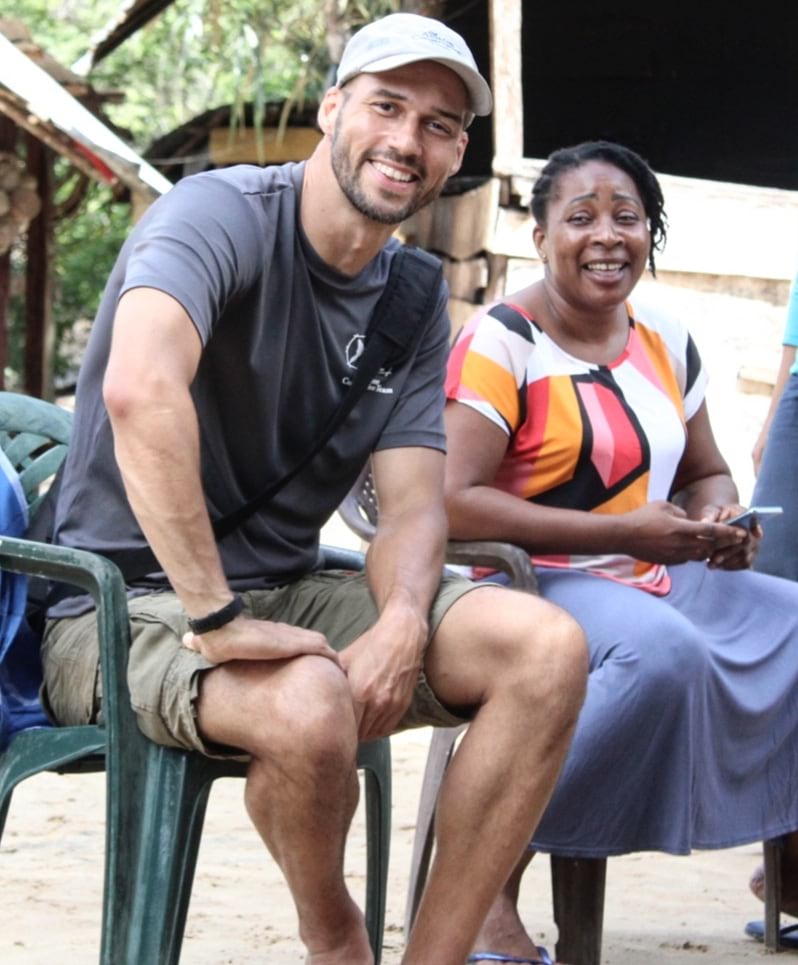
 Rudo on a mapping expedition in 2015 with Matawai elder and traditional leader William Anipa, who passed away last year. Photo courtesy ACT
That said, I also recognise that we, as the allied organisation, created the story with the range and extent of our involvement depending on the chapter. For the chapter relating the experience of the Matawai at the Smithsonian National Anthropology Archives, we simply designed the layout. The highlight chapter about how the Matawai fled from the plantations and settled the Saramacca River is largely a compilation of content provided by the Matawai and several secondary sources. I wrote the content for the second and third chapter about the history of Suriname as a plantation economy. So in practice, the story authorship was a mix, and we tried to make that transparent by identifying the principal storyteller as the author of each storytelling chapter. In addition, what was important for me as the principal designer was to crosscheck and receive feedback from my Matawai collaborators along the way to ensure the content aligned well with their version of the story.
What were the greatest challenges?
We started to curate and design the story right as the COVID-19 pandemic emerged. So we had to postpone one of the community’s most beloved ideas for one of the chapters—to feature the voices of schoolchildren retelling oral histories that they learned through the project.
We also wanted to sit down and co-create the story much more closely with our community partners, but that similarly could not happen because of travel restrictions. Instead, we reviewed content electronically through screenshots over WhatsApp, and had discussions through voice messages.
The process added time to the project, but we persevered and still managed to publish the story in time for Suriname’s National Maroon Day on October 10th.
What was most rewarding or memorable?
What comes to mind right away is the reaction of the youth. There are barely any materials about Matawai history and culture in existence, and in school, the children rarely learn anything about their deeds of their ancestors. Sometimes, when Matawai children move to the city for secondary school, they face discrimination from their peers. When we started this project, we hoped that the videos and maps would give the community a source of pride, and it was really rewarding to see young Matawai share the story on social media. Additionally, the schoolteachers in the Matawai villages have really embraced this as a wonderful resource to teach the students about geography, history, language, computer skills, and culture all at once.
In these times of COVID-19, I was of course sad to be unable to travel to Suriname and be present with the Matawai to celebrate the launch of the story. However, ACT’s Suriname team helped organise a live Zoom presentation of the story led by two community members. I really loved seeing how they used the story to share Maroon history.
Finally, we were pleased to see important cultural institutions like UNESCO and the National Archives of Suriname recognise and contribute to this project. This validated the work and created visibility for the unique story of the Maroons, with the potential to bring resources to the Matawai for more cultural heritage work.
What are the next steps for this story? How has this project empowered the Matawai to write their own stories and build their own infrastructure?
For ACT, it was really important that we played a supporting role in this project and let the community-based organisation take the lead initially and particularly as the oral history documentation grows. The project has sparked a community-wide discussion about the importance of cultural heritage. The Matawai have dreams of a community centre and museum for cultural artifacts, a digital infrastructure for showing the oral histories and the story, and a space for performances and dancing. ACT’s Suriname team is working to support the Matawai and the other Maroon communities by having their intangible cultural heritage recognised nationally as a precious and unique component of the Surinamese heritage and history.
As for ArcGIS StoryMaps, we really love how user-friendly the new builder is, with little to no GIS knowledge required. We’re considering the ways in which we can help Indigenous and other forest people make their own stories and remove ourselves from the picture. I think that in the future, more forest communities like the Matawai will use ArcGIS StoryMaps to tell their own stories, since the technology is now making it possible.
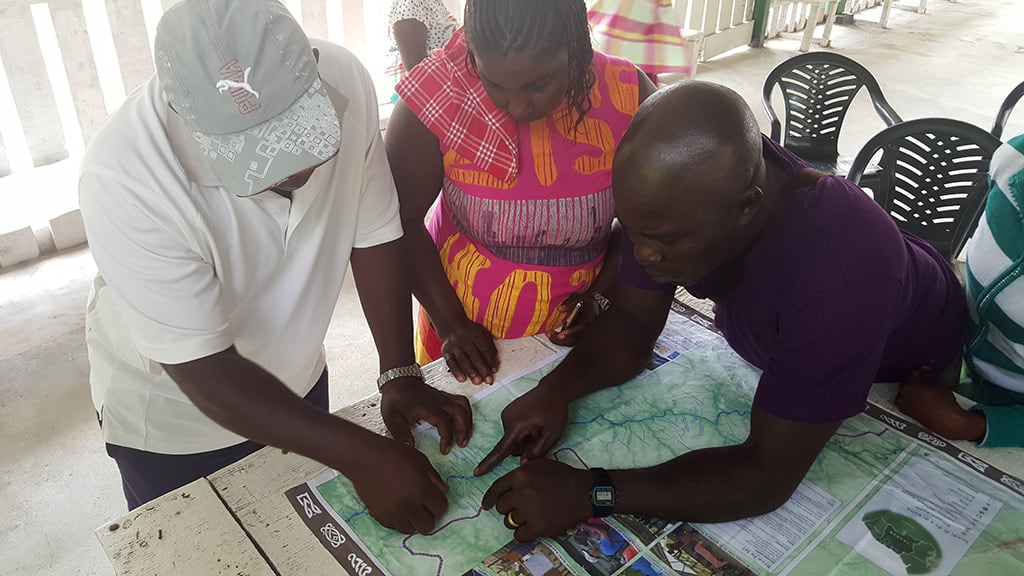 Community members examining and validating maps. Photo courtesy ACT
What’s your advice for other storytellers, particularly when telling the story of another individual or group?
This is a great question. Ideally an individual or group would tell their own stories, without intermediation from an outside party. This is especially true in the case of Indigenous and forest peoples who have had numerous encounters with writers, filmmakers, researchers, and nonprofit staff who have used or shared a community’s story inappropriately.
That said, it may not be possible for individuals or groups to share their story fully on their own, and other storytellers can play a responsible role in helping them share that story. With that in mind, I would consider the following:
- Don’t start the project without first engaging in dialogue with the relevant persons. They might not want to have their story shared, or might not want you to be the one to share it.
- Try to involve the other person or community whose story you are telling as much as possible. Share drafts and acquire feedback as much as you possibly can.
- Listen and learn about how they tell the story. You might have a different angle on what makes it an interesting story than they do, and it’s important to achieve a respectful balance.
- Consider the person or group whose story you are telling as part of your audience. If you are telling the story of a community, are you doing so in a way they themselves will appreciate, learn from, have pride in, and want to share?
- Don’t share or publish anything without first obtaining the full consent and buy-in from the other person or community.
- Ensure that the person or community receives due credit, visibility, and compensation of any kind (if the product has commercial value)—especially when doing this for an organisation. In the nonprofit space, for example, we often fall into the trap of crediting the organisation as being the primary creator, and fail to highlight the community partners whose story or data is what gives the project value.
This article was originally published here.

Think Tank: What Leading Businesses See in Remote Sensing
As business leaders seek safer ways of working during the COVID-19 pandemic, they turn to an innovative trio of technologies.
It happened at remarkable speed, and often with the help of location technology. The COVID-19 pandemic forced companies to adopt novel workflows—some that were already in their infancy prior to the pandemic, and many that will become standard once it subsides.
In one cutting-edge example, a combination of remotely sensed data, AI, and location technology has helped companies maintain customer commitments without putting employees in harm's way.
In this Think Tank, director of Esri Professional Services Brian Cross talks to colleagues Andrew Leason, head of the imagery practice, and Ed Murphy, insurance practice lead, about what companies are seeing from the skies above—and how they’re using that data to their advantage.
Article snapshot: Businesses increasingly need to see what’s happening on the ground without sending employees on-site. The trend that began before COVID-19 and accelerated in the pandemic is now inspiring new levels of innovation.
Brian Cross: Andrew, Ed, thanks for joining me for our latest conversation. Clearly, the world has been adapting on many fronts during this pandemic, and those adaptations have triggered some notable innovations. I’d like to explore the changes you’re seeing in remote sensing and imagery.
To get started, let’s talk about the field of remote sensing and how the technology around it is evolving.
Andrew Leason: Remote sensing is a well-established field with a lot of new wrinkles. In its early days, it involved mostly satellite imagery and photography from planes, but now it also includes drones and sensors that measure everything from soil composition to electromagnetic fields, infrared light, and greenhouse gases.
The new frontier combines remote sensing with machine learning, automated image identification, and other AI techniques to help companies see what they might not otherwise be able to see.
Cross: In the context of this pandemic, can you share some examples where a business might have done something in person in the past, and now, by using remote sensing, they can continue operations without putting people in harm’s way?
Ed Murphy: The example that comes to mind is an insurance claims inspector. If a tree falls on a roof, inspecting the damage has always been inherently dangerous. Now you add a pandemic, and the motivation for doing that remotely has grown even more.
We see innovative companies using drones, satellites, or airplanes with high resolution imagery, along with location technology, to do some of that work from afar. And they’re at an advantage because they don’t need to put people in the field, and they can still respond to clients’ needs.

Lockdowns and the need to minimise human movement and interaction inspired the use of technology to maintain business continuity and serve customers in new ways.
Ed Murphy
A Growing Role for Artificial Intelligence
Cross: For companies and emergency responders who want to assess situations without putting boots on the ground, can you give us a glimpse into the technology making that possible?
Leason: With the new generation of small satellites, aerial flights, and drones, there’s a deluge of remotely sensed data available. That volume of information can’t be handled by a person looking at a screen. AI models are helping analyse that information and extract meaningful insight quickly—like being able to assess damage to a home so the company can deliver a payment to the customer even before the customer is allowed back in their home.
Cross: What does this workflow look like? Are people not involved at all?
Leason: These systems are not infallible, so people are involved. But instead of an analyst flipping through images one by one, the AI system basically analyses the images upfront and queues them for the analyst to verify. That means a person can go from processing a small area to processing a very large area in less time.
Murphy: That certainly applies to field operations and response, but we’re also seeing companies use remote sensing earlier in the customer life cycle. If we stay with the insurance example for a minute, AI models are learning to distinguish between trampolines and pools to help insurers assess the risk of underwriting a property. Behind the scenes, a geographic information system [GIS] connects the imagery to a specific location or street address. Geography is the foundation that ties it all together.
Innovation in Energy, Engineering, Construction
Cross: Outside of insurance, where are you seeing innovation in remote sensing?
Leason: Oil and gas companies have gone through some financial upheaval recently, so they’re looking for additional ways to improve efficiency. Some are diversifying their portfolios to include renewable power sources, and they’re using remotely sensed data to review potential sites for wind and solar energy projects and transmission corridors to distribute the energy they generate.
Companies that transport commodities like oil, gas, water, power, even freight—they’re required to monitor what’s happening along those corridors. Most don’t have the staff to scan hundreds of miles for things like leaks, vegetation encroachment, or faulty equipment. We’ve worked with companies to fly a drone or aircraft along a large section of the easement, then deliver the results to a cloud-based AI system to help operations managers spot issues. Train companies are doing similar work using lidar sensors attached to train cars.
We’re also seeing innovation on infrastructure projects—companies using drones to map a construction site and track daily progress, for example. When you collect images regularly, you create a kind of temporal digital twin that allows you to see how operations and projects have changed over time.
COVID-19’s Accelerating Effect
Cross: This technology and these approaches existed before COVID, and more progressive organisations were already starting to use them. But it seems that COVID became a forcing function, and many organisations sort of made it over the edge because of that.
Murphy: When the pandemic hit and the rules of employee safety changed for most companies, executives had to think differently about how to operate responsibly and efficiently. The pressure from COVID drove this combination of technologies into the mainstream quickly.
Leason: Neural networks have been around for nearly 30 years, but today, the power of computing, the use of the cloud, technologies like Kubernetes—they’re all advancing rapidly. At the same time, the amount of remotely sensed data is exploding—coming from thousands of sources including satellites, aerial systems, drones, lidar sensors, and more.
Those tech advances are coincidental to COVID, but they’re coming at a good time for companies that want to have eyes on the ground without putting boots on the ground.

The combination of AI, remote sensing, and location intelligence enables operational awareness, helps managers cover large areas without workers on the ground, and delivers insight on key business decisions.
Andrew Leason
The Lens Expands—AI and Location Intelligence Enlarge the Scope of Awareness
Cross: Andrew, you’ve been working on a project applying artificial intelligence to remotely sensed data, but at a scale that was unheard of just a few years ago. Could you share what that involves?
Leason: For years, we’ve led projects where we used imagery to identify tree species in a certain area of a forest, for example. But in this project, we combined imagery, AI, and location technology to determine the species makeup not just of a state or even an eco-region but of the continent. That scale is only possible because imagery resolution is improving; AI models are getting smarter; and location technology runs on more powerful computing, which boosts its analytical capability.
And part of that work involves analysing the carbon stock of the country. That’s a growing area of focus for companies, governments, all kinds of organisations—they’re more interested in sustainability every day. When you’re talking about challenges like climate change, you need large-scale awareness to understand where we stand and how we can make the most impact.
Cross: The idea that remote sensing and AI are accurate enough and scalable enough to process the entire nation and give us a holistic view we’ve never had—that’s quite a breakthrough.
Leason: And it’s not just geographic awareness—it’s also awareness across time. We can compare today’s imagery with imagery from 5, 10 years ago and more, and better understand changes across the national landscape. That kind of remote sensing applies to industries like agriculture, ranching, and viticulture that are interested in large-scale surveillance, as well as any industry that’s working on its carbon footprint.
Murphy: Something similar is happening in insurance—companies are looking at portfolios at massive scales now. If we have an insurer with 25 million policies who can use imagery to track daily events, that’s a pretty powerful tool for operating efficiently at scale.
How to Get Started—Building on Existing Location Intelligence
Cross: A lot of readers might be saying, “I run a business or an operation, and this is interesting—but how do I actually apply it to my business problem?” Ed, how do you see organisations applying this new blend of technology to their operations and decisions?
Murphy: Successful businesses focus on a couple of things. One is, while this can be seen as exotic tech, it’s important not to create exotic capabilities in the organisation. We’ve found that successful organisations build on existing initiatives. They might already use GIS-based mapping somewhere in the organisation, and they’ll add this as a new capability rather than creating an exotic hobby for the company.
A second thing is, they’ll identify a real business problem up front—like the need to send workers out to evaluate the condition of a pipe. Can that be done with remote sensing? If you can solve that smaller problem with location intelligence, AI, and remote sensing, then you start to understand what it takes, what the trade-offs are, and what’s possible.
Where Next—AI Classification across Geographies
Cross: We’ve already touched on recent advances in the technology, but what’s ahead for it, and how will that affect business processes?
Leason: One capability we expect in the near future relates to the way AI models classify remotely sensed data like imagery. Today that’s mostly done one scene at a time, but the goal is to be able to tell the AI model to find houses in South Carolina and California, for instance, without it failing because one area is forest and one is desert. If we can start to use this technology not just at scale, but across a large variety of landscapes and environments, then we’ll be even more efficient.
Murphy: It’s also not far-fetched to expect that the convergence of cloud computing, AI, and location technology will start to contribute in real time or near real time. Imagine an organisation that tracks all its vehicles, and also operates drones running an AI program that automatically detects certain conditions in real-time imagery. A drone might spot a damaged building or a field of crops with low water content. At a computing centre in the cloud, the imagery, AI workflows, and workflows for mobile workers converge in near real time. The drone might alert a vehicle to divert and check the event before the driver’s shift ends, instead of putting it in queue for tomorrow’s work crew.
From what we’ve seen in several industries, that future is not so far off.
This article was originally published in the global edition of the Wherenext

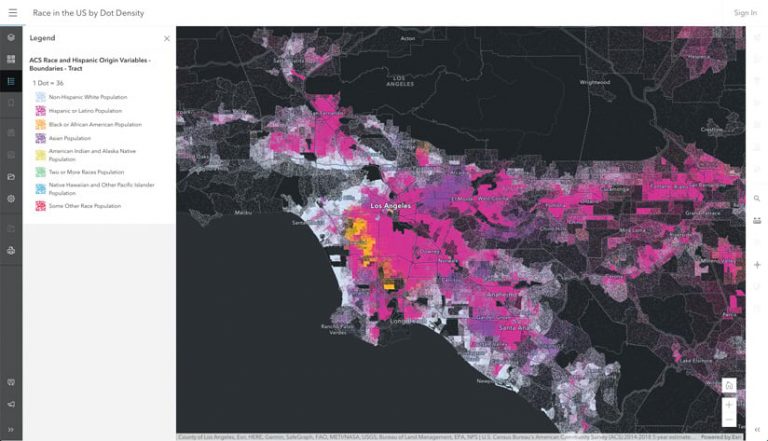
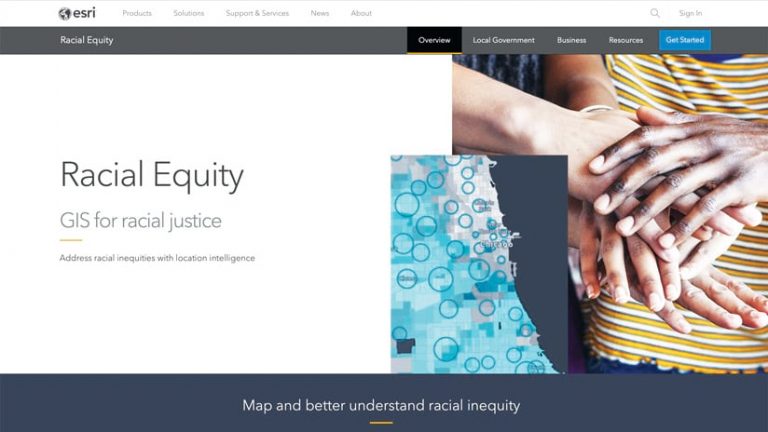
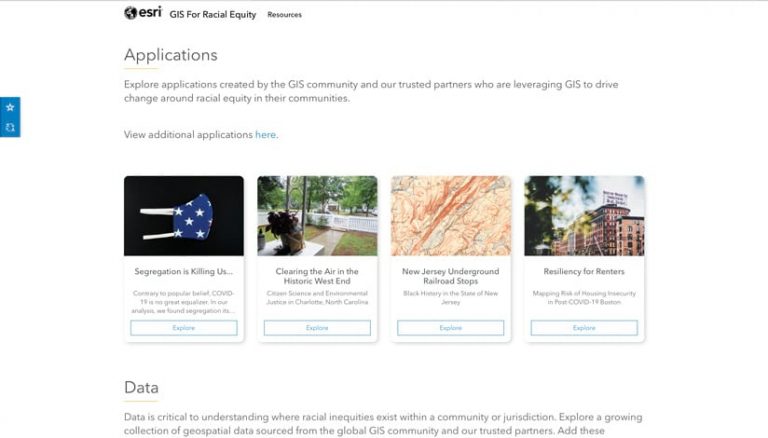
GIS—Visualising Racial Equity
Race and place come together in various ways that generate different outcomes for different people. Too often, this results in racial inequity and social injustice. And none of this happens solely at one moment in time. These outcomes are a … Continue reading →
Race and place come together in various ways that generate different outcomes for different people. Too often, this results in racial inequity and social injustice. And none of this happens solely at one moment in time. These outcomes are a consequence of decades, generations, and centuries of policies, practices, assumptions, and actions.
Understanding entrenched inequities and injustices is complex, and figuring out what to do is a daunting endeavour. But GIS is technology that, at its fundamental level, breaks down complexities and reveals patterns over space and time, which can go a long way toward guiding action. To help users leverage the full power of location intelligence to address issues that revolve around race, Esri has launched a new racial equity initiative.
“We have users in every sector that have expressed interest in using GIS to tackle racial equity and social justice—and that’s not to mention our users who have already been doing this work,” said Clinton Johnson, a solution architect at Esri and the racial equity team lead. “Though our efforts in this space really started about two years ago, formalising this racial equity initiative demonstrates that Esri is stepping into those conversations more intentionally, building solutions and providing resources to help users in the United States and around the world take on long-persisting racial disparities.”
Applying a racial equity lens is key to finding ways to create more equitable opportunities for people.
“Similar to how GIS is synonymous with environmentalism and conservation and how the technology is critical to that movement, we want GIS to be synonymous with social justice,” said Margot Bordne, an account manager at Esri who is part of the racial equity team. “There are so many examples of this already. Many of our users, from governments to nonprofits, are doing pioneering work when it comes to addressing systemic racism and the myriad problems that stem from that. So we’re listening to their needs, learning, and working with them to make sure everything we do is grounded in best practices for racial equity.”
Much of the initiative has so far focused on looking at the range of tools Esri already has available and developing a racial equity workflow that fuses well-established best practices with GIS and location intelligence.
“The four major elements of the workflow are to automate and spatially enhance community engagement, map and analyse inequities, operationalise racial equity best practices, and manage the performance of racial justice initiatives to achieve more equitable outcomes,” said Johnson. “And this cycle revolves around engaging with various stakeholders, from those who experience inequities to community organisations, partners, and leaders who are rallying together and helping to address these challenges.”
Esri’s core technology, such as ArcGIS Pro and ArcGIS Online, is key to visualising racial disparities. Organisations can use their own data or curated datasets that Esri is making easily accessible through its Racial Equity GIS Hub. When combined with other apps and extensions, such as ArcGIS Insights, ArcGIS Hub, ArcGIS Dashboards, and ArcGIS StoryMaps, users can explore practical ways to create more equitable opportunities and services for people.
“If you’re trying to figure out where to place a new hospital or grocery store, you can use Esri tools to apply a racial equity lens to the site selection process,” Johnson explained. “This can help you ask questions like, Will this create benefits for communities of colour or more barriers?”
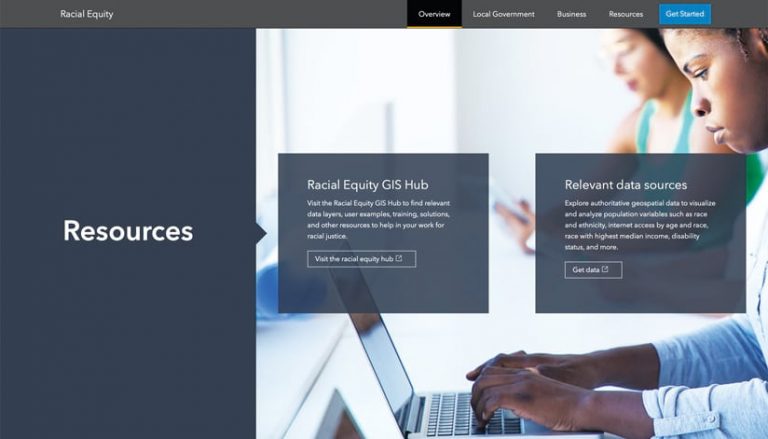
Available resources include Esri’s Racial Equity GIS Hub and authoritative data sources.
Using ArcGIS Survey123, for example, an organisation can better understand the needs of the community it serves. With ArcGIS Hub, it can more easily engage with both internal and external stakeholders. ArcGIS Mission and other workforce enablement tools from Esri can help the organisation automate and track teams that are gathering information or taking action out in the community. ArcGIS Dashboards enables the organisation to show, very clearly, where inequities are and how it is actually working to enact change in those places. And ArcGIS StoryMaps is a great way for the organisation to formulate and share narratives that revolve around racial equity and social justice.
Esri has been adding other capabilities to its technology as well. The Racial Equity Community Outreach solution leverages ArcGIS Online, Hub, Survey123, and Dashboards to help government agencies communicate their progress on defined racial equity initiatives. The solution makes it easy to set up a hub site to promote racial equity programs, build surveys to collect information about community sentiments, and create a dashboard that shows workforce diversity metrics. The new Police Transparency solution is geared toward helping law enforcement agencies rebuild the trust of the communities they serve and increase transparency. It includes a crime stats dashboard and a public crime map; use-of-force dashboards that can be broken down into categories such as race and ethnicity, neighbourhood, or officer; a police interaction survey; and a community safety and policing satisfaction form.
Additionally, Esri is making learn lessons available on the Racial Equity GIS Hub to help users build GIS skills aimed specifically at strengthening racial equity and social justice.
“These learn lessons can help people get familiar with different workflows and racial equity topics that GIS can have an impact on,” said Bordne.
Several lessons are rooted in health topics, such as mapping breast cancer cases by ethnicity and showing which US counties need to improve newborns’ health outcomes. Forthcoming learn lessons will likely explore activism, police reform, the digital divide, and food access.
Esri’s racial equity initiative aims to help users leverage the full power of location intelligence to address issues that revolve around race.
Esri’s racial equity team is also looking to develop solutions that help organisations build a pipeline of new job candidates by connecting them with institutions that serve underrepresented populations, including historically Black colleges and universities (HBCUs); tribal colleges and universities (TCUs), and women’s colleges. And because businesses that are owned by Black, Indigenous, and People of Color (BIPOC) face additional challenges from systemic and structural racism that can make it difficult to thrive, Esri plans to eventually release some tools to help promote and support BIPOC-owned ventures.
While in most cases, racial inequities are weaved into long-standing systems and structures, there are moments when people’s awareness of these social injustices peaks and public outcry demands swift action.
“In these moments, we want our users to be able to act without having to figure out all the logistics,” said Johnson. “So we are tapping into a mechanism that we already have available—the Esri Disaster Response Program (DRP)—to support customers when they need to respond to a situation quickly.”
That is not to say that racial inequity is separate from other disasters, such as the coronavirus disease 2019 (COVID-19) pandemic, hurricanes, or wildfires, because crises like those repeatedly underscore the disparities that communities of colour often face. It’s just another example of how applying a racial equity lens to a geographically based emergency can help organisations respond more effectively.
Many Esri users are doing pioneering work to tackle systemic racism and the myriad problems that stem from it.
“This work that we’re doing is important in a different way than anything else we’ve ever focused on at Esri,” said Johnson. “We are responding to a disaster, really, and it’s one that’s entwined with so many other issues, from climate change and public health to education and the workplace. Racial equity and social justice are central to so much of what we do, so we want to provide solutions to help Esri customers around the world who are stepping in and taking action.”
Find out more about how GIS and location intelligence can help address racial inequity and social injustice.

Attenborough’s Challenge: And how companies can use GIS to respond
David Attenborough is new on Instagram. In his first 5 hours Sir David passed 1 million followers – a new record. His reason to debut? He explained in his first post: “I'm making this move, and exploring this way of … Continue reading →<
David Attenborough is new on Instagram. In his first 5 hours Sir David passed 1 million followers – a new record. His reason to debut?
He explained in his first post:
“I'm making this move, and exploring this way of communication to me, because the world is in trouble. Continents are on fire. Glaciers are melting. Coral reefs are dying. Fish are disappearing from our oceans. The list goes on and on.”
Sir David is spending his tenth decade campaigning for us all to take action. The question for companies is how to respond to his challenge.
You can’t respond to his challenge unless you understand the world around you, and your impact upon it. And to do that, you need a Geographic Information System (GIS).
We asked Chris Jackson, head of commercial markets and sustainability at Esri UK, for his insights into the ways GIS can improve sustainability and contribute to regeneration. Chris is more than an expert on spatial analytics. He's a passionate – okay, obsessive – environmentalist with decades of work in the field. He's always learning. This year alone he completed an advanced course at Cambridge University on promoting sustainability in business.
He says the first step is to map out your goals.
“Business leaders have to urgently rewire their mindsets,” he says. “The scale of the crisis we now face is unprecedented. 2020 has been a tragic year for human health and the economy, but it’s nothing compared to the potential catastrophic impact of human activity to the planet (and thereby humankind) over the next 20 years. Global population is predicted to rise to over nine billion at current rates, whilst most scientists are predicting that the planet will only be capable of supporting between one to three billion if we carry on the way we are.
“Embracing business sustainability in this context can be summarised as looking after the three Ps, which are People, Planet, and Profit - meaning a balanced business approach of social wellbeing and equity, environmental stewardship and economic prosperity.” He adds, with a nod to John Elkington’s original thesis on Triple-Bottom Line accounting and the emerging BCorps movement.
"If you continue to only focus on the bottom line you'll eventually lose customers and staff as they seek alternative companies that demonstrate care for all three. You’re also not making any contribution to Sir David’s cause.”
The belief that there's a trade-off – profits versus the environment - is nonsense, he stresses. Societe Generale, the investment bank, for example, will only invest in sustainable businesses, as these deliver higher absolute returns. Larry Fink, CEO of Blackrock, put sustainability at the heart of Blackrock’s investment approach – with the conviction that sustainability and climate-integrated portfolios will provide better risk-adjusted returns to investors. Going green really will keep you in the black.
Start with a map
So how can GIS deliver results?
It starts with visualisation. “Most businesses run on people, places, and interconnected networks. It follows that most businesses can be described as being ‘geographic’ in one way or another, but many leaders don’t think that way,” says Chris. “You can start by plotting your operations on a map in 2D, 3D or 4D. I've had clients in the past who, when we showed them a map of their sites, suppliers and competition, said it's the first time they've ever seen it.”
This is at the heart of the opportunity. Say the word Geographic to most people and they immediately think back to school of wet school trips and igneous rocks. “We’re trying to adapt that muscle memory and raise awareness of this amazing technology,” says Chris. “It has lots of different names – location intelligence, geospatial analysis – but it’s actually really simple. Just take a step back and look at your business in a local, regional and global context. Everything is connected to everything else. That’s how the world works – and we’re constantly delighted by how powerful this business approach is proving for our customers.”.
Jack Dangermond, Esri Founder and CEO, puts it this way “Understanding where things are, and why, is essential for rational decision-making.”
For Example, mapping out your operations can help reduce your carbon footprint. Routes can be better calculated. Logistics improved. “Spatial analytics can really help,” says Chris. “If you’re only interested in profit, you might think it’s OK to send goods from the Port of London up to the Midlands, where storage is cheaper, and then back down to the South East to be distributed to retail outlets. But what of People and Planet? Finding a location that is closer would definitely reduce carbon emissions and road congestion, as well as potentially reduce stress on drivers. The reduced travel costs, faster service, and potentially increased productivity could thereby lead to more contracts and trigger faster business growth – all of which arguably could outweigh the previous cheaper storage cost. I would much rather invest in a company taking that kind of holistic approach than just looking after the bottom line. Many consumers are voting with their feet for similar reasons.”
Add layers. Then more layers
The beauty of GIS is the way models can be enhanced with more layers. Just add data and keep adding to your model. The results can be stunning.
For example, where should a new store be located? Esri offers the opportunity to weave dozens of variables into a single integrated model.
Chris says: “Imagine you are a retailer opening a new outlet. You need to choose where to put it. Available land, competition, customer profiles, spending habits, transport access, footfall data – the possibilities are limited only by the imagination of the retailer. You can add transport routes for workers based on bus routes, train stations, roads, cycle paths, even distances to employees' homes. The data is rich, for example taking into account average travel speeds and road closures. Then you could filter sites by factoring in the carbon footprint of workers. It's straightforward work for an analyst trained in GIS. So you end up with a location that's easy for staff and customers to access. You'll retain staff and customers over the long term as you've considered their journey. In this way GIS can optimise your environmental impact and contribute to health and wellbeing, as well as improve financial performance.”
This modelling can also be expanded to the entire supply chain.
Chris continues, “Esri offers insights on a global level. You can hold suppliers to account and check they are living up to their commitments.”
Ikea, for example, checks to see if suppliers are harvesting wood from sustainable forests. Any supplier infringing on a protected site is quickly exposed.
Advances in satellite data capture now mean the information available via Esri is near real-time.
“There are thousands of satellites every day capturing images,” says Chris. “Our customers are able to map wildfires, floods, the recovery after floods and the damage caused.”
Maps can be augmented with sensor data to enhance the picture. For example, the GSMA, a world body for mobile networks, is mapping air quality with sensors. It's perfect data for incorporating into a rich map for real time air quality tracking. A company might, for example, want to guarantee workers are not exposed to excessive PM2.5 and PM10 particulates. Sound can also be measured. Even decibels from a facility can be monitored to ensure local wildlife is not disturbed.
Maps can be enriched by a wide variety of additional data. For example, soil composition and geological information improves the risk model for insurers. It's even better in 3D.
Chris says, “Network Rail, for example, has detailed 3D models of the UK rail network, which helps to identify locations at risk of subsidence and flooding. When you make the move to 3D it's just an incredible eye opener. In fact, pretty soon we’ll wonder why we ever did this sort of modelling in 2D. We’re well on our way to delivering the digital twin of planet earth.”
Build operational strength
Modelling the Planet in this way is beginning to improve the way companies treat the other two Ps: People and Profit.
People can be served better when GIS is part of the strategy. For example, the proposed Access to Cash legislation announced in the 2020 Budget calls for equal and fair access to cash machines. This is an inherently geographic, and sensitive issue. “Our library offers a wealth of demographic data,” says Chris. “A bank can factor in age, spending habits and mobility of different neighbourhoods to reveal where ATMs and branches are best located. This could avoid zones of unacceptably low service.”
Profit can be improved too. New products and policies can be built on the back of GIS. For example, insurers increasingly harness GIS to create bespoke offers for households and businesses. Chris explains, “Not that long ago, insurers quoted premiums based purely on postcodes. But postcodes in rural areas can cover many square miles. It’s possible that two houses with the same postcode - one at the top of a hill and one at the bottom in a flood plain would attract the same premium. Likewise with claims fraud – rapid geographic insight means potentially lower pay outs. Satellite imagery is now routinely used to assess storm damage to rooftops. Using accurate location data means fairer premiums, fairer pay outs, a more customer-focussed service, higher customer satisfaction and ultimately higher profitability.”
“In this way, the 3Ps, People, Profit, and Planet are deeply interconnected,” says Chris. “And if you embed them all into your strategy, the long-term sustainability of the entire business can be improved. For example, when companies literally map out their supply routes, they can identify potential issues. If you ship goods through the Gulf of Aden there are multiple risks. Piracy. Political issues. Weather events. Spatial analysis allows you to systematically analyse threats to the supply chain and build contingency scenarios. Maybe plot a secondary route to avoid flashpoints. It's an illustration of how understanding your business geographically can improve long-term performance.”
Reimagine your business and make Sir David proud
Sir David's plea is for all of us to change our thinking. He put it thus: “People are always asking what they can do to turn this situation around. The truth is there isn't one single answer, though we can make a big difference by putting nature at the heart of our decisions.”
GIS is the best way to do that. When companies think of their operations as part of the natural world everything changes.
It's a mission that should unite us all.
“If we don't get this right there won't be a world fit for us to live in,” says Chris. “The stakes are that high.”

Chris Jackson - Esri UK
Chris is a geographer who is passionate about the environment and creating sustainable businesses & communities. Chris has spent over 25 years in high-tech software industry working with mapping and geospatial technology for government and private sector organisations as a technician, consultant and manager. He joined Esri UK in 2001 and holds a Senior General Management position covering a diverse group of industries, delivering solutions to enable Digital Transformation & Sustainability.
NextTech: Tracking Progress toward Net Zero Emissions
With more companies pledging to reach net-zero carbon emissions, demand is rising for technology that can help executives track progress.
The number of companies publicly committing to net-zero carbon emissions has become a meaningful barometer for corporate seriousness about the climate change threat. In October alone, the world’s largest steel company, ArcelorMittal, and Europe’s largest bank, HSBC, added their names to a rapidly expanding group with net zero ambitions, including Google, BP, Walmart, Microsoft, PepsiCo, Apple, Ford Motor Company, Amazon, Verizon, and many others. Most plan to be carbon-neutral in 10–30 years.
With wildfires consuming California, floods blanketing the Midwest, and superstorms striking the Eastern seaboard, the disruptive effects of climate change on everyday life and business continuity are impossible to ignore. Business leaders are rewriting strategies around sustainability and environmental impact, and employing advanced technology like a geographic information system (GIS) to analyse data on how their operations contribute to greenhouse gas production and associated carbon emissions.
A major driver of greenhouse gases is energy use. A recent EPA estimate blamed electricity production for nearly a third of all US greenhouse gas emissions in 2018, second only to the transportation sector. Another study calculated that electricity generation creates 40 percent of global carbon emissions. For business leaders working to become carbon-neutral, getting a handle on power consumption across facilities is likely a top priority.
Article snapshot: As pressure builds for companies to enact net zero plans for carbon emissions, a visual and predictive technology arrives to aid those efforts.
Putting Power in Motion
In order to track, forecast, and visualise factors like energy consumption and its link to carbon emissions, innovative companies are relying on location intelligence—generated by the analytical and predictive capabilities of GIS technology. Executives can use a GIS-powered dashboard or smart map to reveal climate-related data across the geography of their networks, creating a visual picture to clarify decisions about where to makes changes to reach net-zero goals.
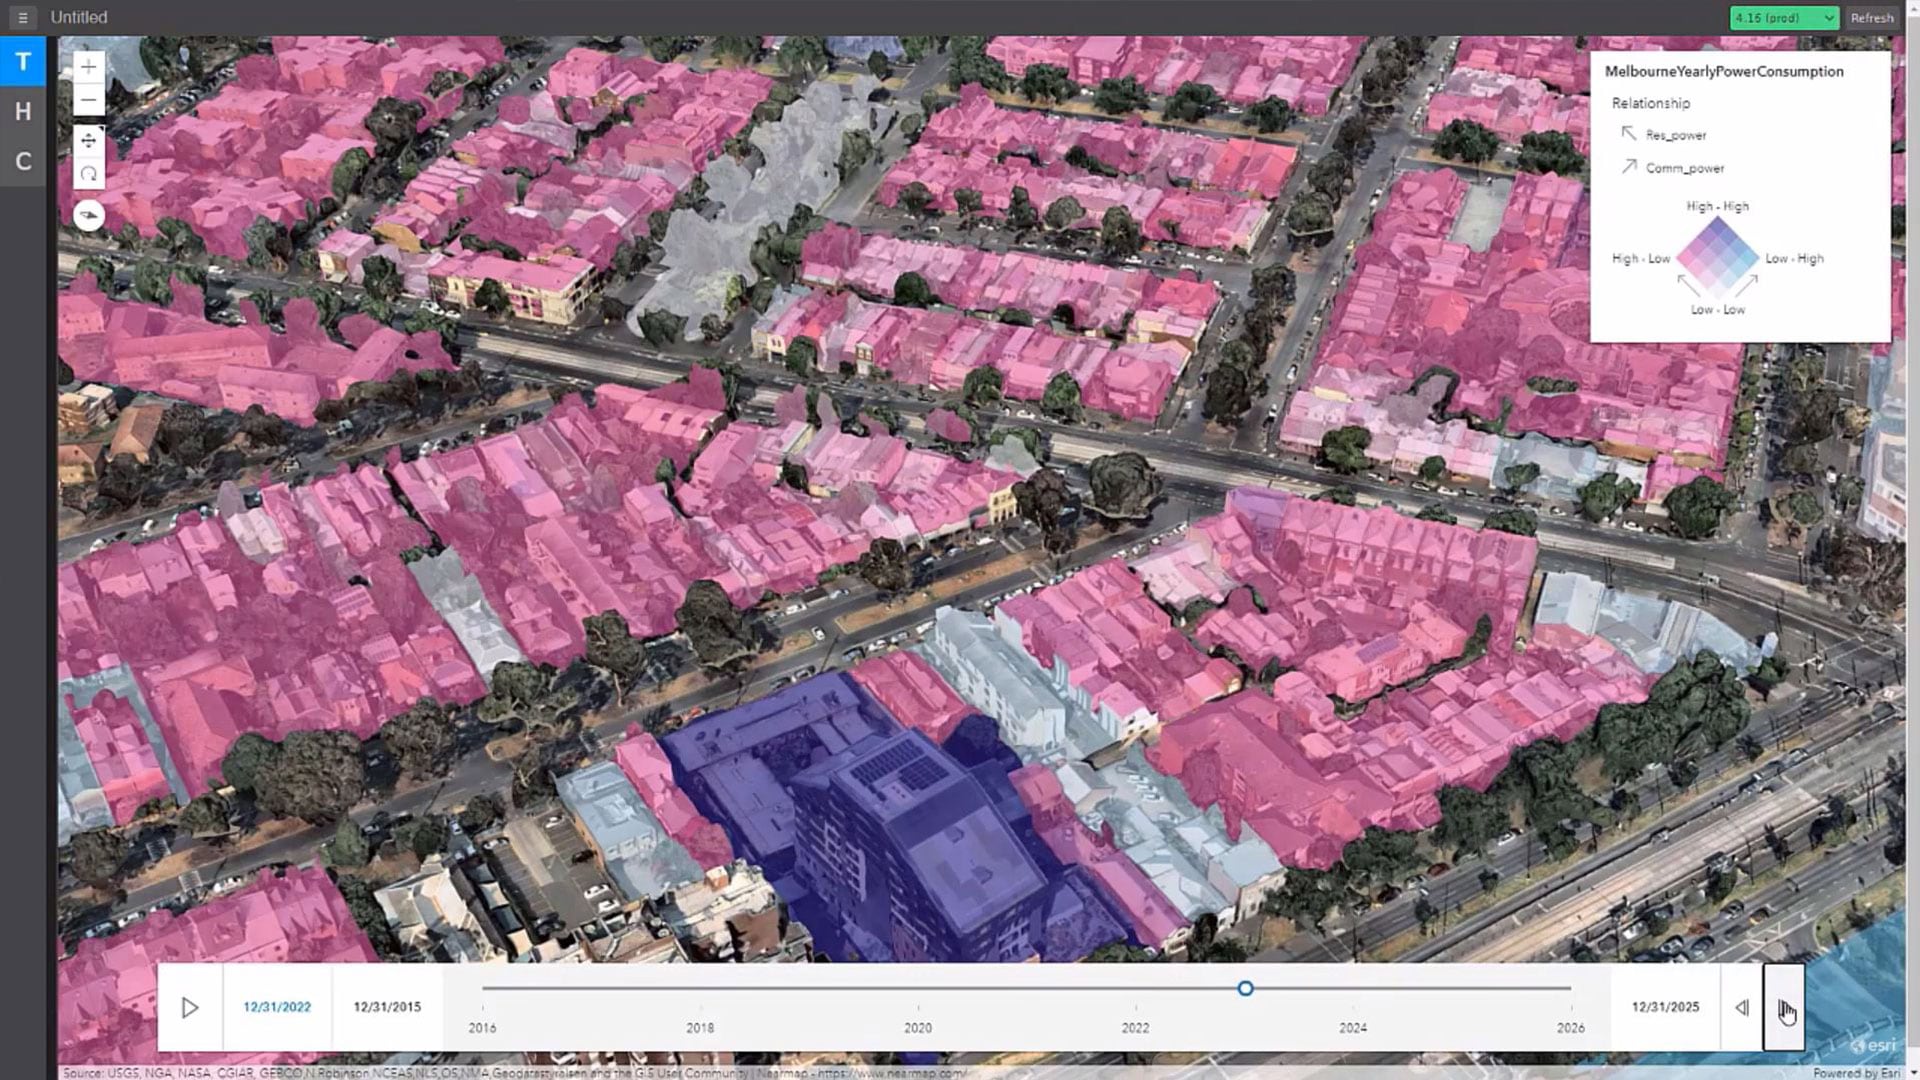
The video below demonstrates the simplicity a smart map can bring to complex tasks like tracking and predicting emissions. Based on a model used by an Australian utility, this map shows four quadrants of Melbourne, forecasting how electricity use is projected to evolve over the course of a decade, from 2016 to 2026. The buildings mapped represent a mix of residential and commercial use; the colour-coded diamond legend designates residential areas in sepia tones and commercial in blue, with hues darkening as power consumption increases.
While executives could study the same data in a spreadsheet, the 3D map makes it easier to see power consumption trends across multiple city blocks. Leaders could use a smart map like this to project various scenarios out to 2050. That is the year many companies have targeted for becoming net-zero because scientists say additional emissions beyond that point will raise global temperatures to catastrophic levels.
By modelling different datasets based on potential changes in energy use—including the effects of renewable energy or more energy-efficient lighting—executives could anticipate how various decisions might lead to different outcomes in electricity consumption and emissions.
More Insight from across the Business World
The complexity of climate change demands systematic thinking at the highest levels of society and business. At the company level, though, the challenge takes smaller form: creating more efficient distribution routes in the supply chain, using renewable energy, and measuring business risk. Check out the Climate of Change series for more on the actions businesses are taking to address the foremost challenge of our day.
The same GIS-based dashboard could be applied to a corporate campus or national network of offices or stores, not only to strengthen decision-making at the C-suite level, but to communicate to shareholders or customers the steps a company is taking to cut carbon emissions, and what that will look like over time.
Steps to A Net Zero Future
Location intelligence can also inform companies’ efforts to take the steps necessary to reach net-zero emissions. Indoor location intelligence, powered by GIS and IoT sensors, highlights trends in office space use, pointing to techniques like automating lights or controlling temperatures to reduce energy use in areas with less foot traffic. Smart maps can play a similar role on a much broader operational scale, giving COOs visibility on their organisations’ carbon footprint throughout supply chains across the globe. That same technology can empower business leaders to identify suppliers or partners that are more conscious of energy use and its effect on carbon emissions.
A goal as big as limiting global climate change can feel daunting, even for internationally minded captains of industry. It can be difficult to see the link between, say, the light switches and thermostats used in corporate offices and the carbon emissions and greenhouse gases generated over decades. The analytics and visual impact of technologies like GIS make it possible to illuminate those links, showing how small steps contribute to real change.
This article was originally published in the global edition of WhereNext

Gaining Retail Advantage in the Post-COVID-19 Era
The key to coming out of the pandemic with the competitive edge? Be agile, know where your customers are, and mind the details in the data.
Editor’s note: As global distribution operations manager at Daniel Swarovski Corp., Richard Bezuidenhout has developed a location technology platform that helps drive sales improvements for Swarovski around the world. Here he offers his perspective on a trying time for retailers—and the opportunities lurking amid the uncertainty.
2020 has probably been the toughest year for brick-and-mortar shopping in modern-day history—and we’re still sorting out the full economic toll of the COVID-19 pandemic on retail business.
IBM’s annual US Retail Index study suggests that COVID-19 has effectively accelerated the shift to e-commerce by five years, boosting some businesses while nearly bankrupting others. Mall-based retailers, already limping due to department store struggles, saw earnings drop a stomach-turning 256 percent in 2020’s second fiscal quarter, according to Retail Metrics.
Other businesses—from grocers to home exercise brands like Peloton—have been unexpectedly overwhelmed with demand. Those with strong e-commerce strategies in place, or the ability to quickly pivot and deliver an omnichannel experience across stores, online, and social media, were poised to reap huge rewards. Amazon posted its biggest profit ever this summer, with 40 percent sales growth over the previous year; Walmart’s e-commerce leapt by 97 percent. Overall, online buying was up 45 percent year over year.
In light of these sweeping changes, a retail executive might be tempted to rip up the roots of their business model and institute hasty reforms. The wiser approach is to analyse granular details about customer preferences and remain agile in responding to them. Retailers who act on location-rich data to place products where customers are, then personalise the shopping experience to suit new habits, will withstand the COVID-19 disruption and excel in the post-pandemic era.
Article snapshot: Retail executives face difficult choices as COVID-19 accelerates changes in shopping behaviour. But writing off brick-and-mortar locations shouldn’t be the first reaction. Here, an industry insider offers advice on using location intelligence to create the best possible retail presence.
The Brick-and-Mortar Challenge: Meeting Customers Where They Are
Location intelligence—business insight derived from analysis via a geographic information system (GIS)—is central to this effort. Location technology can highlight Microtrends specific to one city avenue where a shop is located, or industry-wide changes that shape an entire national network.
With smart maps, business leaders can zoom in to a region or city and take the temperature of stores there through indicators such as customer relationship management (CRM) data, survey data, and demographic information. By juxtaposing those layers with data on online advertising efforts, for example, they can pinpoint where to deploy email blasts alerting loyalty group members to deals on in-demand products, tagged with current inventory numbers.
For a broader view, executives can use a GIS-powered dashboard to gauge the status of hundreds or thousands of stores coast to coast. A colour-coded system showing which stores are closed, open, or partially operating—overlaid with state and local business restrictions—can guide decision-making about how to readjust the flow of supply chains or where to reduce or expand the brand’s footprint.
By analysing data in a way that spreadsheets or PDFs can’t, location-savvy businesses can stay agile and develop techniques to serve them and their customers well in the post-COVID-19 retail era.

Today, it's much more data and analytics-driven than in the past. … You can do much better if you look at the data because you have a much more tailored approach toward the consumer.
Jochen SchmidtVice President, Distribution & Real Estate, Swarovski
The New Climate of Shopping
To paraphrase the 19th century American writer Mark Twain, reports of brick and mortar’s death are greatly exaggerated. There’s no question that consumer attitudes toward in-person shopping are changing drastically, and may never to return to “normal.” For example, the fashion retail brand Inditex, which owns Zara, plans to close up to 1,200 stores by the end of next year. Many empty, darkened boxes in malls and shopping centres may not see another retail occupant again.
Yet one of the insights of omnichannel commerce has been that physical stores do not cannibalise online sales, or vice versa. In fact, one can contribute to the other quite dramatically. An analysis of consumer credit card transactions from 2016 to 2018 found that a customer who spends $100 online will likely spend another $171 in store within the next month. By the same token, an individual who spends $100 in store will on average spend $163 online in the following 30 days.
There is still a primacy to brick and mortar that can’t be entirely replaced by a website, since stores evoke experiences and sensations that a website can’t. And certain products—like jewelry—benefit from a venue where they can be handled physically. But each brick-and-mortar location must evolve if it expects to engage more meaningfully with customers—becoming an experience hub rather than simply a point of sale.
Shoppers tend to spend more in stores than online as brick-and-mortar locations are more likely to catalyse spontaneous purchases, especially at a time when consumers are limiting trips out of the house. In store, customers are exposed to an array of merchandise that can be a chore to slog through in an online catalogue.
Still, savvy retail leaders know the challenge isn’t to pit one mode of customer engagement against the other, but to weave together online and offline marketplaces in a coherent and meaningful omnichannel experience. Now more than ever, executives need to analyse location-specific data to understand who walks into a store and who walks by, determining how to draw that person in.
Upgrading a Location Strategy
With corona virus infection rates and business rules varying significantly by state and country, a store’s location now has a heightened effect on its success and even its solvency. Agile retailers are analysing catchment areas in an effort to cope.
Ideally, retailers will employ a location strategy that is two steps ahead of where the virus is trending, allowing for swift changes. A store in Germany, where COVID-19 has generally been handled well, may need to be able to contend with shoppers willing to wait in lines outside. That same brand may need an entirely different approach to a store in New York City, which has been slow to return to normal levels of retail activity.
On a local level, this calls for a reassessment of catchment areas with the help of GIS technology, which can show how pandemic-related trends in pedestrian movement may be hurting or benefiting certain stores. As people change their daily routines to limit exposure and businesses embrace remote work and less office space, customers may no longer be where they’ve traditionally been. For instance, stores in financial districts that once relied heavily on shoppers from the commuter workforce now must adapt to new patterns.
Our own analysis of catchment areas shows higher footfall traffic and store traffic in small towns and smaller outlet centres than on main shopping avenues, where customers might formerly have spent a day. In response, retailers with slower high street locations can use location technology to analyse buy online, pick up in store (BOPIS) opportunities (also known as click and collect) in those outlets, while raising staffing levels and instituting stronger sanitation procedures in suburban locations that are seeing more business.
Innovative retailers using location intelligence won’t limit themselves to just in-store adjustments, either. For example, with normal exercise routines disrupted, runners have been clogging parks and riverside paths, creating new advertising opportunities for fitness retailers. Small details mined from location data can end up having a profound impact on a brand’s health.

If you look into the details, you'll see clearly the differences between parts of the city, and we start to adjust our assortment according to the demographics.
Jochen Schmidt
The Importance of Being Mobile
Some innovative retail brands are responding to the reality of COVID-19 by quite literally putting their wares where customers are—with pop-up stores, even operated out of trucks. It’s a trend that is likely to continue once the pandemic retreats, and a select group of retailers are perfecting it now. In India, denim companies like Pepe Jeans and Levi Strauss & Co. have responded to deadened traffic at traditional shopping centres by sending retail trucks out to residential areas. These mobile shops are equipped with comfortable work from home garments now in vogue, and can take customer measurements and arrange for items to be delivered after modifications. It’s the kind of agility and location awareness the moment calls for.
One of the most important steps a retailer can take amid these tightened economic circumstances is simply to make sure the right products and in-demand items are in the store. Best sellers should be right where shoppers can see them, and popular secondary items like accessories should also be close at hand. It’s an important retail technique that will outlast the pandemic—and one that can vary markedly by store location. Retailers can find other opportunities to connect with customers by analysing stores with high click-and-collect rates. Merchandise planners can determine which products are often shipped to those locations and identify a complementary product in store. Based on that information, on-site staff can show the complementary product when the customer collects the order.
Indoor location intelligence can play a supporting role. Typically used for maintenance management, HR planning, and security, GIS-powered indoor monitoring can help meet density regulations by tracking how many customers are in a store at a time, while also pointing to helpful data like which aisles or showcases are hotspots of activity. That might provide store managers clues about where to position attention-grabbing products. The technology can connect with mobile apps to help consumers navigate through a large store to the item they’re seeking, increasing safety and comfort for customers nervous about in-person shopping.
A Reshaped Retail Footprint
While many retail closures in recent months have been unavoidable, it would be a mistake for executives to retreat or panic without first studying the data. In many cases, removing a store means a brand is out of sight and out of mind for customers, actually leading to a loss in online sales rather than a gain.
For executives to fully understand the role, revenue, and potential shortfalls of each location, a GIS-enabled dashboard is essential. A smart map of this kind—relied on by retailers such as Walmart and Bass Pro Shops—can guide business leaders through difficult decisions about whether to shutter a store, or perhaps even open a location in an area of rising demand.

Brick and mortar is a super-strong element to build the brand, to communicate with the consumer, to show your brand in a different way. … It is important to have both channels, and we know there is a halo effect from offline to online.
Jochen Schmidt
Getting Personal while Staying Remote
Personalisation is also a key strategy to staying competitive in the age of COVID-19 and beyond, and it requires the kind of granular customer understanding that location intelligence supplies.
For example, a brand initiating an in-store sale or new pop-up experience will want to share that news with customers in the area. Adding a personalised detail to an email—pointing out that the store is just a 15-minute drive away and has implemented extra safety measures, for instance—might be the touch that produces new sales and provides the oxygen required to get a brand through the crisis.
Smart retailers also welcome qualitative information as a complement to data analysis. Collecting survey responses from store employees is an easy, low-cost way to assess an outlet in the new retail landscape, and one that can better link C-suite decisions to on-the-ground data. We hear a lot of talk these days about computing at the edge—it might behoove an executive to think of staff members as critical sensors who can pick up important clues at the edges of the physical store network.
An act as simple as having employees answer five or six questions at the end of their shifts can surface microtrends that highly paid consultants might miss. By collecting intel on what times of day were busiest, which products elicited most interest, or what price points people looked for, retailers can sense the shifting winds of commerce in a certain geographic area. More men are doing the shopping in certain sectors now—will they require a higher level of assistance, or does that pose new opportunities for upselling, if they’re not the typical shopper for that product?
Alternately, location intelligence might guide a retailer to tailor staffing to match people visiting the store, hiring a younger salesperson for the days and hours when college-aged customers frequent that location. This type of spatial intel has been part of corporate responsibility plans to increase racial equity as well, as retailers seek to ensure that their stores reflect their host communities.

If you don't have the right tools, you're putting your finger in the wind and hoping for the best. Using data, you minimise the risk of having a loss-making store.
Jochen Schmidt
Humanising Retail through Data
In an era of big data, a retailer can choose from many data providers. Reliable information is key to understanding current customer needs and possible future customers. Demographics including age, gender, income, and spending habits can be linked by GIS technology to a physical location or catchment area, helping brands identify opportunities and define actions.
Data analytics can often seem cold and clinical—but in fact, when data reveals actionable insight, it helps retailers create deeper connections with their customers. In ways both big and small, location intelligence helps brands meet customers on their terms in this unique retail era.
Consider the simple example of two stores in different regions where in-store capacity will rise from 4 customers to 20 next week. A smart map with integrated weather forecasts could reveal that one store will experience winter-like weather while the other will endure heat and humidity.
With that insight, the location-savvy planner can implement small gestures like setting up heaters or handing out cool beverages to make customers feel at home in the world of brick and mortar, at a time when trips out of the house can feel charged with anxiety.
Scale that across a full portfolio of retail locations, and those little things add up to a big difference for customers, giving location-savvy brands a competitive edge in a year of profound uncertainty and beyond.
This article was originally published in the global edition of the Wherenext

How the World’s Work Spaces Are Changing
A report on the global office market post-COVID-19 suggests that businesses should revisit their location strategy as workplace trends shift.
The global real estate services firm Cushman & Wakefield recently released one of the more comprehensive studies about the impact of COVID-19 on commercial real estate. The report sounded a note of measured optimism about the potential for a full recovery within the decade, while suggesting that some changes are here to stay. With the pandemic unsettling long-held certainties, corporate leaders today must anticipate how present trends like the rise of remote work and office dedensification may play out.
Based on surveys of some of the world’s largest companies as well as analysis of cyclical and structural patterns in the economy, the study found that by 2025, commercial real estate should stabilize to levels of vacancy established before the onset of the coronavirus. But in the short term, negative net absorption—or a net decrease in demand for commercial office space—in the US, Canada, and Europe could reach over 200 million square feet.
The report also contains important clues about how business leaders should respond to geographic and region-specific trends, underscoring the imperative for global companies to incorporate new employment patterns into their work space strategy.
Location intelligence will be instrumental for businesses making decisions both in the short-term, such as how to redesign offices to accommodate returning workers, and in the long-term, like how much of a workforce should remain remote full-time or shift to hybrid models. Understanding the spatial dimensions of these fast-evolving cultural and economic changes can help companies seize opportunities in the market, attract the best talent in the post-COVID-19 world, and maintain staff safety.
Article snapshot: A new report predicts that vacancies in commercial real estate, driven up by COVID-19, will return to pre-pandemic levels this decade. Between now and then, much will change for business executives planning location strategies.
A New Strategy for Commercial Real Estate
The Cushman & Wakefield study makes two things clear. In the short term, vacancies will hit all-time highs, increasing downward pressure on rents. But in the long-term, employment growth and a greater concentration of workers in office environments will power a full recovery for the commercial real estate market in five or so years. In addition, the report shows that the location and region where a business operates will have a strong bearing on what its leaders should expect to see in the coming months.
For example, the share of people working from home in the US will permanently rise to roughly 10–11 percent after the pandemic, from around 5–6 percent prior to the onset of the coronavirus. In China, however, the work from home (WFH) trend is far less pronounced and less common in corporate culture: only 0.6 percent of the workforce was WFH before the pandemic, and even if that number were to double following the peak of the virus, the report’s authors expect it would reduce tenant demand only by 2.9 percent.
Business leaders will need to tailor responses according to location data. Companies with office locations in China should, according to the study, expect job office creation to actually accelerate while rents drop through 2021. That insight could lead an executive of a growing company to pursue an aggressive acquisition strategy to capitalize on higher inventory.
In the US, meanwhile, Google is already planning on incorporating hybrid work models and redesigning office space to allow greater flexibility for employees alternating between WFH and working in the office. Other companies inside and outside the tech world are charting a similar course.
Through anonymized data on human movement patterns, indoor location intelligence can guide decision-making about office layout—including the concentration of small, private rooms versus shared, cooperative work spaces, or the best placement of air filters and sanitation stations. Office design will also need to respond to the sudden reversal of the decades-long trend of densification, in which businesses allocated less office space per employee. As social distancing pushes things in the opposite direction, managers will need to recalculate how to accommodate a workforce that is gradually returning to offices.
Some have suggested that another form of dedensification could occur—companies deemphasizing large urban offices and taking leases on suburban satellite locations. But data on that possible trend remains incomplete.
Finding Fertile Ground to Grow
In rethinking location strategies, business decision-makers must consider how the post-COVID-19 office market will intersect with larger movements in demographics and the labour force. Incorporating the findings of a report like Cushman & Wakefield’s into a GIS dashboard—enhanced by historical data on population growth and the regional concentration of industries–could yield important insight for a business looking to either expand or contract.
According to the study, Canada has typically seen most of its office job growth in the resource, financial, and energy sectors. Now, the technology, advertising, media, and information (TAMI) sector is coming to dominate demand. A smart map loaded with data trends in occupancy and labour costs can point an enterprising tech startup—or perhaps a coffee chain or workout studio favoured by technology types—to certain cities with burgeoning tech scenes like Edmonton or the Toronto-Waterloo Corridor.
The Cushman & Wakefield study highlights how nearly every business decision has a location aspect. For executives choosing the right office location and design in a world reshaped by a pandemic, location intelligence illuminates the deeper spatial dynamics at play in decisions about everything from hiring to site selection.
This article was originally published in the global edition of the Wherenext

COVID-19 Inspires Rethink of Corporate, Personal Priorities
A global survey of executives hints at how the workplace will change post-COVID, with implications for workers worldwide.
When the COVID-19 pandemic subsides, expect to see the boss a little less around the office.
That’s one of the findings of a recent global survey tracking how business leaders and influencers are dealing with the pandemic—and what they plan to change in the workplace once the health threat has run its course.
The COVID-19 pandemic has spawned dashboards and surveys tracking everything from the prospects of second-wave infections to economic consequences of the virus. Now, a global survey of more than 2,000 high net worth individuals and business executives offers rare insight into the mindset of business leaders, including details of their mental well-being, their plans for employees and workplaces, and even how they’ll address their carbon footprints post-pandemic.
Article snapshot: The COVID-19 pandemic is inspiring executives and influencers worldwide to rethink their personal wellbeing, and in turn, adjust workplace practices.
Breaking the Grip of Uncertainty
The primary aim of healthcare provider Bupa Global’s “Executive Wellbeing Index” was to take stock of leaders’ mental states across the US, the UK, France, Egypt, the UAE, China, and Hong Kong. In the process, the study revealed much more, creating a fascinating mosaic of executive outlooks. And—not surprisingly when it comes to business attitudes—geography matters.
Take the economic impact of COVID-19. While survey respondents in all countries believe in what you might call a home-court advantage, the size of such favouritism varied widely by location. In the US, 27 percent of executives were optimistic about the domestic economy, while just 22 percent were upbeat about the global economy. In France, 40 percent were hopeful about the domestic economy, while just half as many were optimistic about global prospects. And in Egypt, 57 percent felt good about the country’s prospects, but just 18 percent had faith in the worldwide economy.
Despite having higher hopes for their home economies, executives did not report a general optimism, and their skepticism is likely rooted in pandemic-related uncertainty. To combat the lack of information, some forward-looking business leaders have turned to location technology for local and multinational data during the pandemic.
For example, this gallery of COVID-related smart maps provides location-specific data on everything from pharmaceutical companies working on a vaccine, to virus patterns in Europe, to a business status dashboard for various counties across the US.
Executive Wellbeing: Working on the Work-Life Balance
In the area of wellness, the survey found that work-life balance would likely change for high net worth individuals and business executives. On a personal level, 93 percent said they would strive to improve their balance post-pandemic, with nearly 30 percent planning to work from home most of the time.
By region, intentions varied widely. In Hong Kong, for instance, COVID-19 inspired a mere 35 percent of business leaders and influencers to re-evaluate their work-life balance; in China the number was 47 percent. In France and Egypt, 71 percent were taking stock.
Executives’ evolving personal habits are likely to influence their plans for employees. Here, too, a respondent’s location seemed to shape their plans. US executives were most likely to express interest in rethinking office space and infrastructure plans—suggesting that some employees might end up working from home permanently or on a semi-permanent basis. That inclination was much less common in the UK (28 percent) and Egypt (29 percent).
Building on their personal experiences, many business leaders are finding that the location technology responsible for delivering clarity on COVID-19 conditions is also helping shape the new era of work. Geographic information systems (GIS) are helping office planners create safe seating plans and work schedules, empowering remote workers to check in via mobile devices, and enabling executives to see at a glance where stores are open and how employees are distributed across a network.

Forty-five percent of business executives and influencers vow to maintain a slower pace in their lives once the COVID-19 threat is resolved.
A Secondary Consequence and a Silver Lining
The most profound consequence of COVID-19 has been its impact on health—in September 2020, the worldwide death toll surpassed 1 million people. But the pandemic has also upended norms in the workplace and society, and challenged people to reprioritize their lives. Optimists might see this as a silver lining with possible long-term benefits.
For instance, Bupa Global found that a quarter of executives plan to reduce international travel in the post-COVID era to lessen their carbon footprint. That could serve two goals—increasing social responsibility and improving executives’ wellbeing. To add accountability to that effort, a C-suite sponsor might work with a location analyst to track travel by the executive team and employees. Visualizing carbon impacts on a map could strengthen executives’ commitment to positive change.
Trimming carbon footprints is just one of many ways executives might adjust. Across the globe, 61 percent of leaders and influencers said they will continue to use business practices developed during the pandemic. Armed with an appetite for change and technology to support their plans, they may end up writing a positive footnote for an otherwise grim chapter in history.
Photo courtesy of #WOCinTech Chat.
This article was originally published in the global edition of WhereNext